
Tag: Animated timeline
-
Shipwrecks of the world, and how many over time
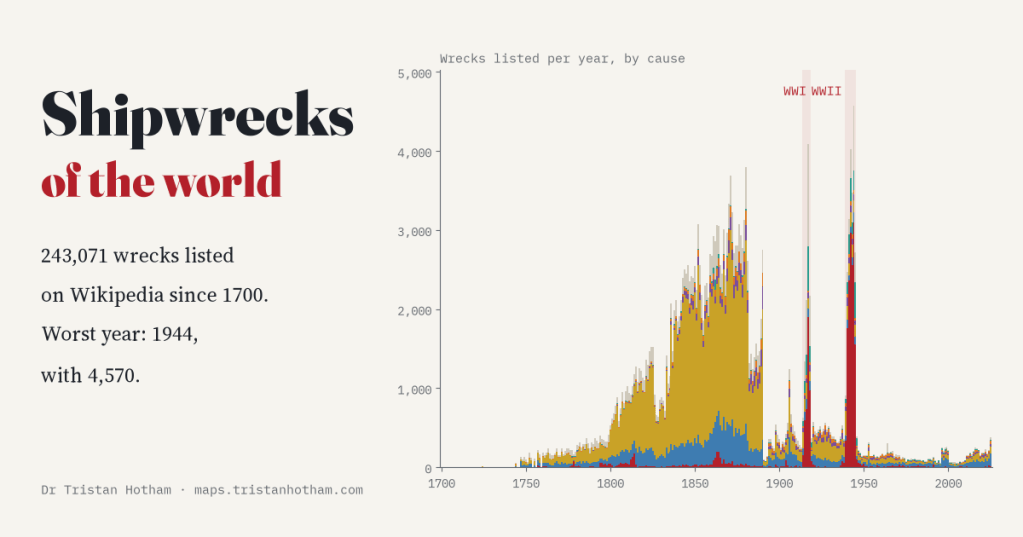
Wikipedia lists 243,071 shipwrecks since 1700. I counted them year by year: three of the five worst years are war years, with 1944 the worst. The huge 1800s plateau owes a lot to British newspapers.
-
Who held the map? Twelve centuries of the world in flags
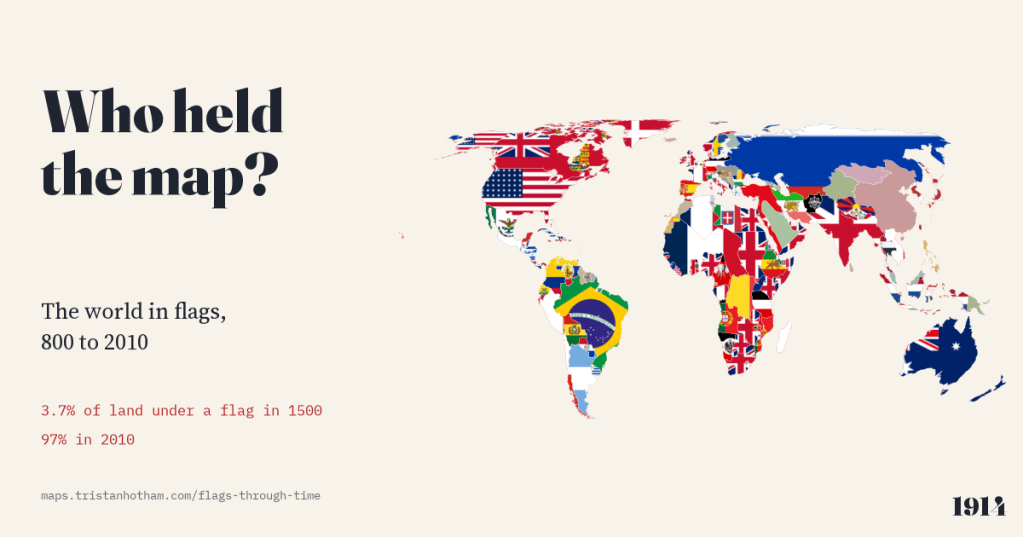
The world map from 800 to 2010, each piece of land filled with the flag of whoever held it. In 1000 no land can honestly be shown with a flag; in 1500, 3.7%; by 2010, 97%.
-
The plague years: five centuries of plague, mapped year by year
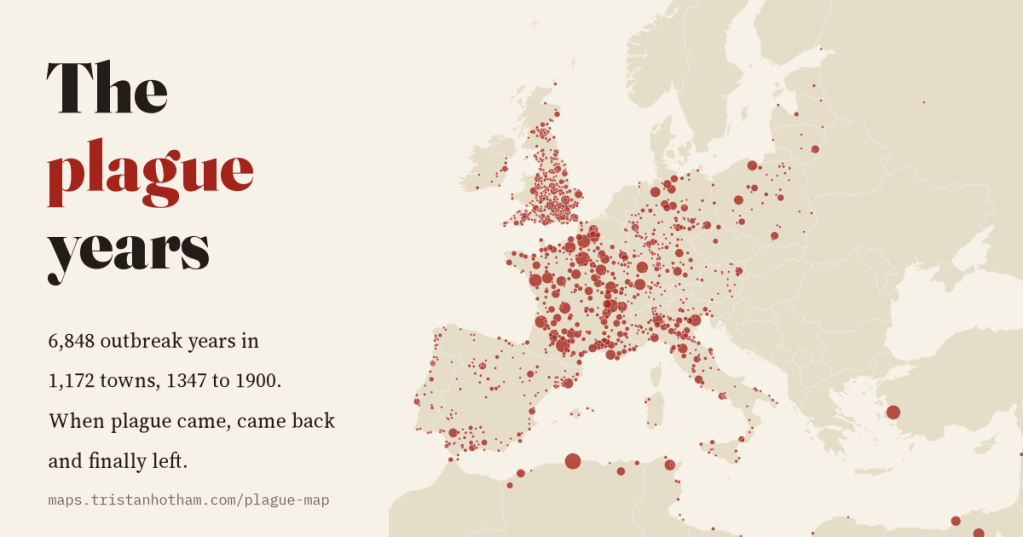
6,848 recorded outbreak years in 1,172 towns, from the Black Death in 1347 to Porto in 1900: how plague spread, kept coming back about every 13 years, and left Europe a century before the Ottoman Mediterranean.
-
Where the wind blows: the world’s winds, and are wind farms in the windy places?
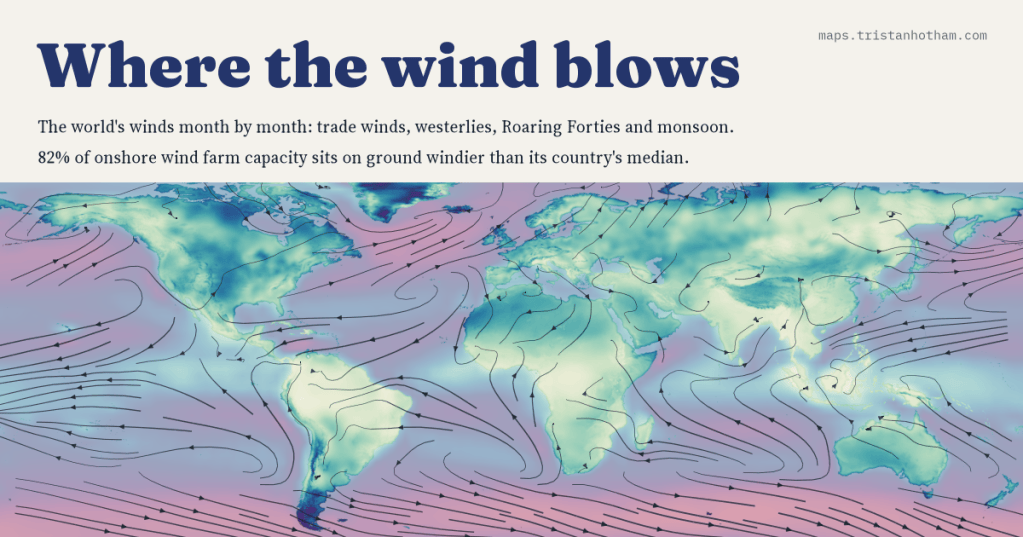
I mapped the world’s winds month by month, from the trade winds to the Roaring Forties and the monsoon, and set 5,344 wind farms against the wind at their sites. 82% of onshore capacity stands on ground windier than its country’s median.
-
When the ice came south: the ice ages mapped, and what lies under them today
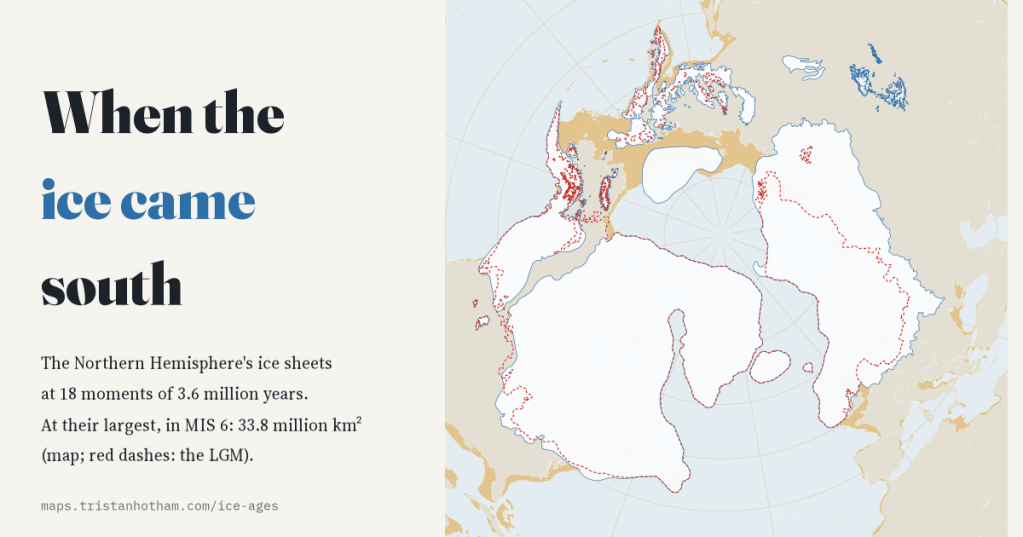
I mapped the Northern Hemisphere’s ice sheets at 18 moments of the last 3.6 million years. The last ice age was only the 4th largest; 709 of today’s cities and towns, New York among them, stand on ground its ice covered.

