
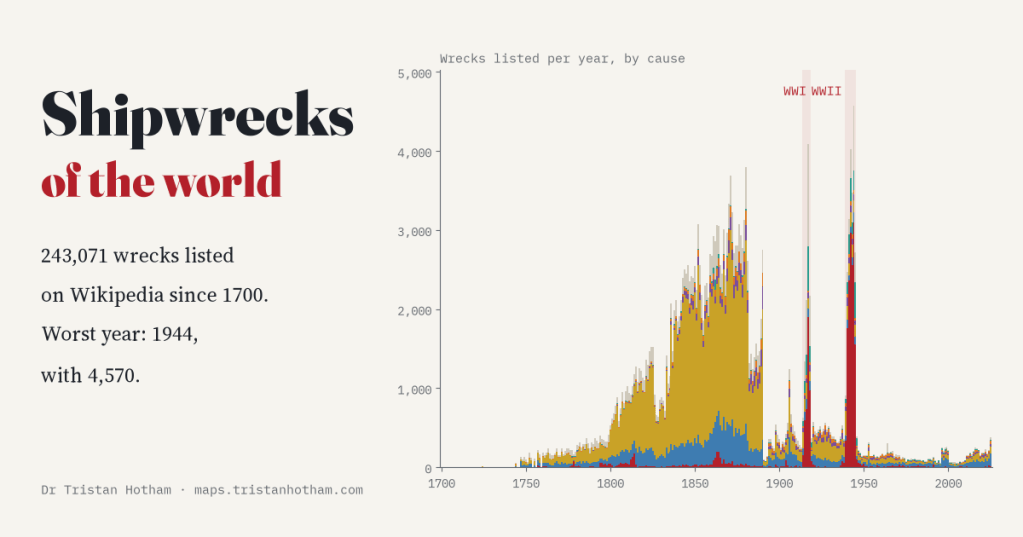
Wikipedia’s volunteers have listed 243,071 shipwrecks, year by year, since 1700. I counted them all. Three of the five worst years are war years, with 1944 the worst of all. But the biggest pile of wrecks comes from the 1800s, and that tells a story about British newspapers as much as about the sea.
Tucked away in English Wikipedia is one of the most patient pieces of volunteer history I know. For every month since the 1820s, and for every year or decade before, there is a page called “List of shipwrecks in…” Each one lists the ships lost, day by day: the name, the flag, and a line on what happened. “Driven ashore near Whitby.” “Foundered in the North Sea; her crew were rescued.” “Torpedoed and sunk by U-boat.”
I turned all of those pages from 1700 to 2025 into one table. Once I had removed duplicates it held 243,071 wrecks. Then I counted them, year by year, by cause and by flag.
The wars
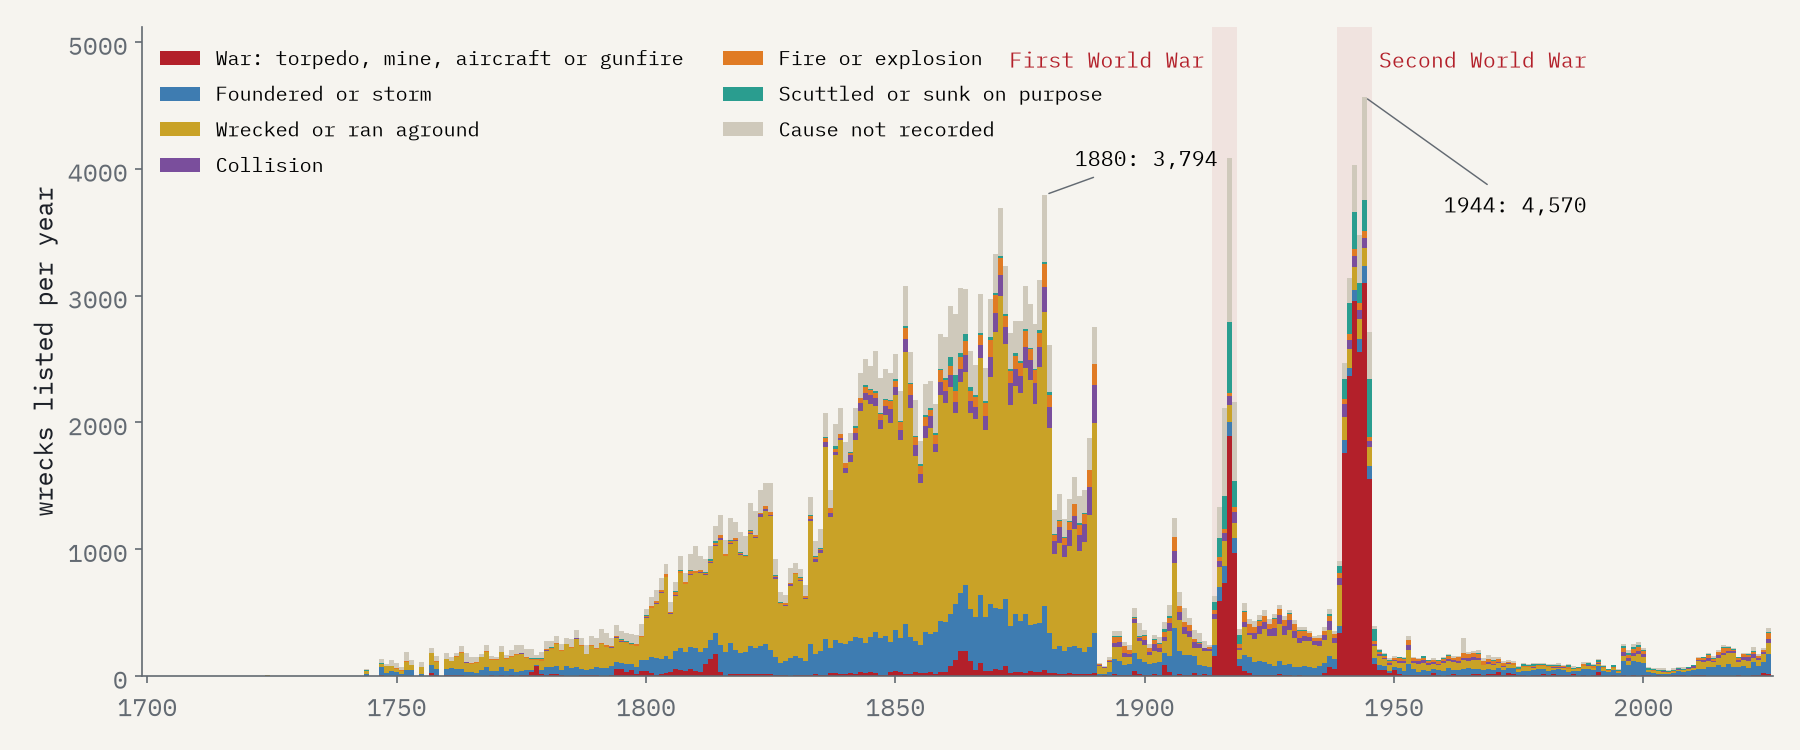
The two world wars stand out exactly as you would expect. The single worst year is 1944, with 4,570 wrecks listed. Second is 1917, the year Germany turned to unrestricted submarine warfare, with 4,083, and third is 1942, with 4,027. Across the Second World War the lists average 3,044 wrecks a year, 6.9 times the rate between the wars, and 69% of them were lost to war: torpedoes above all, then bombs from aircraft, mines and gunfire.
The age of sail, and Lloyd’s List
The surprise is how close the 1800s come. From 1850 to 1879 the lists average 2,746 wrecks a year, and in 1880 they reach 3,794. 71% of all the entries are from the nineteenth century. These were mostly not dramatic losses: 65% of them were ships that ran aground or were driven ashore in bad weather, and many crews got off safely.
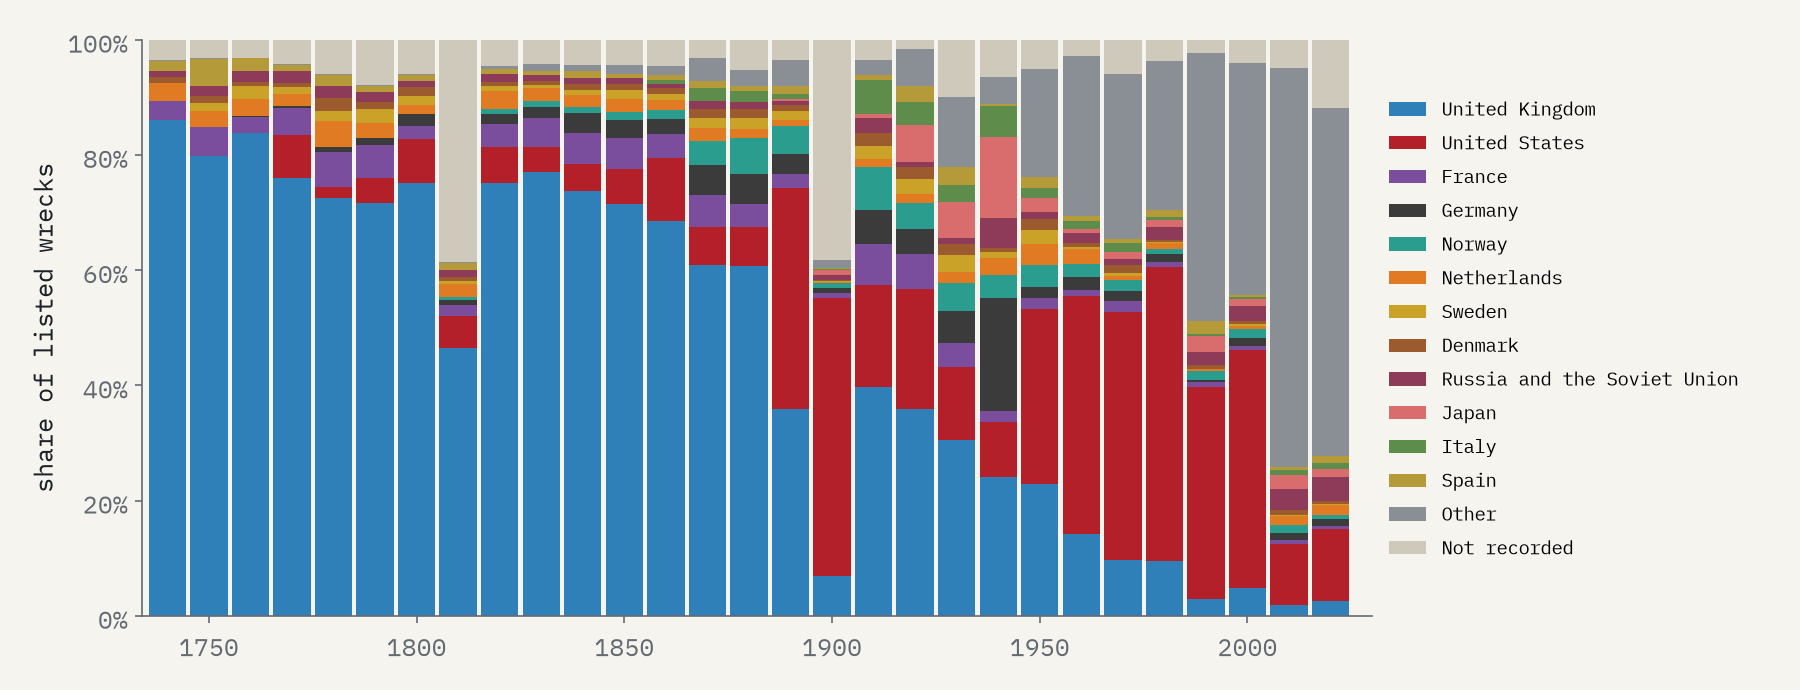
Some of that is real. The sailing coasters and colliers of the 1800s were wrecked in enormous numbers. But a lot of it is the record. The Wikipedia editors who built these pages worked largely from British newspapers, and above all from Lloyd’s List, which reported every British loss it heard about. 66% of the 1800s entries are British ships. When the newspaper runs thin out, so do the lists: from 1890 to 1913 they average just 483 wrecks a year. Shipping did get safer as steam replaced sail, but not that suddenly.
The timeline of shipwrecks is half a history of loss and half a history of the people who wrote the losses down.
Whose ships
Over the whole period 56% of the listed wrecks flew the British flag, then the United States, Germany, France and Norway. In the Second World War the British share falls to 24%, as German, Japanese, Italian and Soviet losses join the lists.
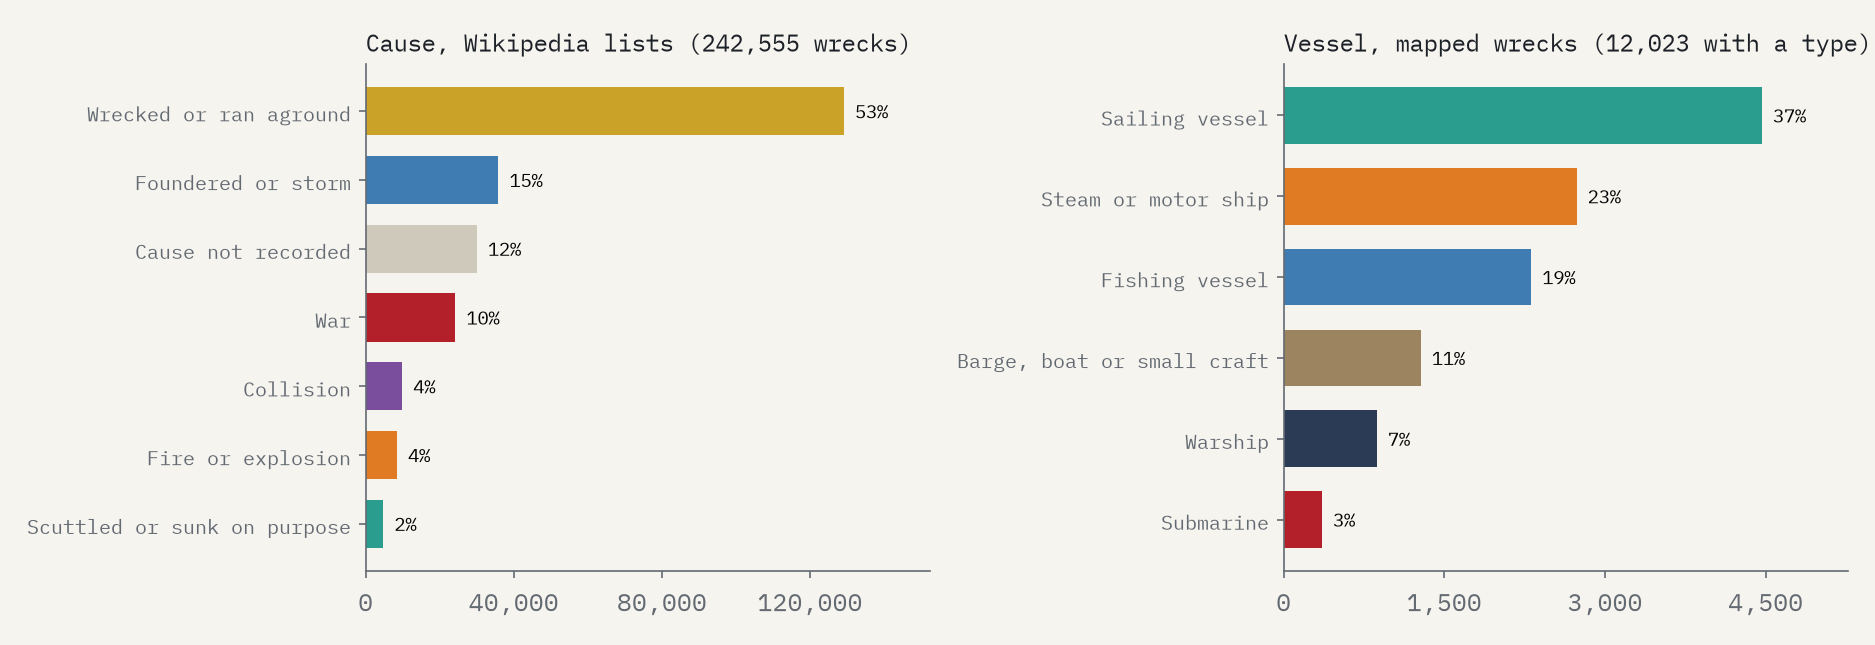
Over everything, most ships were wrecked rather than sunk: 53% of the entries ran aground or were driven ashore, 15% foundered at sea, and 10% were lost to war.
The map
Most list entries have no position. The 15,133 that do are mostly war losses, logged at the time, so they spread across the North Atlantic, the Mediterranean and the Pacific. I added every wreck in Wikidata and the United States wreck charts, for 52,124 wrecks with a place. The interactive map has a year slider with a play button, decade buttons, filters by cause and flag, and a sea-depth base map.
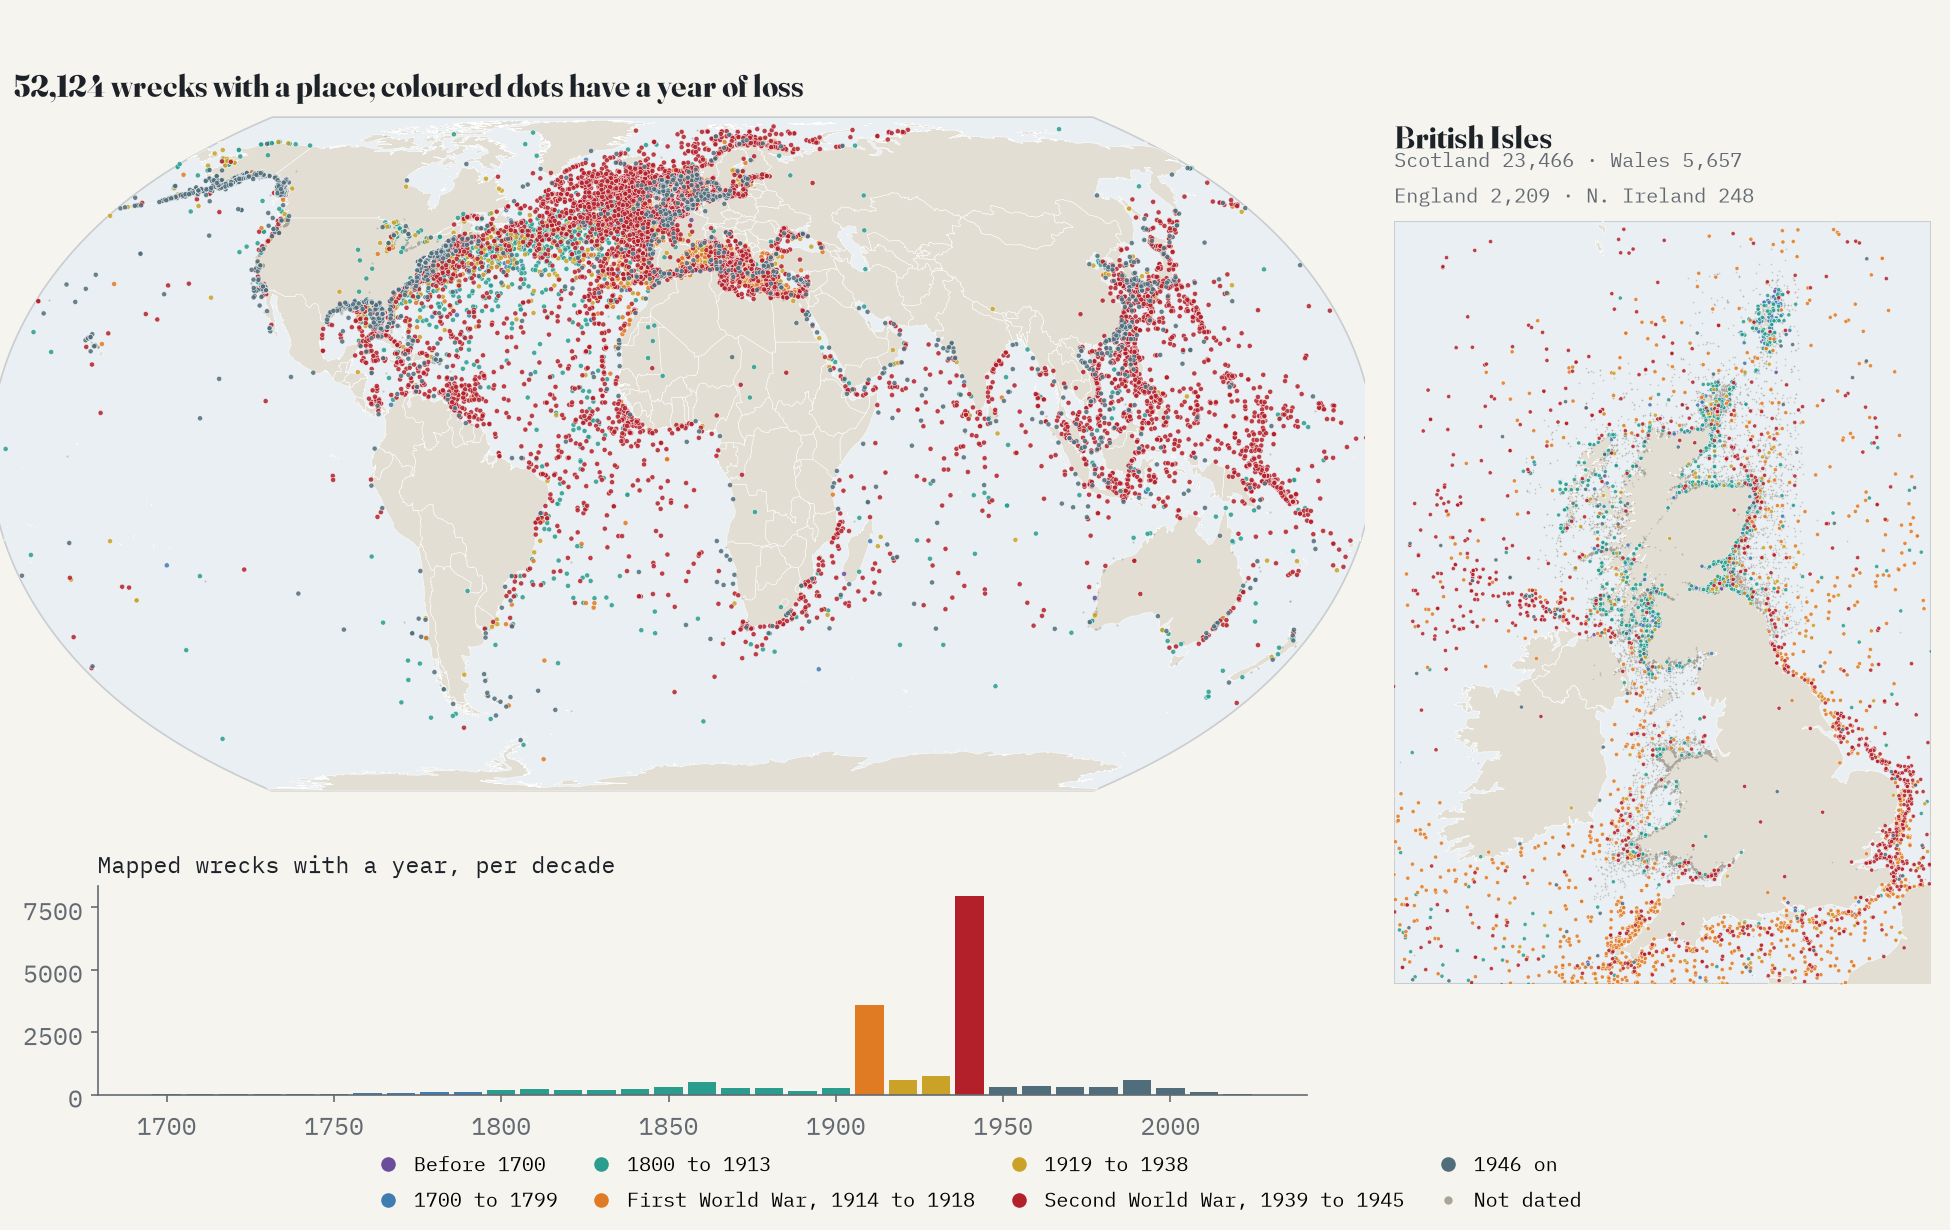
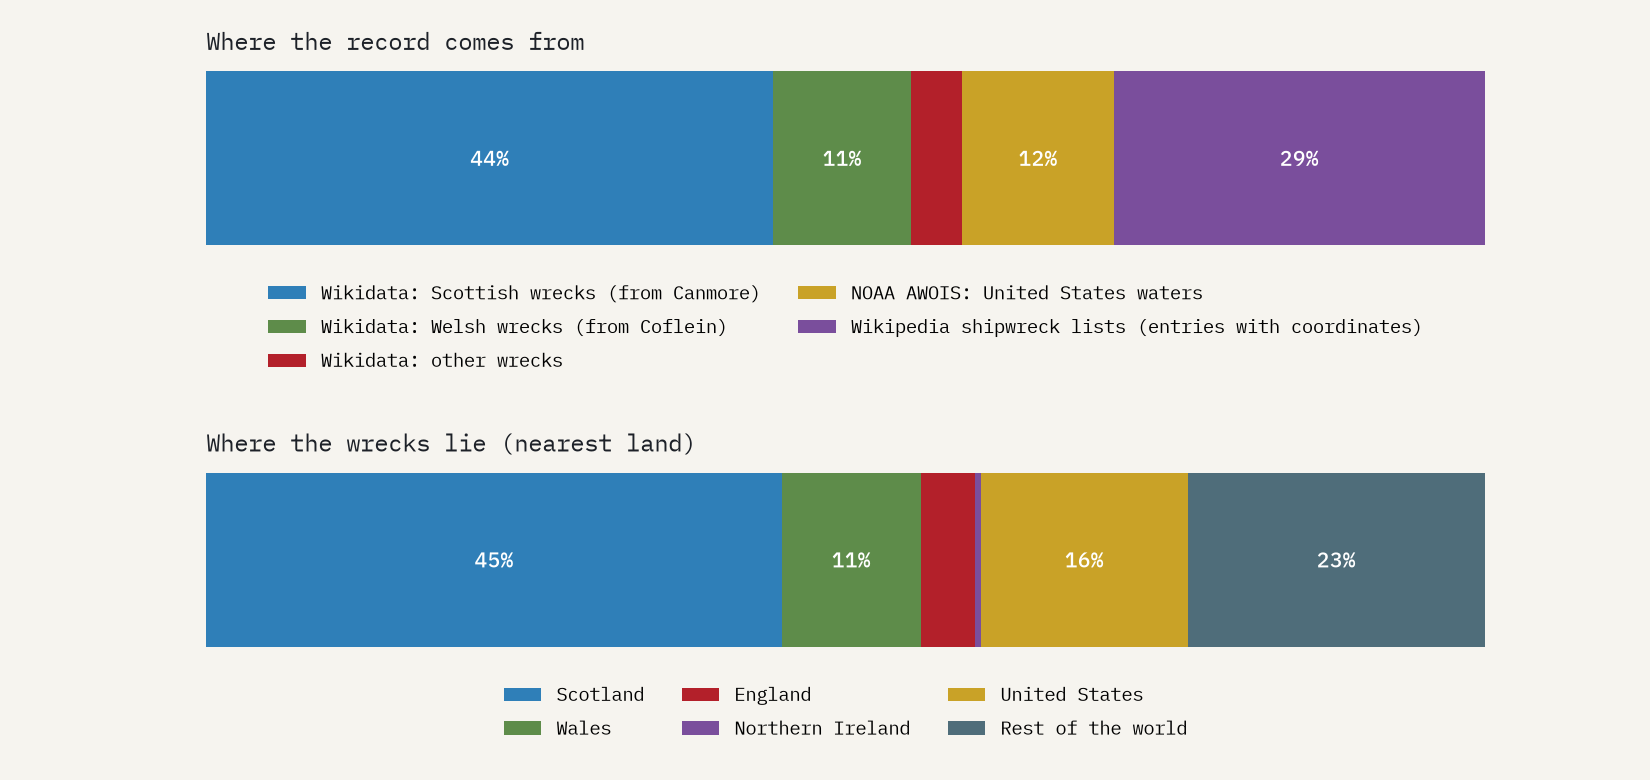
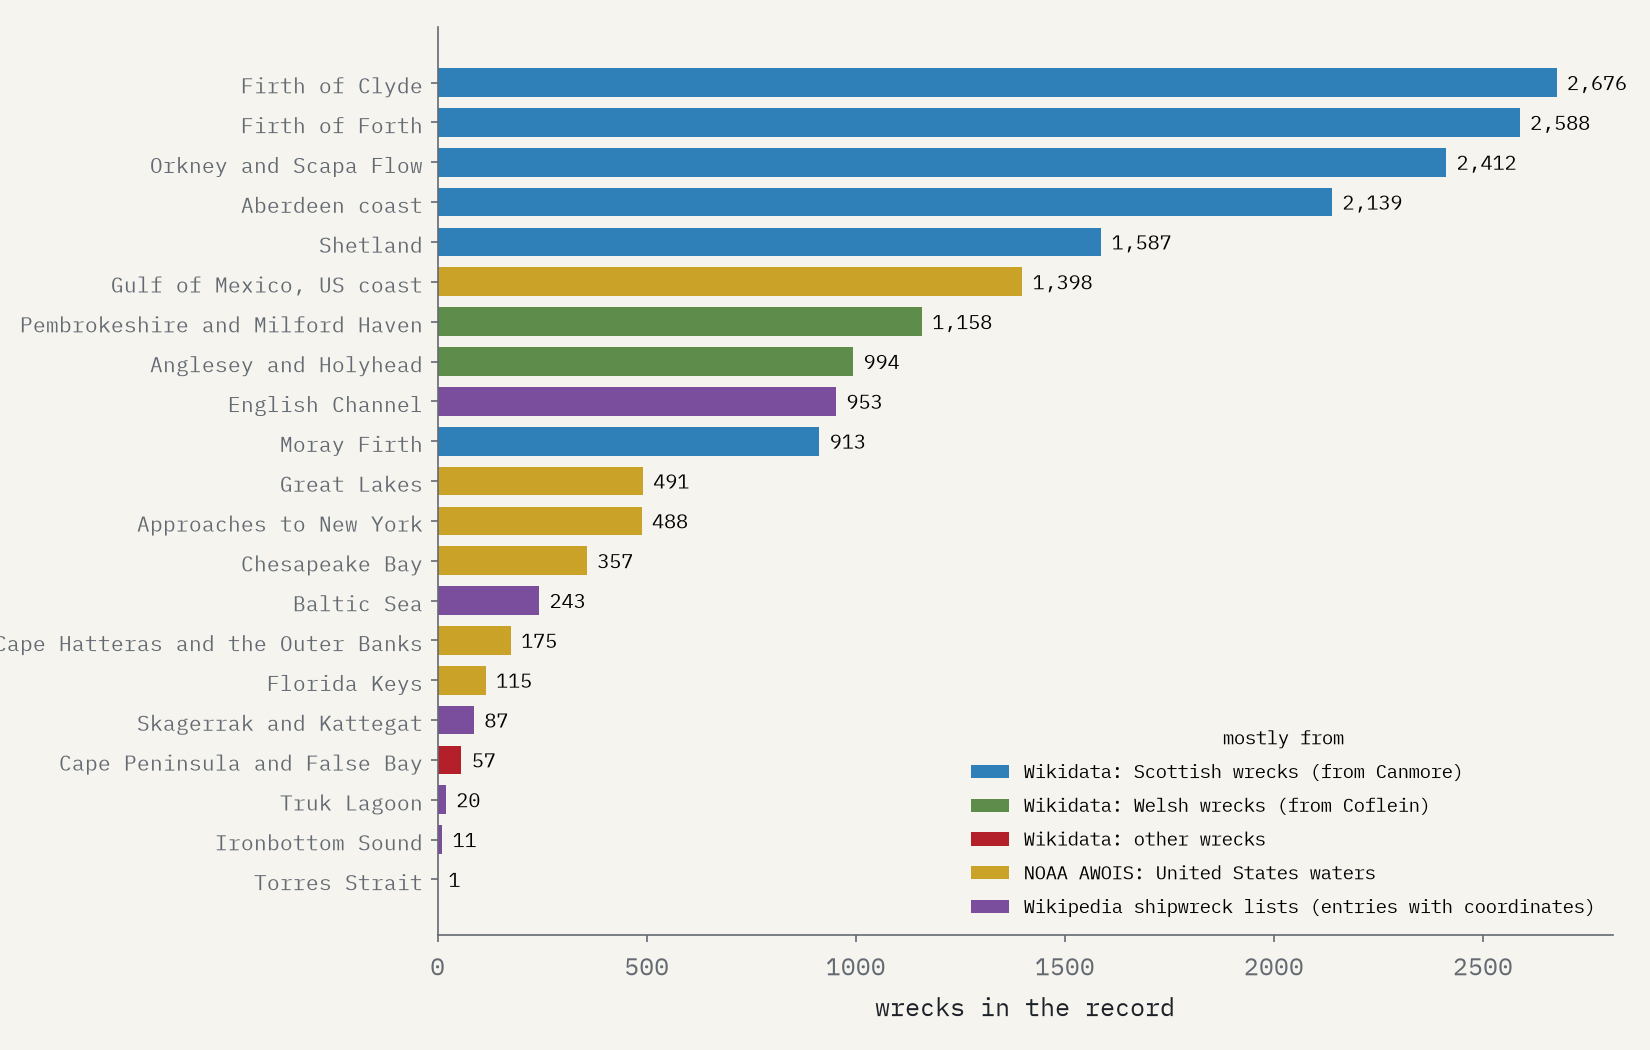
The map has a bias of its own. 61% of the mapped wrecks lie in UK waters, 45% off Scotland alone, because Wikidata imported the heritage records of Scotland and Wales wholesale. Scotland has 10.6 times as many mapped wrecks as England, which certainly lost more ships.
How I did this
The lists come from a table scraped from every English Wikipedia “List of shipwrecks” page for 1700 to 2025, with ship, flag, a cause sorted into buckets and, for a minority, coordinates. I removed repeats of the same ship under the same date on the same page, grouped flags across regimes (the German Empire and Nazi Germany as Germany, for example) and grouped causes. For the map I added Wikidata’s shipwrecks, with extra event dates, and NOAA’s Automated Wreck and Obstruction Information System for US waters, and skipped list entries that matched a mapped wreck. I never guess a year from a launch date or a war. These are counts of recorded wrecks, not of all wrecks: the paper sets out every step and caveat.
Notes and sources
- Wikipedia contributors, Lists of shipwrecks (CC BY-SA 4.0). The structured table derived from them is shared under the same licence with the data.
- Wikidata (CC0), queried with QLever; many records were imported from Canmore and Coflein.
- NOAA Office of Coast Survey, Automated Wreck and Obstruction Information System (public domain), via a copy on GitHub.
- Summary Geodatabase of Shipwrecks 1500 BCE to 1500 CE (Harvard Mapping Past Societies, with the Oxford Roman Economy Project), used as counts only on the interactive page and in the paper.
- Natural Earth outlines (public domain). Base map tiles on the interactive page © Esri.
- I wrote the text, with drafting and editing assistance from Claude (Anthropic), which also helped prepare the analysis code. I reviewed and checked all text and results.

