
Tag: data visualisation
-
Where games are set, and where they are made
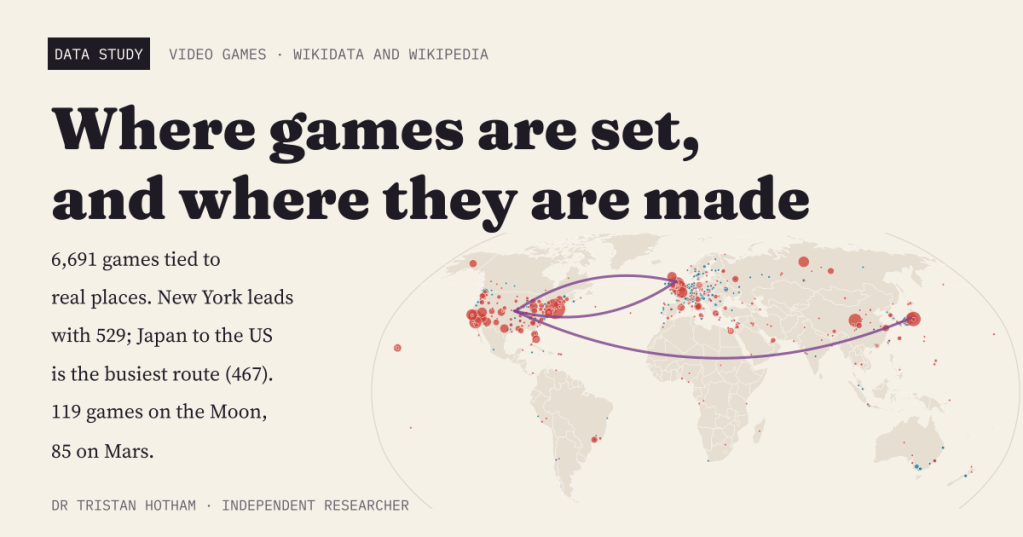
A world map of 6,691 video games tied to real places: where each is set and where its studio is based. New York leads, Japan to the United States is the busiest route, and the Moon beats Mars.
-
Sun and rain: the world’s sunshine against its rainfall
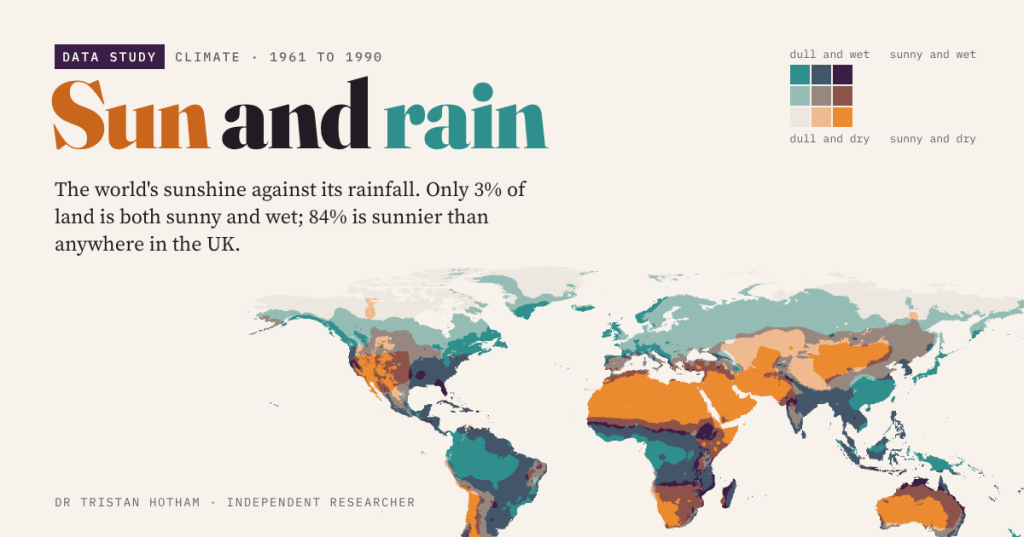
Sunny and dry, sunny and wet, dull and dry, dull and wet: a map of the world’s sunshine against its rainfall. Only 3% of land is both sunny and wet, and 84% is sunnier than anywhere in the UK.
-
Did the Pits Closing Still Show?
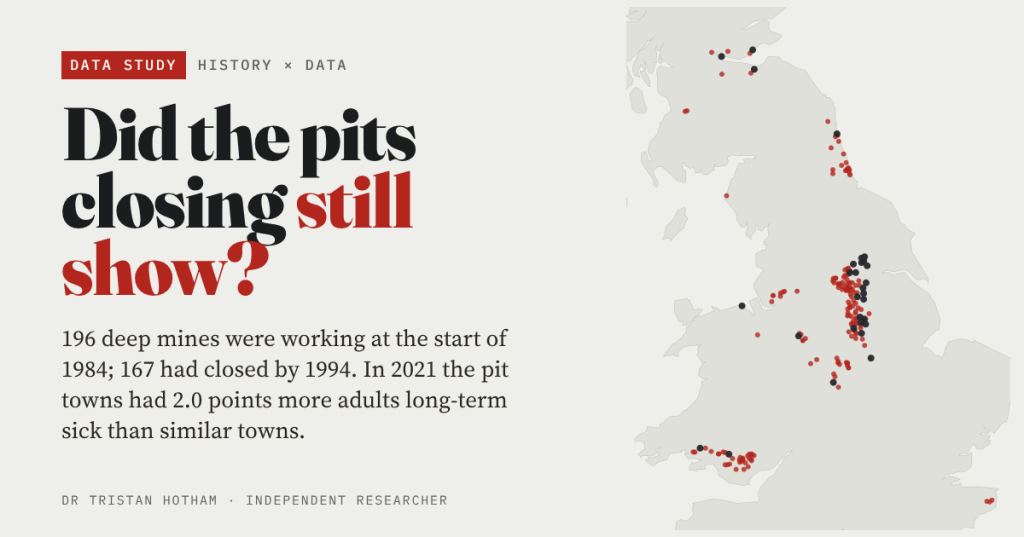
196 deep mines were working in Britain at the start of 1984, and 167 had closed by 1994. Forty years on, the pit towns of England and Wales have 2.0 points more adults long-term sick than similar towns, whenever their pit closed.
-
Did the railway invent the seaside?
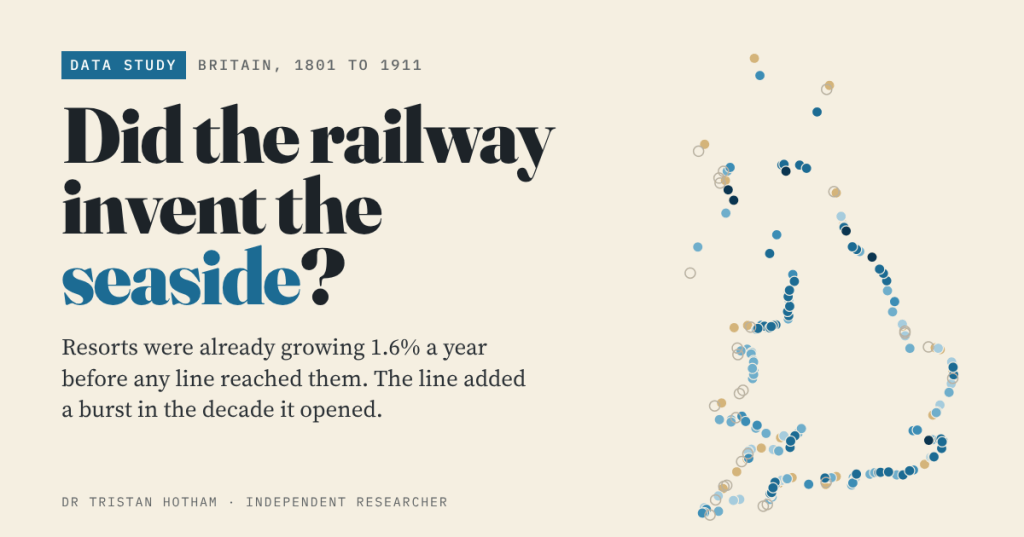
Britain’s seaside resorts were already growing 1.6% a year before any railway reached them. The line brought a burst in the decade it opened, and did most for resorts that had been slow before.
-
Captain Swing: did the riots follow the machines?
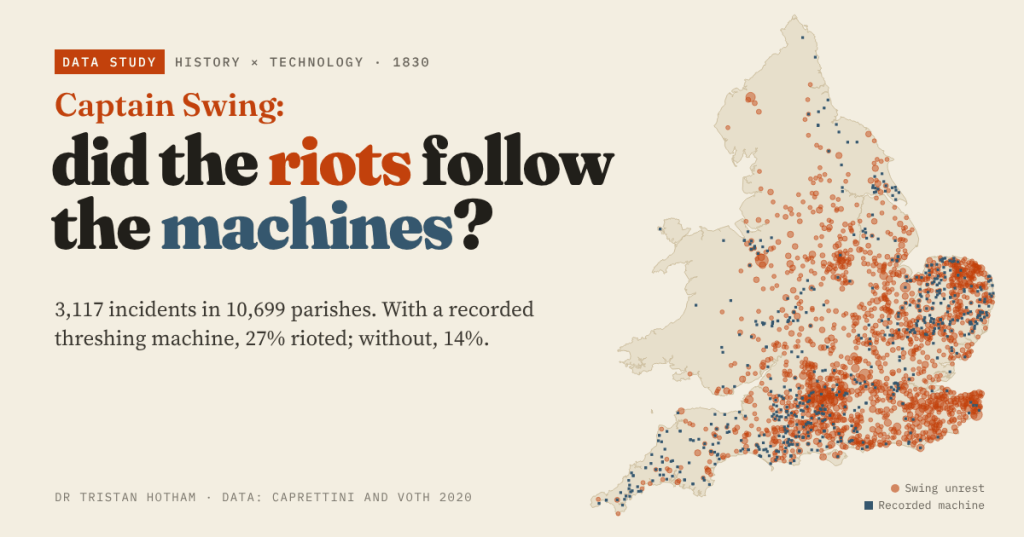
In 1830 English farm labourers smashed threshing machines. Using Caprettini and Voth’s open data I mapped 3,117 Swing incidents: parishes with a recorded machine were twice as likely to riot, but 90% of riotous parishes had no machine at all.

