
Tag: data visualisation
-
Captain Swing: did the riots follow the machines?
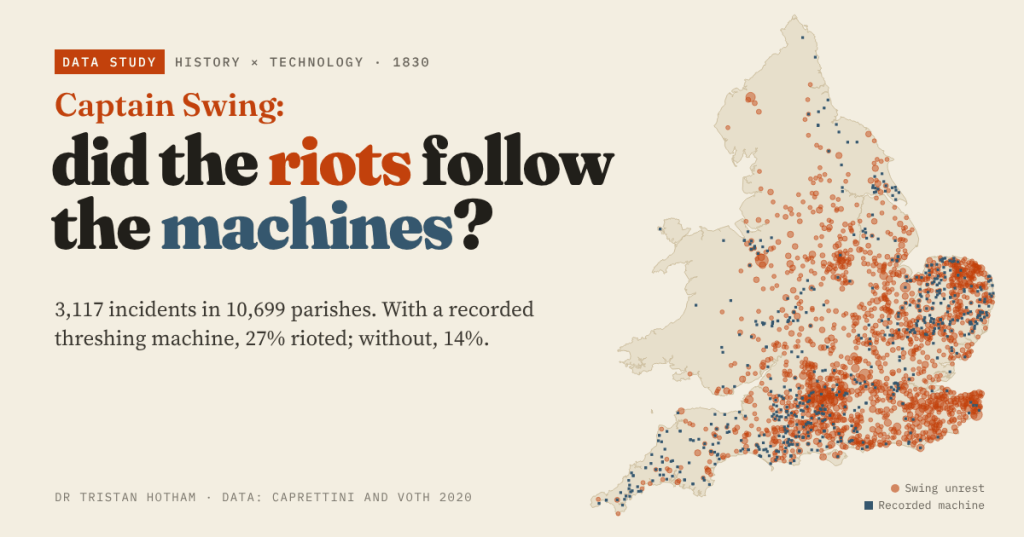
In 1830 English farm labourers smashed threshing machines. Using Caprettini and Voth’s open data I mapped 3,117 Swing incidents: parishes with a recorded machine were twice as likely to riot, but 90% of riotous parishes had no machine at all.
-
Britain’s last line of defence: the pillboxes and stop lines of 1940
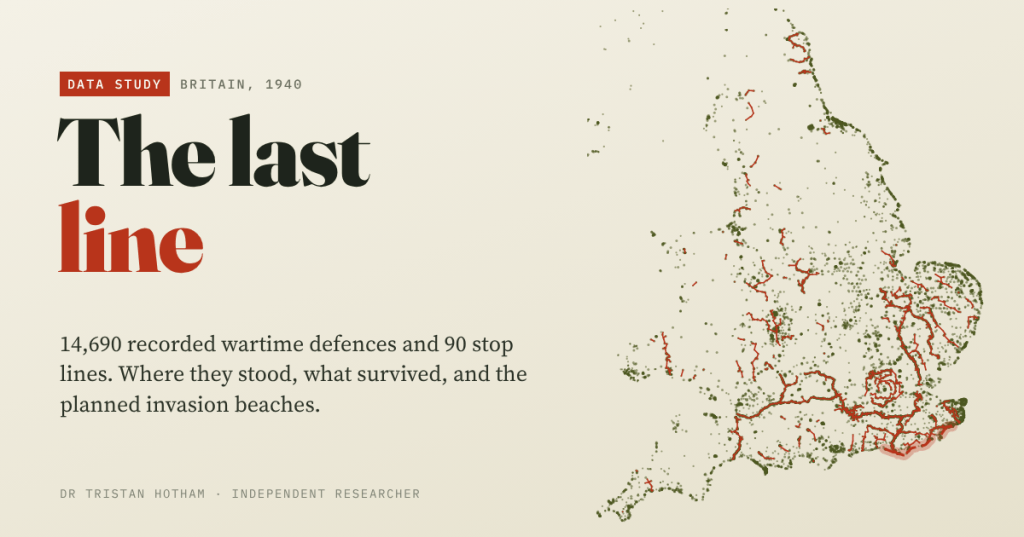
I mapped 14,690 wartime defences recorded by Defence of Britain volunteers. The planned German landing beaches had 2.3 times the average density of defence, and 71% of sites with a known condition were still standing.
-
Did Beeching Kill Your Town?
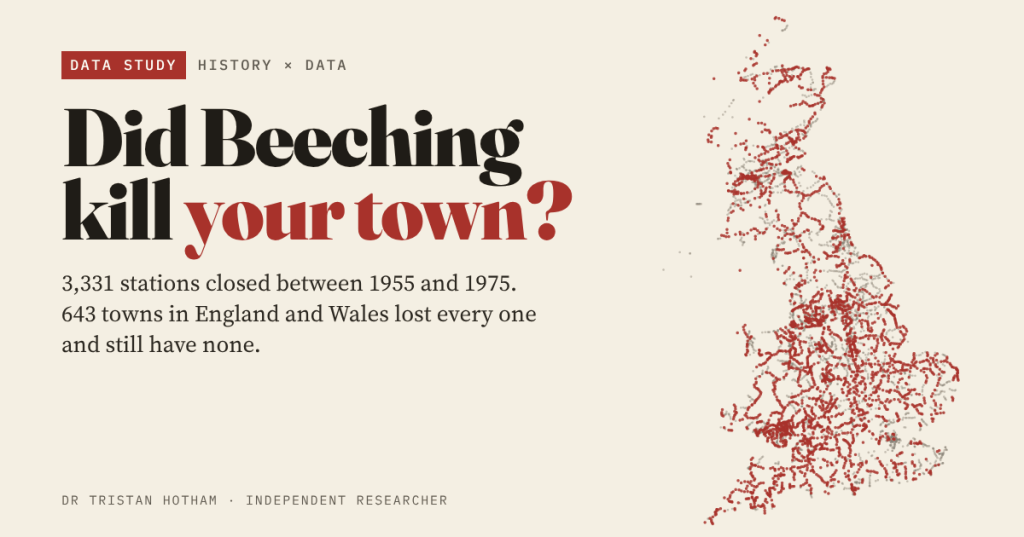
3,331 railway stations closed in Britain between 1955 and 1975, and 643 towns in England and Wales lost every one. Size for size, they are a little poorer and more car-bound today, but they did not fall off a cliff.
-
Barm, bap, cob or roll? Britain’s bread roll lines
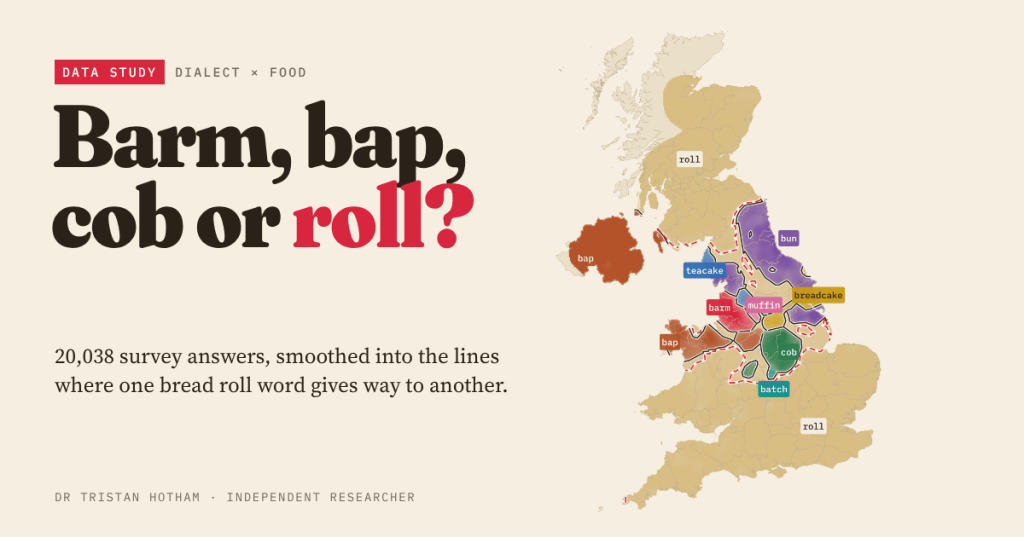
Roll, bun, bap, barm, cob, breadcake, teacake, muffin or batch? I mapped 20,038 answers from two dialect surveys, drew the lines where one word gives way to another, and checked whether the high street agrees.
-
Where the Devil lives: Britain’s Devil place names, mapped
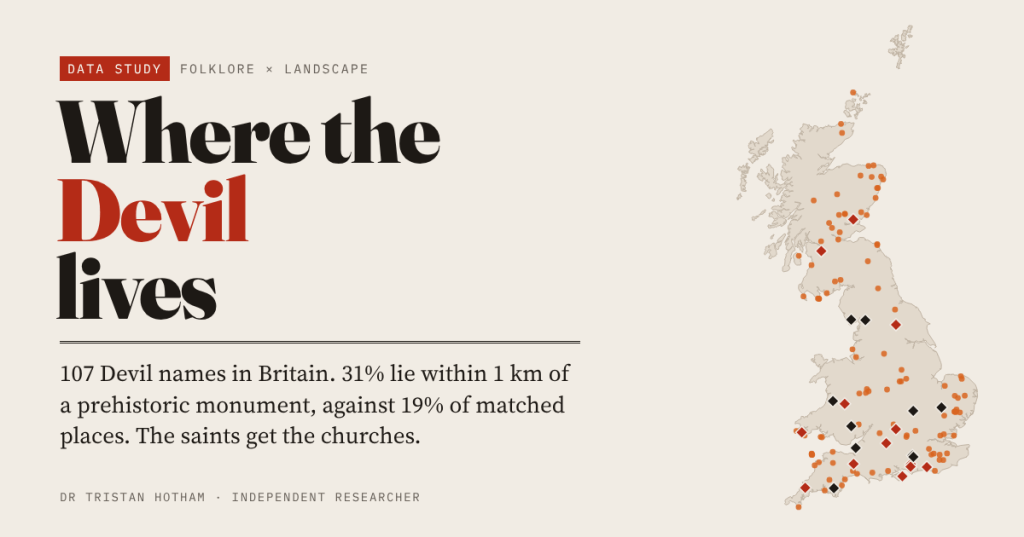
I mapped 107 Devil place names in Britain. 31% lie within 1 km of a prehistoric monument, against 19% of comparable places; saint-named places sit by churches and holy wells instead.

