
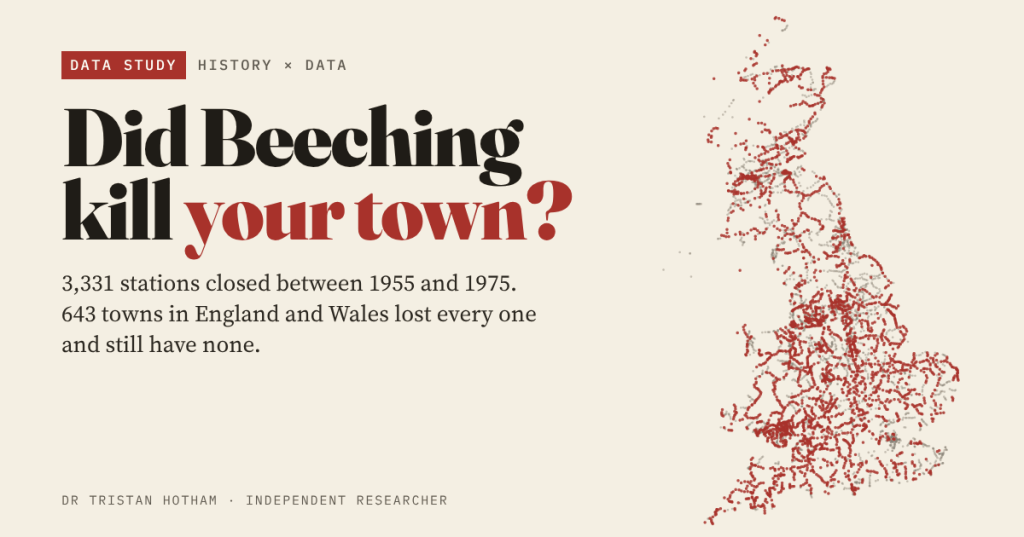
In the 1950s and 1960s Britain closed thousands of railway stations. Ask in almost any small town that lost its trains and you will hear that it never recovered. I mapped every closure in Wikipedia’s lists, found the towns that lost their railway for good, and compared them with similar towns that kept one.
On 27 March 1963 the British Railways Board published The Reshaping of British Railways, the report written under its chairman, Richard Beeching. It proposed closing 2,363 stations and about 5,000 miles of line. Plenty of closures came before it and some after, but his name has stuck to all of them, and so has a story: the trains went, and the town went downhill.
It is a hard story to test fairly. The closures were not random. The lines that went were the quiet ones, and quiet lines served small, rural places. So a town that lost its station might look different today simply because it was always a smaller, sleepier sort of place. I tried to get as close as open data allows.
Every closure, year by year
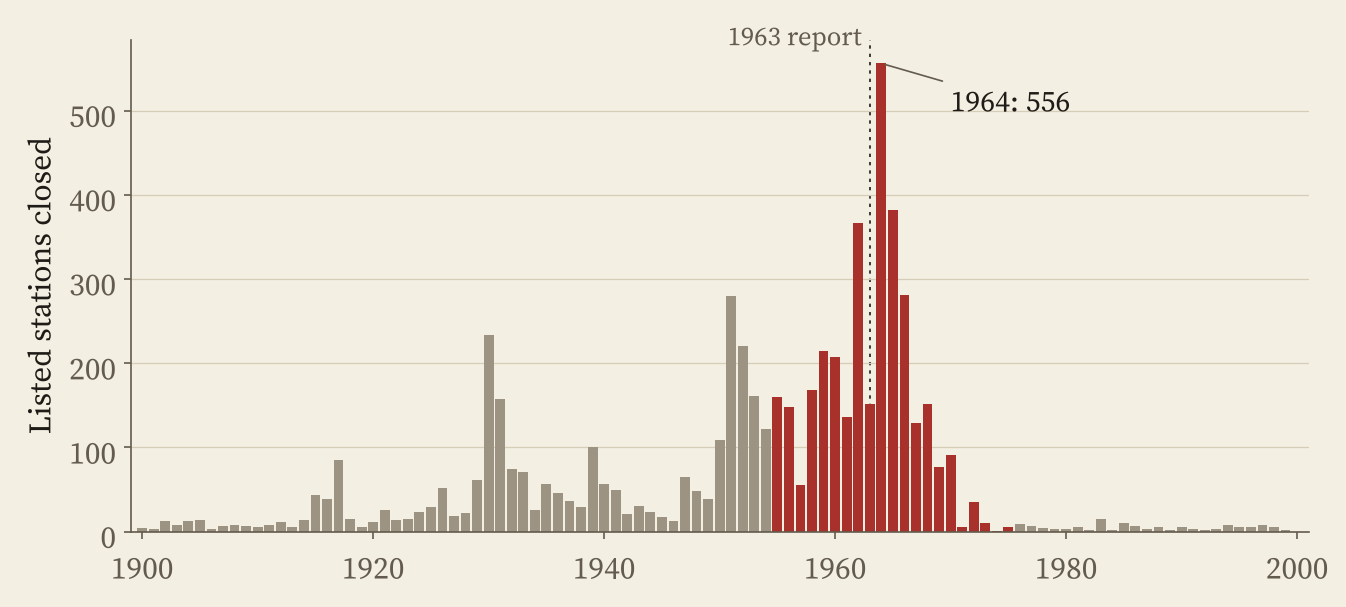
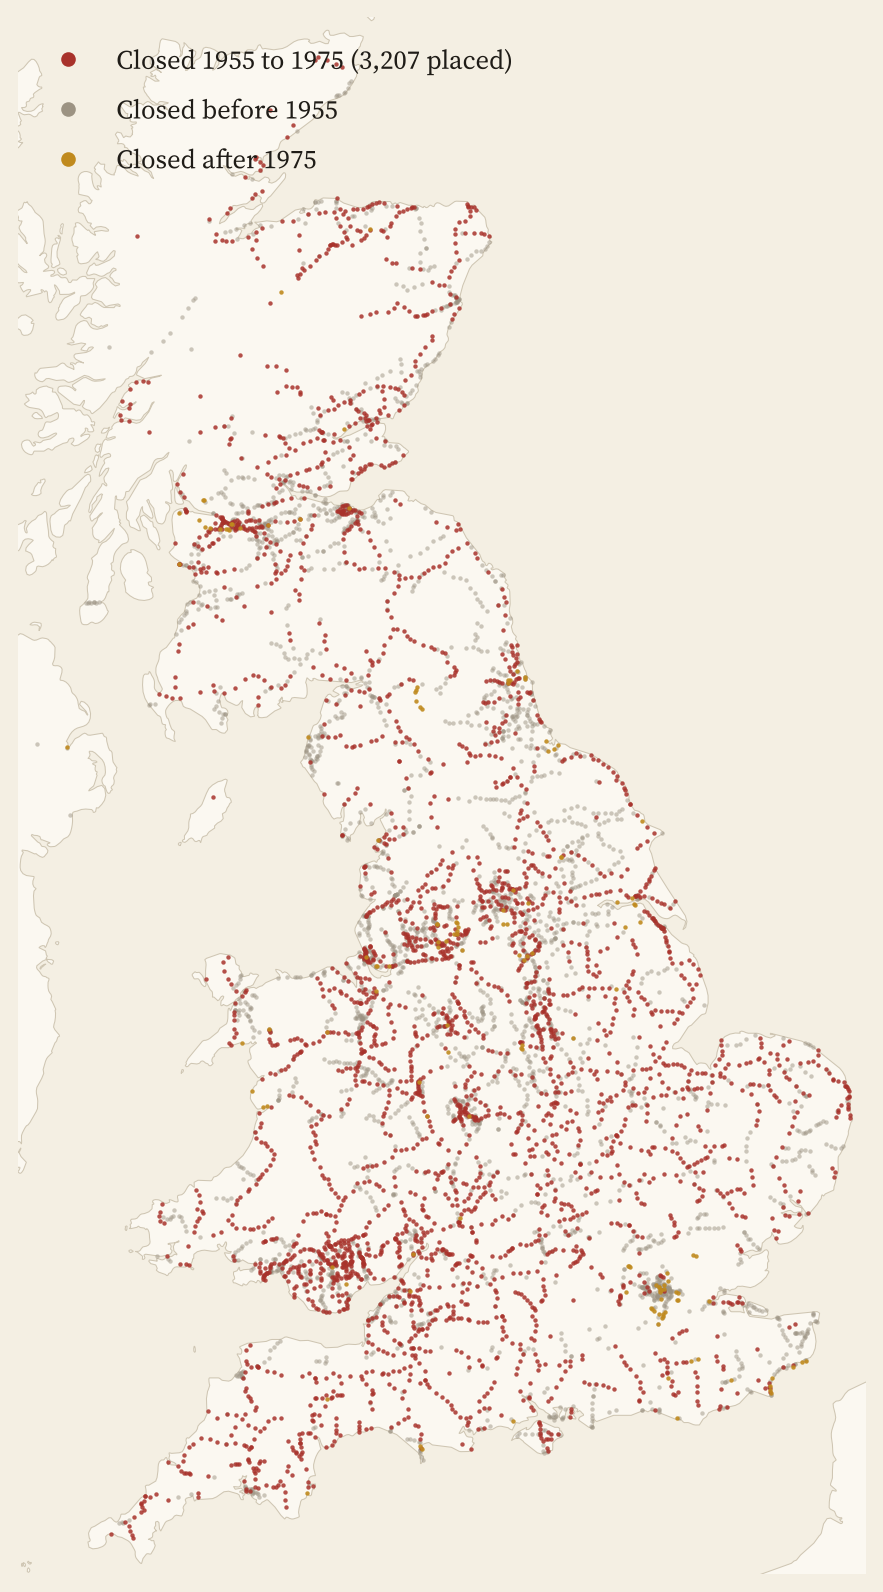
Wikipedia’s list of closed railway stations in Great Britain runs to 12 pages and 6,907 entries. I parsed every table and placed 93% of the stations on the map, mostly through Wikidata. Between 1955 and 1975, 3,331 of the listed stations closed. The worst year was 1964, the year after the report, with 556 closures. By the mid 1970s it was all but over.
Which towns lost their railway for good?
To turn stations into towns I used the ONS built-up areas, which cover every town and village in Britain, and counted a station as a town’s if it was within 2 km of the centre, or 1 km of the edge for bigger towns. Then I sorted the towns: those that lost every station between 1955 and 1975 and still have no National Rail station; those that lost them but have a station again; and those that kept one all along.
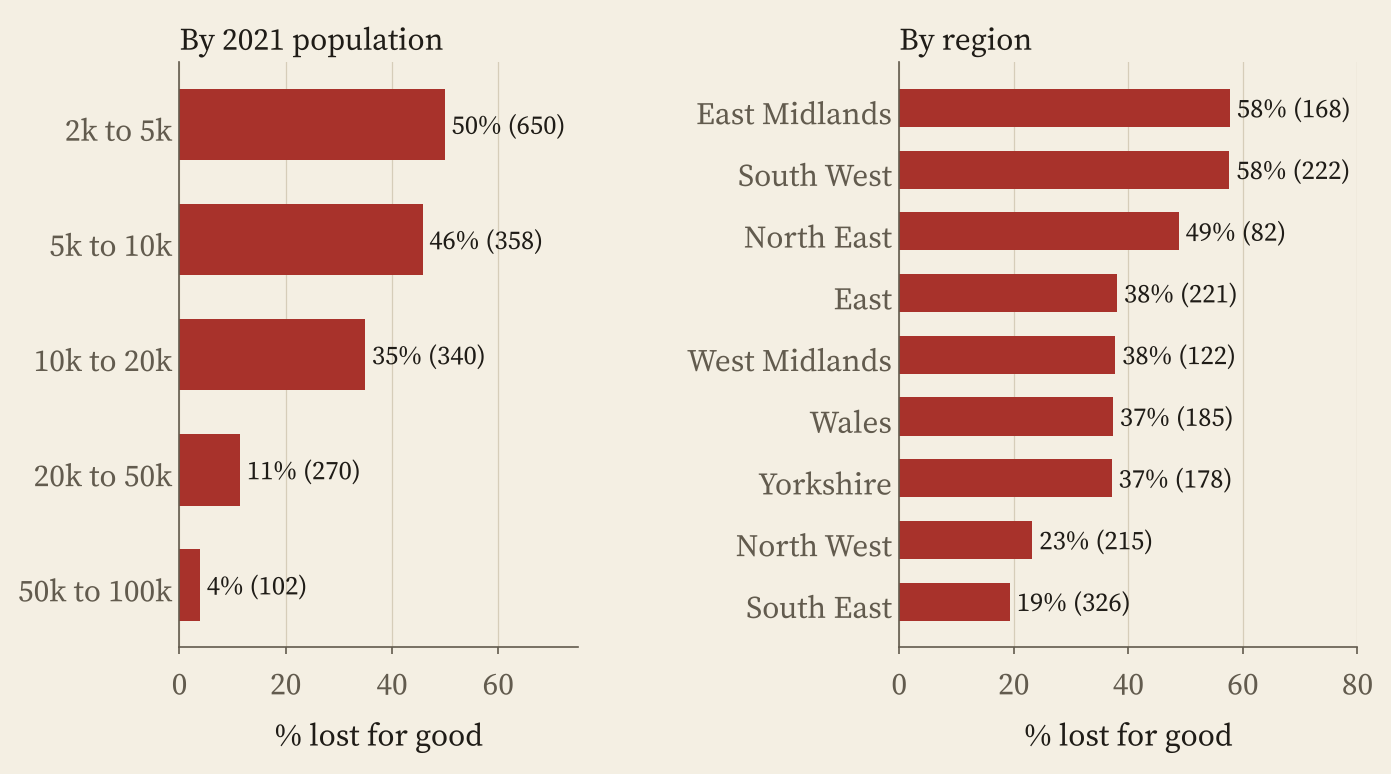
For the comparisons I kept to England and Wales, where Census 2021 figures are in my data, and to towns of 2,000 to 100,000 people. Of the 1,720 such towns that had a station in 1955, 643 (37%) lost it and have none today. 78 got their railway back, and 981 kept a station throughout.
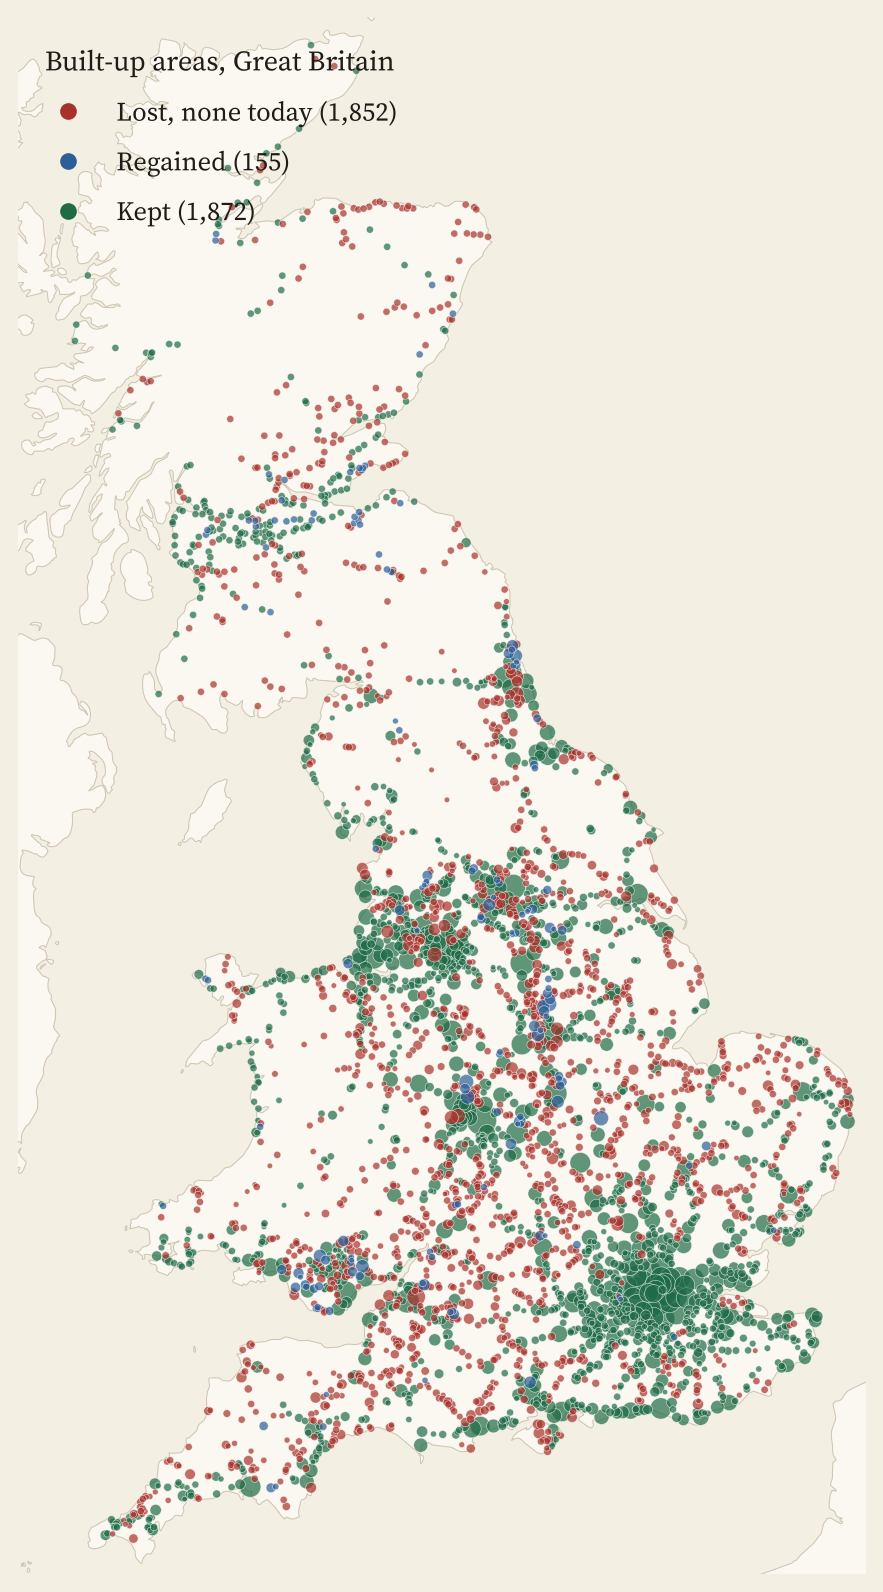
The pattern is the one you would expect from the way the closures were chosen. Half the station towns of 2,000 to 5,000 people (50%) lost their railway for good, against 4% of towns of 50,000 to 100,000. The East Midlands and the South West lost the most, the South East, with its commuter lines, the least.
Some big places are on the list. Washington, with 51,878 people, lost its last station in 1964; Leigh, with 43,532, in 1969. Skelmersdale, Dunstable, Witney and Haverhill have no station either. And some towns got theirs back: Mansfield, long said to be the largest town in Britain without a railway, on the Robin Hood Line in the 1990s; Corby in 2009; Kenilworth in 2018; Okehampton in 2021; Ashington in 2024; and Galashiels in Scotland on the Borders Railway in 2015.
So, how do those towns look today?
For each town I took the share of residents aged 65 or over, the share of households without a car, the share of adults in work, the share long-term sick, the share in managerial and professional jobs, and mean household income. Then I compared the towns that lost their railway with towns of the same size, in the same region, that kept one.
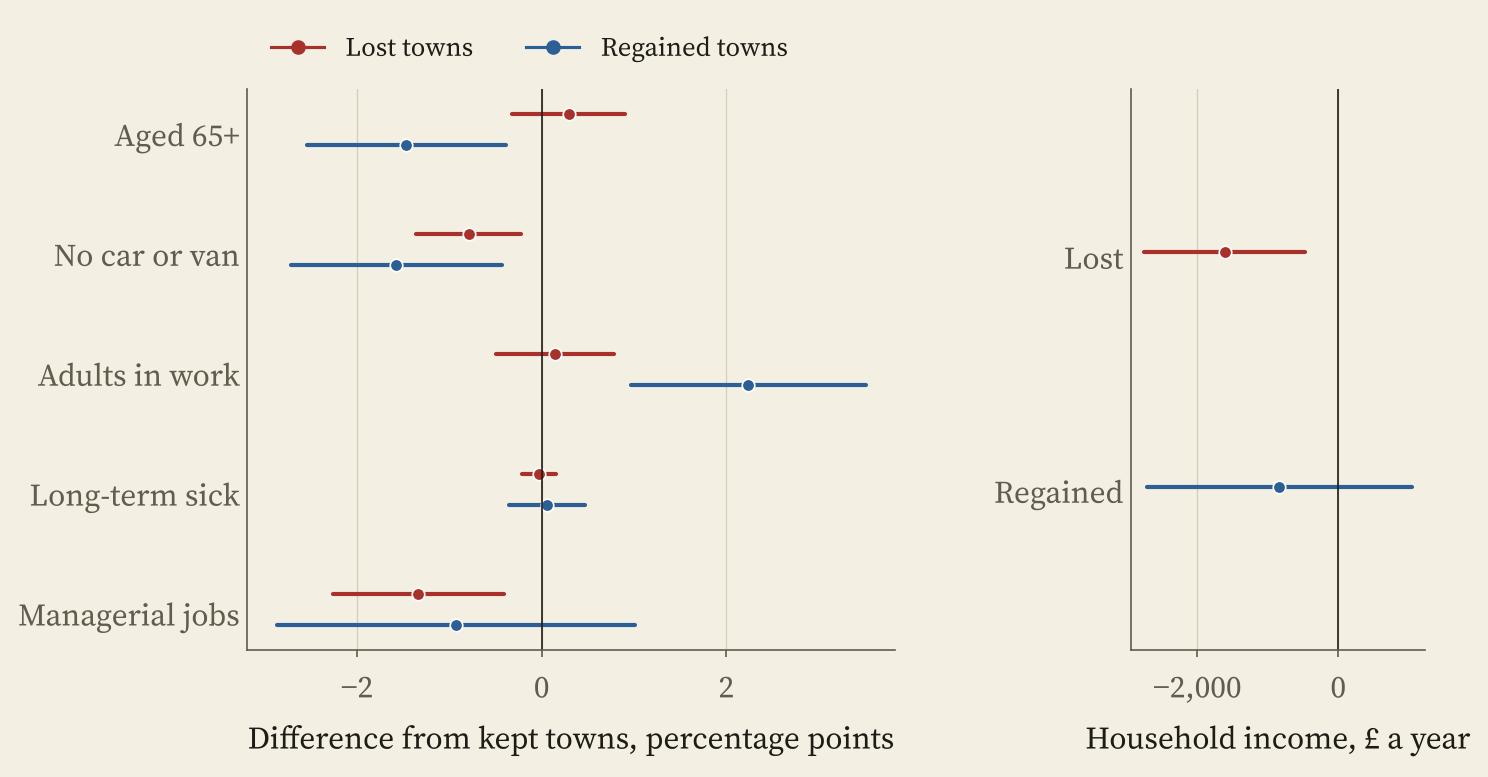
Size for size, the towns that lost their railway have about £1,613 a year lower household income, 3.1% of the typical kept town’s. They have 1.3 percentage points fewer adults in managerial and professional jobs, and 0.8 points fewer households without a car, because life there needs one. On age, work and long-term sickness I could find no clear difference at all.
Size for size, the towns that lost their trains are a little poorer and more car-bound than their neighbours with stations. They did not fall off a cliff.
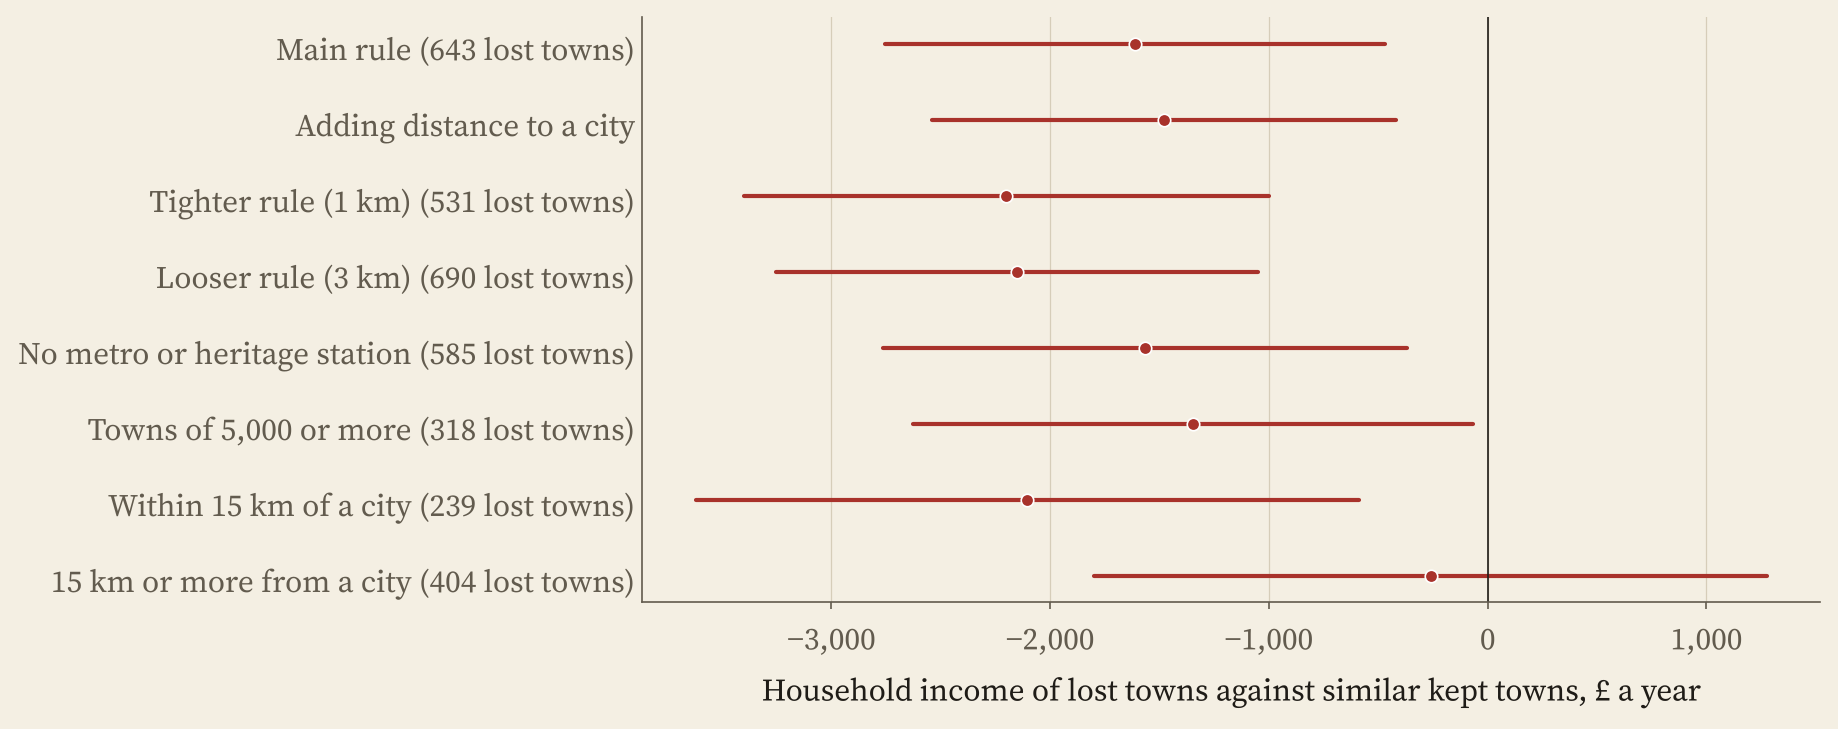
The income gap has a geography. Among lost towns within 15 km of a city of 100,000 or more, it is £2,105. Further out, it all but vanishes: £261, easily chance. Near a city, a station means a commute, and it would make sense for people with well-paid city jobs to pick towns with stations. If that is right, the railway today sorts who lives where more than it decides whether a town lives or dies.
There is a big caveat, and it is the part my comparison cannot see. Because I compare towns of the same size today, any people a town lost when its trains went are matched away. A careful study by Stephen Gibbons, Stephan Heblich and Edward Pinchbeck, published in the Journal of Urban Economics, follows populations from 1950 and finds exactly that: places that lost more rail access lost population, jobs, skilled workers and young people relative to others. So did Beeching kill your town? Probably not. But he may well have made it smaller.
How I did this
I parsed Wikipedia’s closed station lists (A to Z) and placed stations through their Wikidata entries, then OpenStreetMap, then OS Open Names; 473 could not be placed, and I did not parse Wikipedia’s separate lists for London, Greater Manchester, Merseyside, the West Midlands, Lancashire and Norfolk. Stations open today are the 2,609 National Rail stations; trams, metros and heritage lines do not count. I worked out which of today’s stations were shut in 1975 by matching names, places and Wikidata dates, which will have made some mistakes. Towns are ONS built-up areas; the outcomes come from Census 2021 and the ONS income estimates for 2022 to 2023, compared with regressions that allow for size and region. Everything here is association, not cause. The paper sets out every step and check.
Notes and sources
- Closed stations: Wikipedia, List of closed railway stations in Great Britain (CC BY-SA 4.0), retrieved 28 October 2026; the report’s figures from Wikipedia, Beeching cuts; reopenings from List of Beeching cuts service reopenings.
- Station coordinates and dates: Wikidata (CC0) and OpenStreetMap contributors (ODbL).
- Stations today: uk-railway-stations by David Wheatley, from Trainline EU’s stations data (ODbL).
- Towns and outcomes: Office for National Statistics, Census 2021 and income estimates for small areas, financial year ending 2023 (Open Government Licence v3.0); built-up areas and lookups from the ONS Open Geography Portal; OS Open Names. Contains OS data © Crown copyright and database right 2026.
- Gibbons, S., Heblich, S. and Pinchbeck, E. W. (2024). The spatial impacts of a massive rail disinvestment program: the Beeching axe. Journal of Urban Economics, 143, 103691. doi.org/10.1016/j.jue.2024.103691
- Paper, data and code: Zenodo and GitHub.
- I wrote the text, with drafting and editing assistance from Claude (Anthropic), which also helped prepare the analysis code. I reviewed and checked all text and results.

