
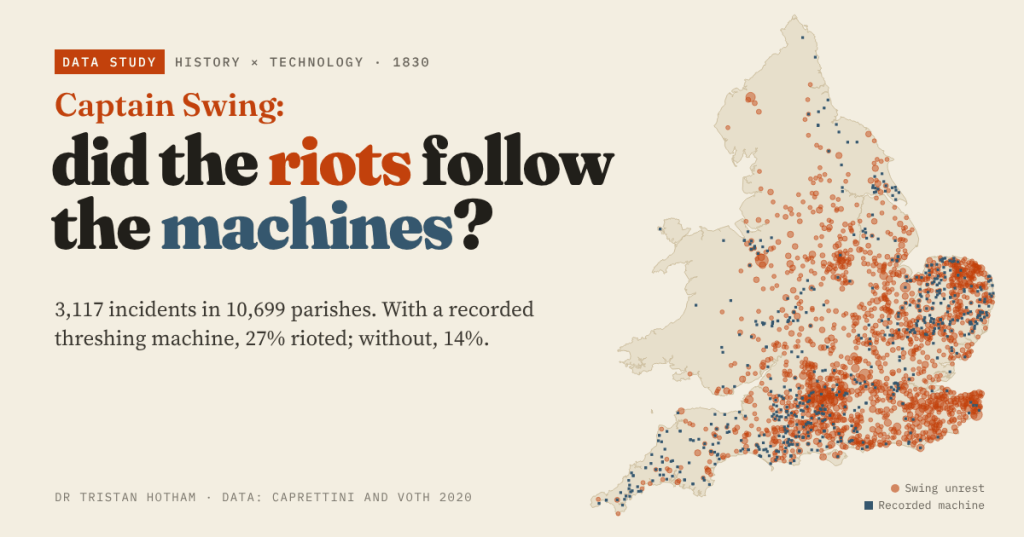
In the autumn of 1830 farm labourers across southern and eastern England smashed threshing machines, burned ricks and signed their threats “Captain Swing”. It was the first great revolt against a labour-saving machine. But was it really about the machines? Two economists put every riot and every recorded machine on the map and shared their data openly, so I took a look.
On the night of 28 August 1830, labourers at Lower Hardres, Kent broke a threshing machine. Within weeks the trouble had spread from Kent through Sussex, Hampshire, Berkshire and Wiltshire and up into East Anglia. Machines were smashed, ricks and barns burned, overseers of the poor run out of their parishes, and farmers, magistrates and parsons received letters signed by a man who never existed. The state struck back hard: about 2,000 people were tried, 19 hanged and 481 transported to Australia.
Ever since, historians have argued about what it was really about. The threshing machine took away the winter work of beating corn with a flail, which by the eighteenth century took about a quarter of all farm labour. But the labourers of 1830 also had low wages, a harsh poor law, tithes to pay and, in many places, commons that had been fenced off. Was the machine the cause, or just the most visible target?
In 2020 the economists Bruno Caprettini and Hans-Joachim Voth published a careful study, “Rage against the Machines”, and released all of their data under an open licence. They placed 3,117 Swing incidents and 641 recorded threshing machines onto the 10,699 parishes of England and Wales. Their headline, using a clever trick with soil types, is that the machines did cause more rioting. I have not tried to redo their causal work. Instead I checked that I could reproduce their numbers (I can, exactly), and then used their data to draw the riots, the machines and the rival suspects side by side. Everything below that is not credited to them is my own descriptive work on their data.
The fire map
Swing was above all a southern and eastern rising. Five counties, Kent, Norfolk, Wiltshire, Hampshire and Sussex, hold 48% of the incidents in the main sample. It reached further than its reputation, though: the single parish with most incidents in the data is Whitchurch in Shropshire, with 26. Wales was almost untouched.
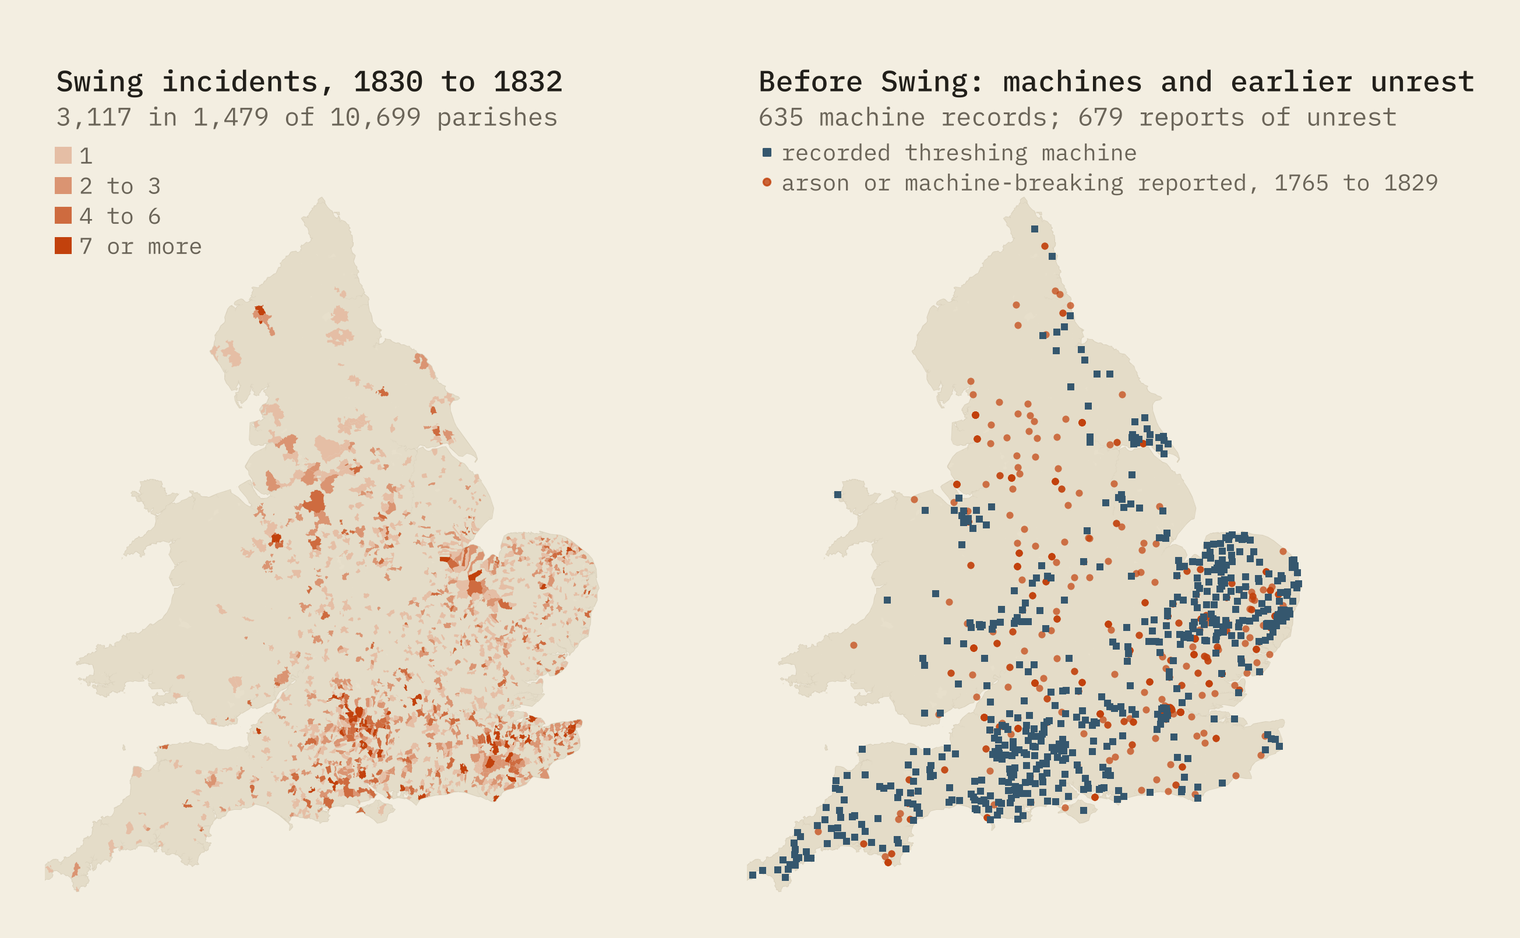
Look at the two maps together and the problem is already clear. The machines and the fires overlap, but not neatly. Kent, where Swing began with a wave of machine-breaking, has only 6 recorded machines in 357 parishes. That is a warning about the data as much as about history: these are the machines that happened to be advertised in the newspapers or described in county farming surveys, not every machine that existed.
It did not come from nowhere
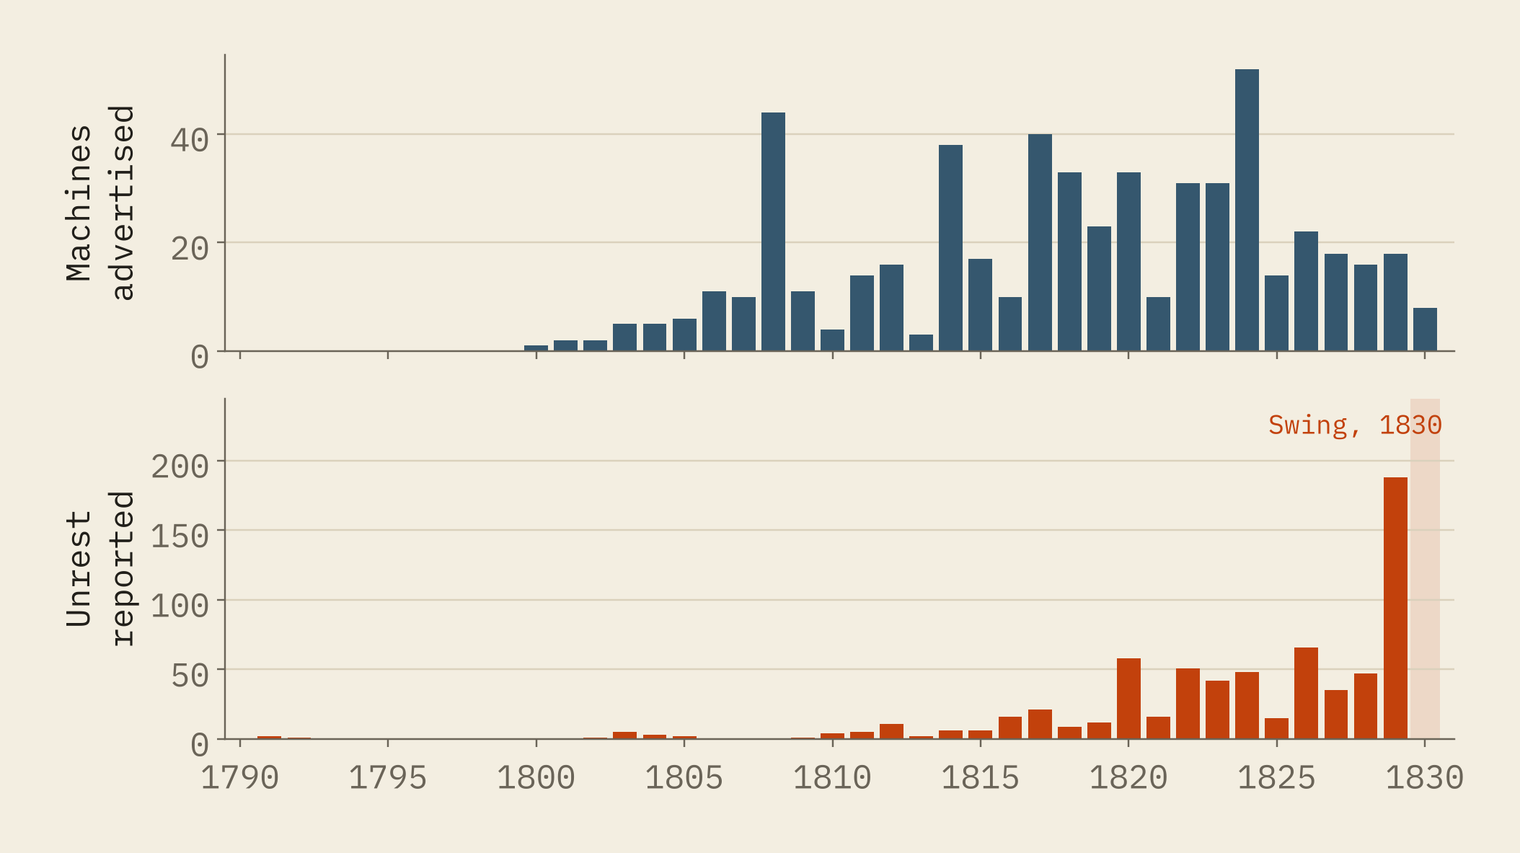
Machines had been spreading for thirty years: 128 records in the 1800s, 262 in the 1810s and 245 in the 1820s. And the countryside was already smouldering. Caprettini and Voth also searched the newspapers for earlier arson and machine-breaking, and 83% of what they found falls in the 1820s, with 188 reports in 1829 alone.
Did the riots follow the machines?
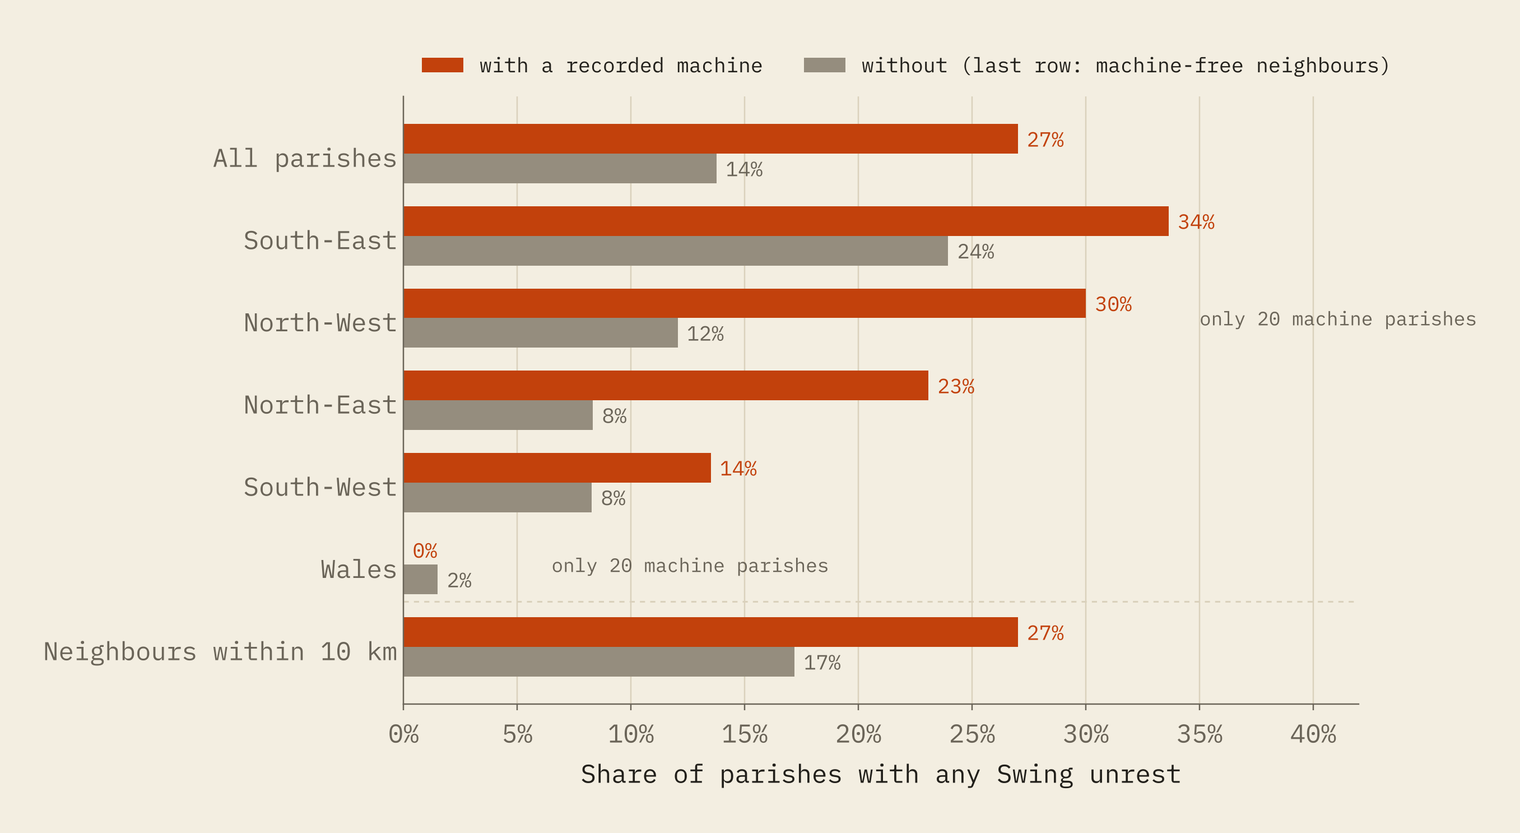
Yes, in a clear and consistent way. In parishes with a recorded machine, 27% saw some Swing unrest. In parishes without one, 14%. That is about twice the rate, and it holds in four of the five regions of England and Wales. The fairest test I could think of was to compare each machine parish with its own machine-free neighbours within 10 km, which takes out most of the geography. The gap shrinks but stays: 27% against 17%.
Interestingly, it was not only machine-breaking that was more common in machine parishes. Fires, threatening letters and wage riots were about twice as common too. The machine seems to have sharpened a wider anger rather than simply attracting hammers.
The machine was a spark. The countryside was already dry.
But turn it round. Of all the parishes that saw unrest, 90% had no recorded machine at all, and 73% of the machine parishes stayed quiet. Machine-breaking was only 17% of all incidents.
The other suspects
So I lined up the rival explanations in the data. For each, I split the parishes into five equal groups, from lowest to highest, and asked how often each group rioted. A steep line means a strong link; a flat one means none.
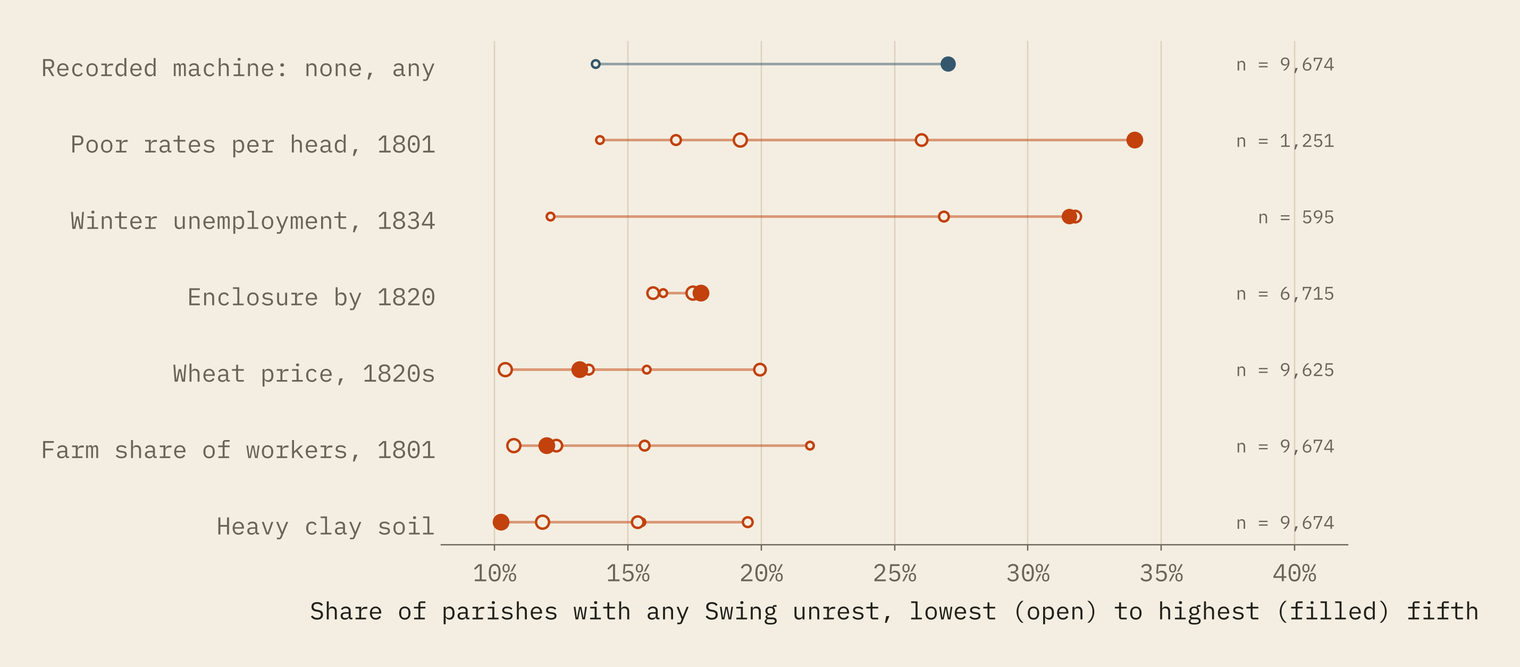
Enclosure, the fencing of common land, is the great non-event: unrest runs from 16% in the least enclosed fifth to 18% in the most. That fits the old observation that the heavily enclosed Midlands stayed quiet in 1830. Hunger, measured by wheat prices at the nearest market, shows no pattern either.
The poor law is a different story. Among the 1,251 parishes with figures, those that spent least on poor relief per head in 1801 rioted in 14% of cases, those that spent most in 34%. In the south, relief often topped up wages that were too low to live on, so heavy rates are a rough sign of very low pay. Winter unemployment, reported in 1834, rises in the same way. These figures cover only the parishes that answered a later government inquiry, and the unemployment was measured after the riots, so treat them as clues rather than proof.
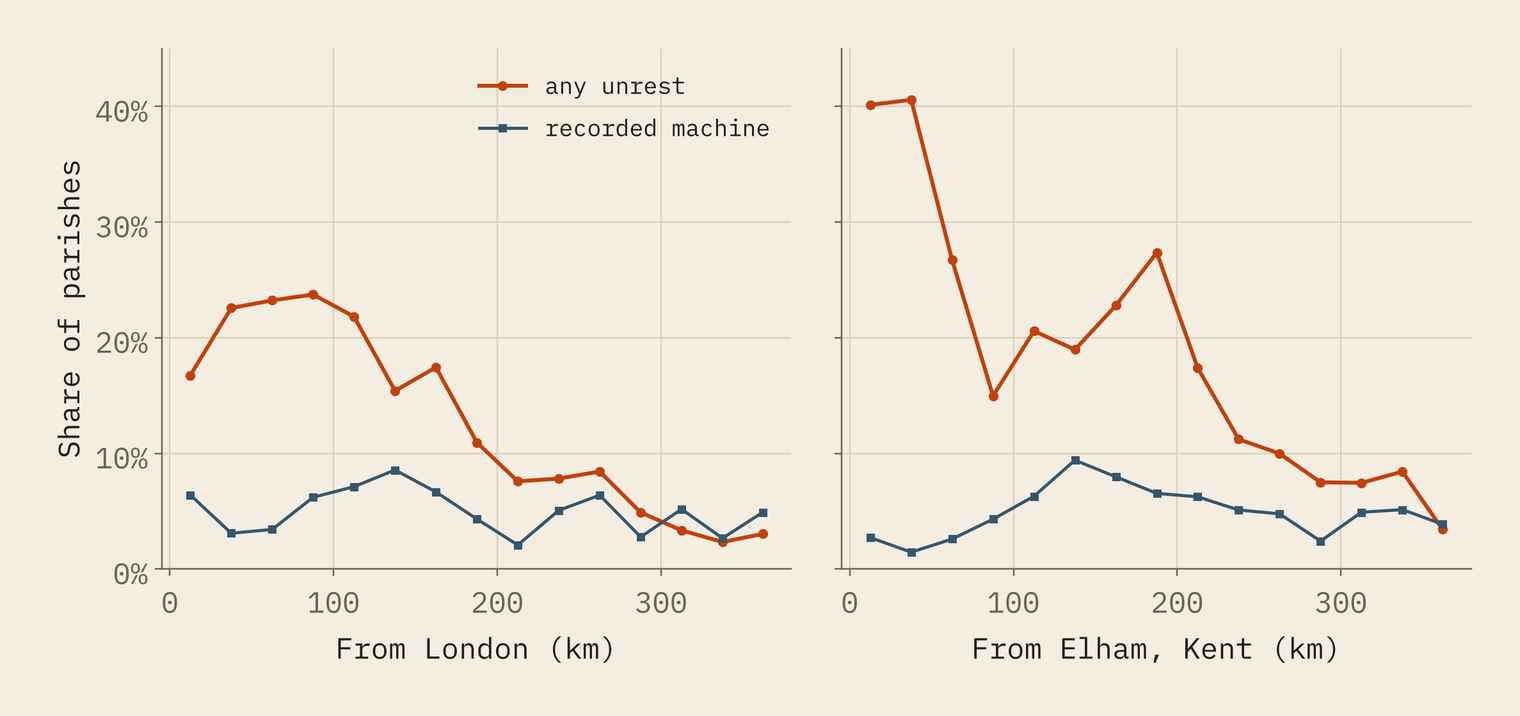
Geography matters too. Swing was a rising of London’s farming hinterland: 23% of parishes within 100 km of the capital saw unrest, against 6% beyond 200 km.
Robots took our jobs? A short aside
It is hard to read about Swing without thinking about today’s arguments over machines and jobs. So here, clearly labelled as a detour, is what 1830 can and cannot tell us. Everything in this section is about 1830.
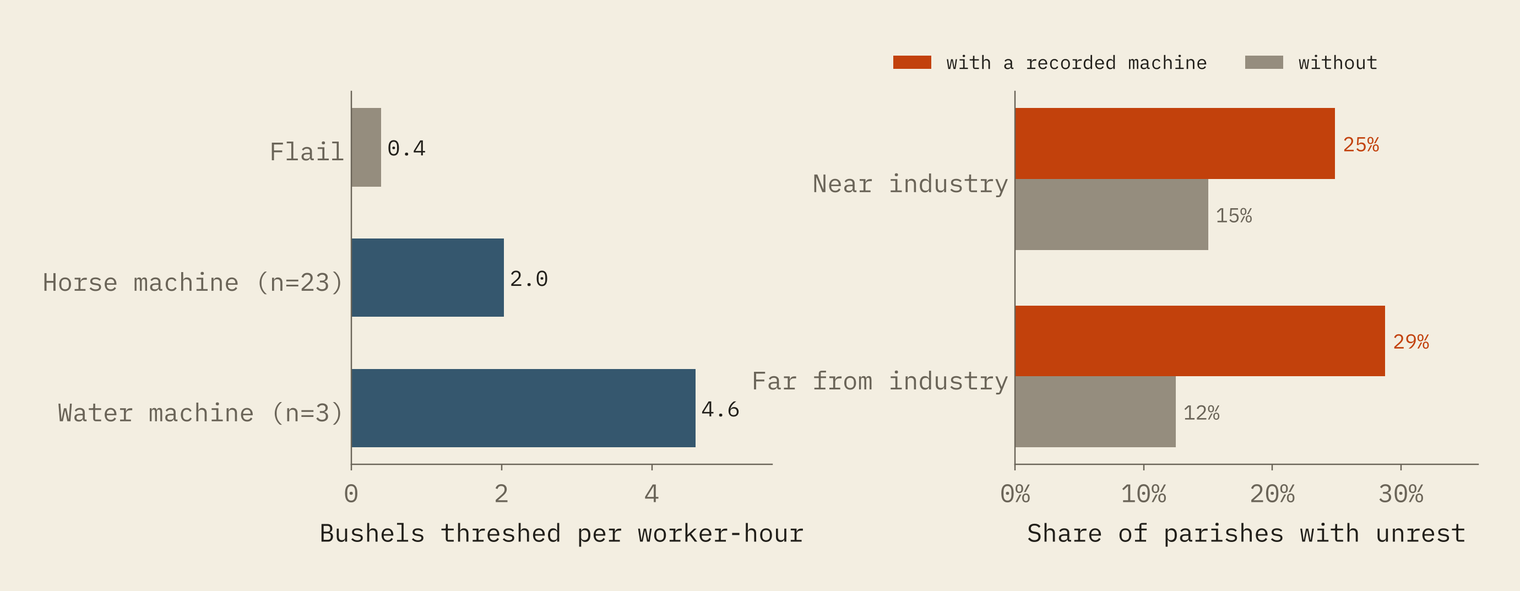
The machine really was a big leap. Using figures from the county farming surveys and Caprettini and Voth’s benchmark for the flail, a horse-powered thresher did about 2.0 bushels per worker-hour against the flail’s 0.4, roughly 5 times as much. People did respond where it arrived. And the response was sharpest where there was nowhere else to go: far from the industrial towns, machine parishes rioted 16.3 points more often than parishes without; close to them, 9.9 points.
What it cannot tell us is just as important. A horse-driven thresher is not software, and a parish in 1830, with no welfare state, no vote for labourers and no other employer for miles, is not a modern labour market. These data stop in 1832, so they say nothing about whether the machine made rural England richer or poorer in the long run. And the rioters’ own letters asked for higher wages as well as an end to machines, so we cannot cleanly separate anger at the machine from anger at who kept its gains. The modest lesson is about context: how a labour-saving machine lands depends on what else people have to fall back on.
How I did this
All the data come from Caprettini and Voth’s replication package on openICPSR (CC BY 4.0), which in turn draws on the Swing Unmasked project for the riots, newspaper adverts and county surveys for the machines, the 1834 Poor Law Report, an early twentieth-century study of enclosure, and the 1801 census. Before doing anything of my own I re-ran their published summary statistics and main coefficients and matched every one to the third decimal place. Then I mapped the 1851 parishes, compared machine and machine-free parishes overall, by region and against neighbours within 10 km, and split each rival measure into fifths. None of my comparisons is causal; for that, see their paper.
Two caveats matter most. The machine records are a sample, so “no recorded machine” does not mean “no machine”. And the riots in this package carry no dates, so I cannot show the week-by-week spread of the autumn of 1830; the interactive map instead lets you watch the recorded machines arrive year by year from 1800, with earlier reports of fires flickering on, and find your own parish.
Notes and sources
- Data: Caprettini, B. and Voth, H.-J. 2020, Rage against the Machines: Labor-Saving Technology and Unrest in Industrializing England, American Economic Review: Insights 2 (3), 305 to 320; replication data at openICPSR (CC BY 4.0). Their causal results are theirs; the maps and comparisons here are mine.
- Riot counts: Holland, M. (ed.) 2005, Swing Unmasked: The Agricultural Riots of 1830 to 1832 and their Wider Implications, FACHRS Publications, via Caprettini and Voth.
- Dates, sentences and the share of farm labour spent threshing: Wikipedia, Swing Riots and Threshing machine (CC BY-SA 4.0).
- Background: Hobsbawm, E. J. and Rudé, G. 1969, Captain Swing, Lawrence and Wishart.
- Paper, data and code: Zenodo and GitHub.
- I wrote the text, with drafting and editing assistance from Claude (Anthropic), which also helped prepare the analysis code. I reviewed and checked all text and results.

