
Tag: data visualisation
-
Great Fires: Did the Towns That Burned Rebuild Bigger?
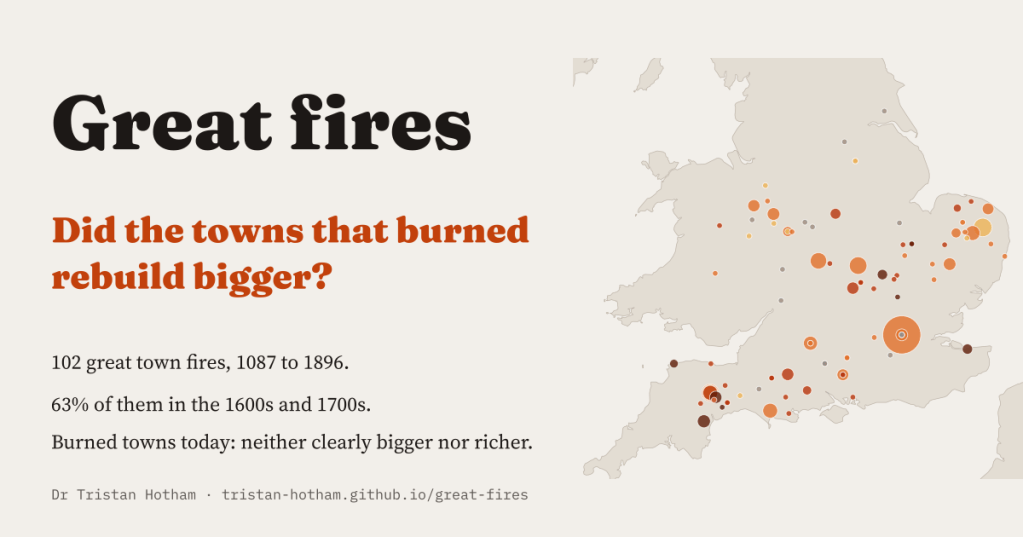
I read every fire in Wikipedia’s town articles and found 102 great town fires, 63% of them in the 1600s and 1700s. Three centuries on, the towns that burned are neither clearly bigger nor richer.
-
Rotten Boroughs: Where Are They Now?
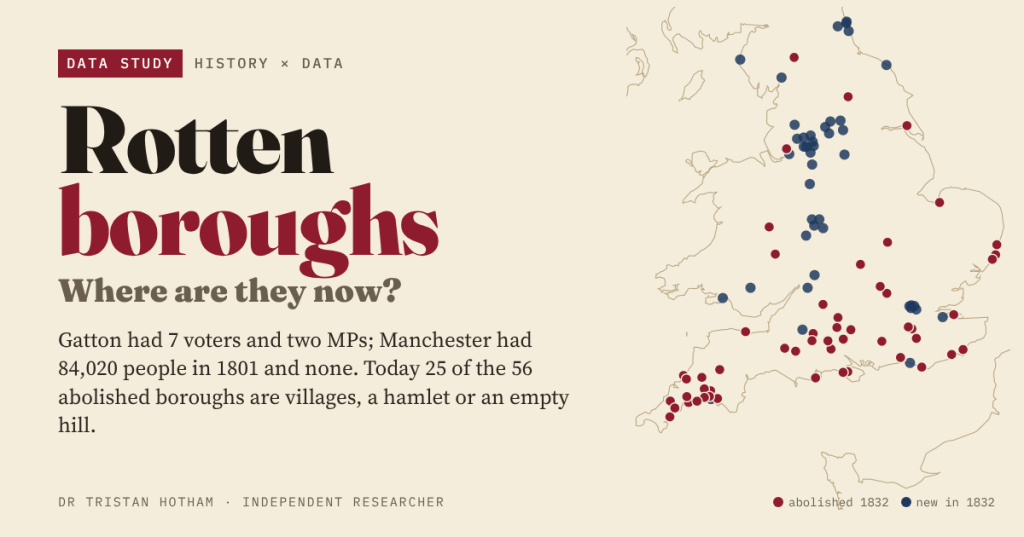
Before 1832 Gatton had 7 voters and two MPs while Manchester had none. I mapped all 56 boroughs the Reform Act abolished: today 25 are villages, a hamlet or an empty hill.
-
Canal Mania: Did the Canal Towns Boom, and Do They Still Lead?
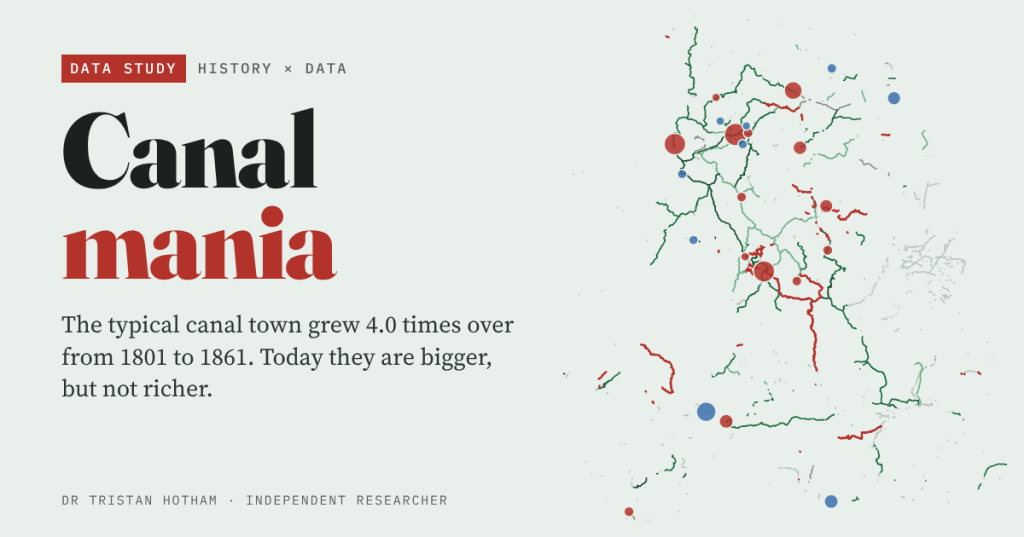
England’s canal towns grew about 4.0 times over between 1801 and 1861. But they were rising before the canals came, and today they are bigger, not richer.
-
Here be dragons: do Britain’s dragons live by the church?
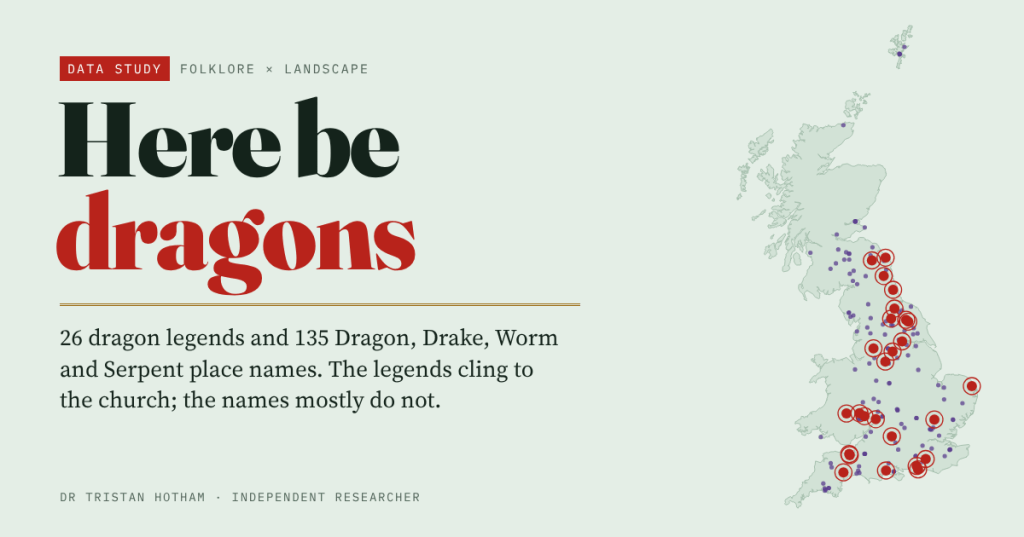
I put 26 named dragon legends and 135 Dragon, Drake, Worm and Serpent place names on the map. The legends cling to the parish church (77% within 1 km, against 55% of comparable places); barrows, hillforts and rivers barely matter.
-
Cholera 1849: low ground, bad water and a long shadow
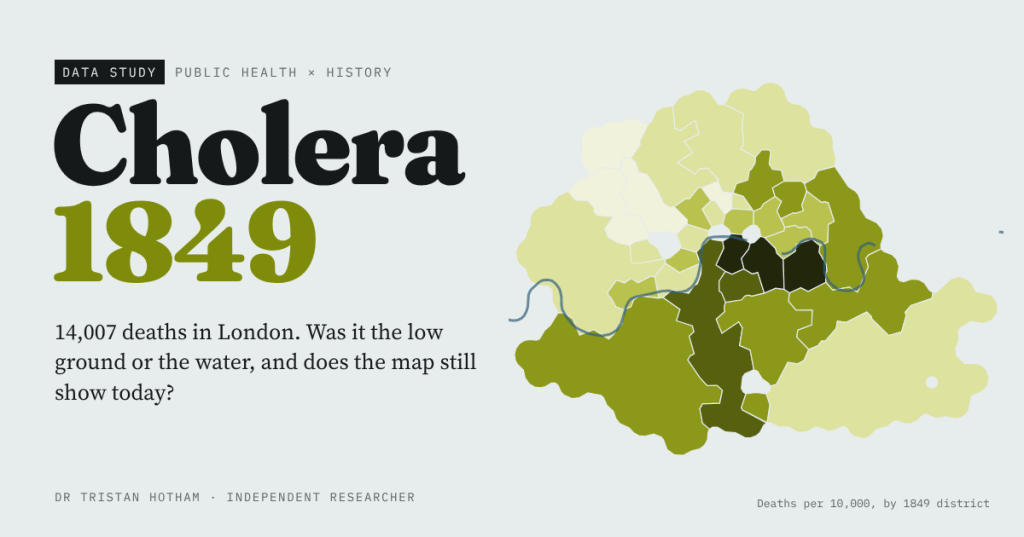
In 1849 cholera killed 14,007 people in London. I rebuilt William Farr’s elevation law and John Snow’s water evidence from their own tables, mapped every death around the Broad Street pump, and found that the worst-hit districts of 1849 are not the poorest today.

