
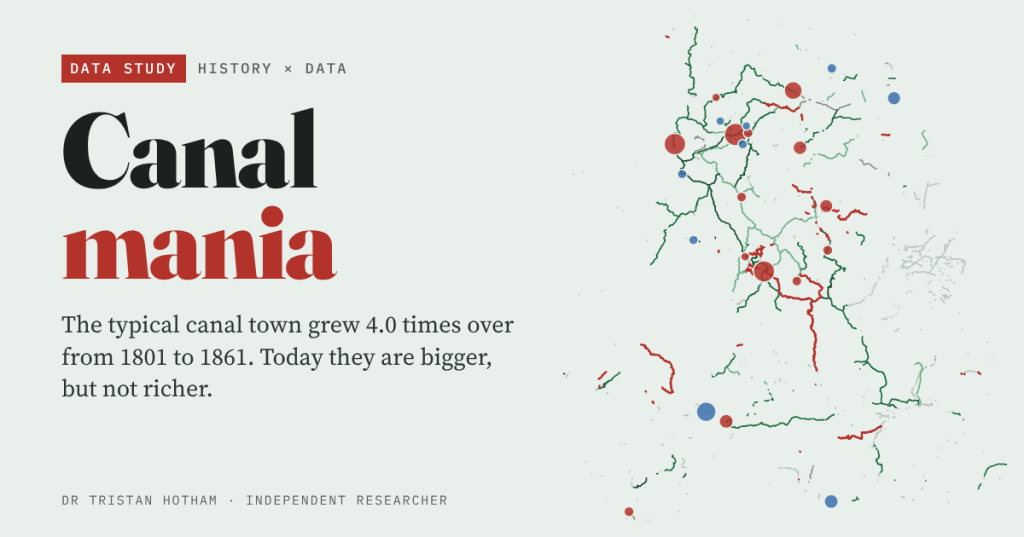
Between 1760 and 1830 England dug a network of canals. The towns they reached boomed. But were the canals the cause, and is there anything left of that lead today? I dated the network and followed England’s biggest towns from 1801 to 2021 to find out.
Like most people in Lancashire, I tend to think of the Leeds and Liverpool Canal as a towpath for a Sunday walk. Two centuries ago it was the motorway of the mill towns. Blackburn, Burnley and Wigan grew up along it. So did a story: the canals made the industrial North.
It is a good story, and it is hard to test. Canal companies needed traffic, so they dug towards coalfields, ports and busy manufacturing towns. A town on a canal might have grown because of the canal. Or the canal might have come because the town was already growing. I tried to pull those apart with open data, and the answer is more interesting than the legend.
A network dug in seventy years
I took 3,884 km of canal from OpenStreetMap and matched it, name by name, to Wikipedia’s list of UK canals and their opening years. That dated 77% of it by length. The result is a picture of a building boom: 84% of the dated length belongs to canals finished between 1760 and 1830, and the busiest decade was the 1790s, the years remembered as canal mania, with 586 km finished and 44 canals completed.
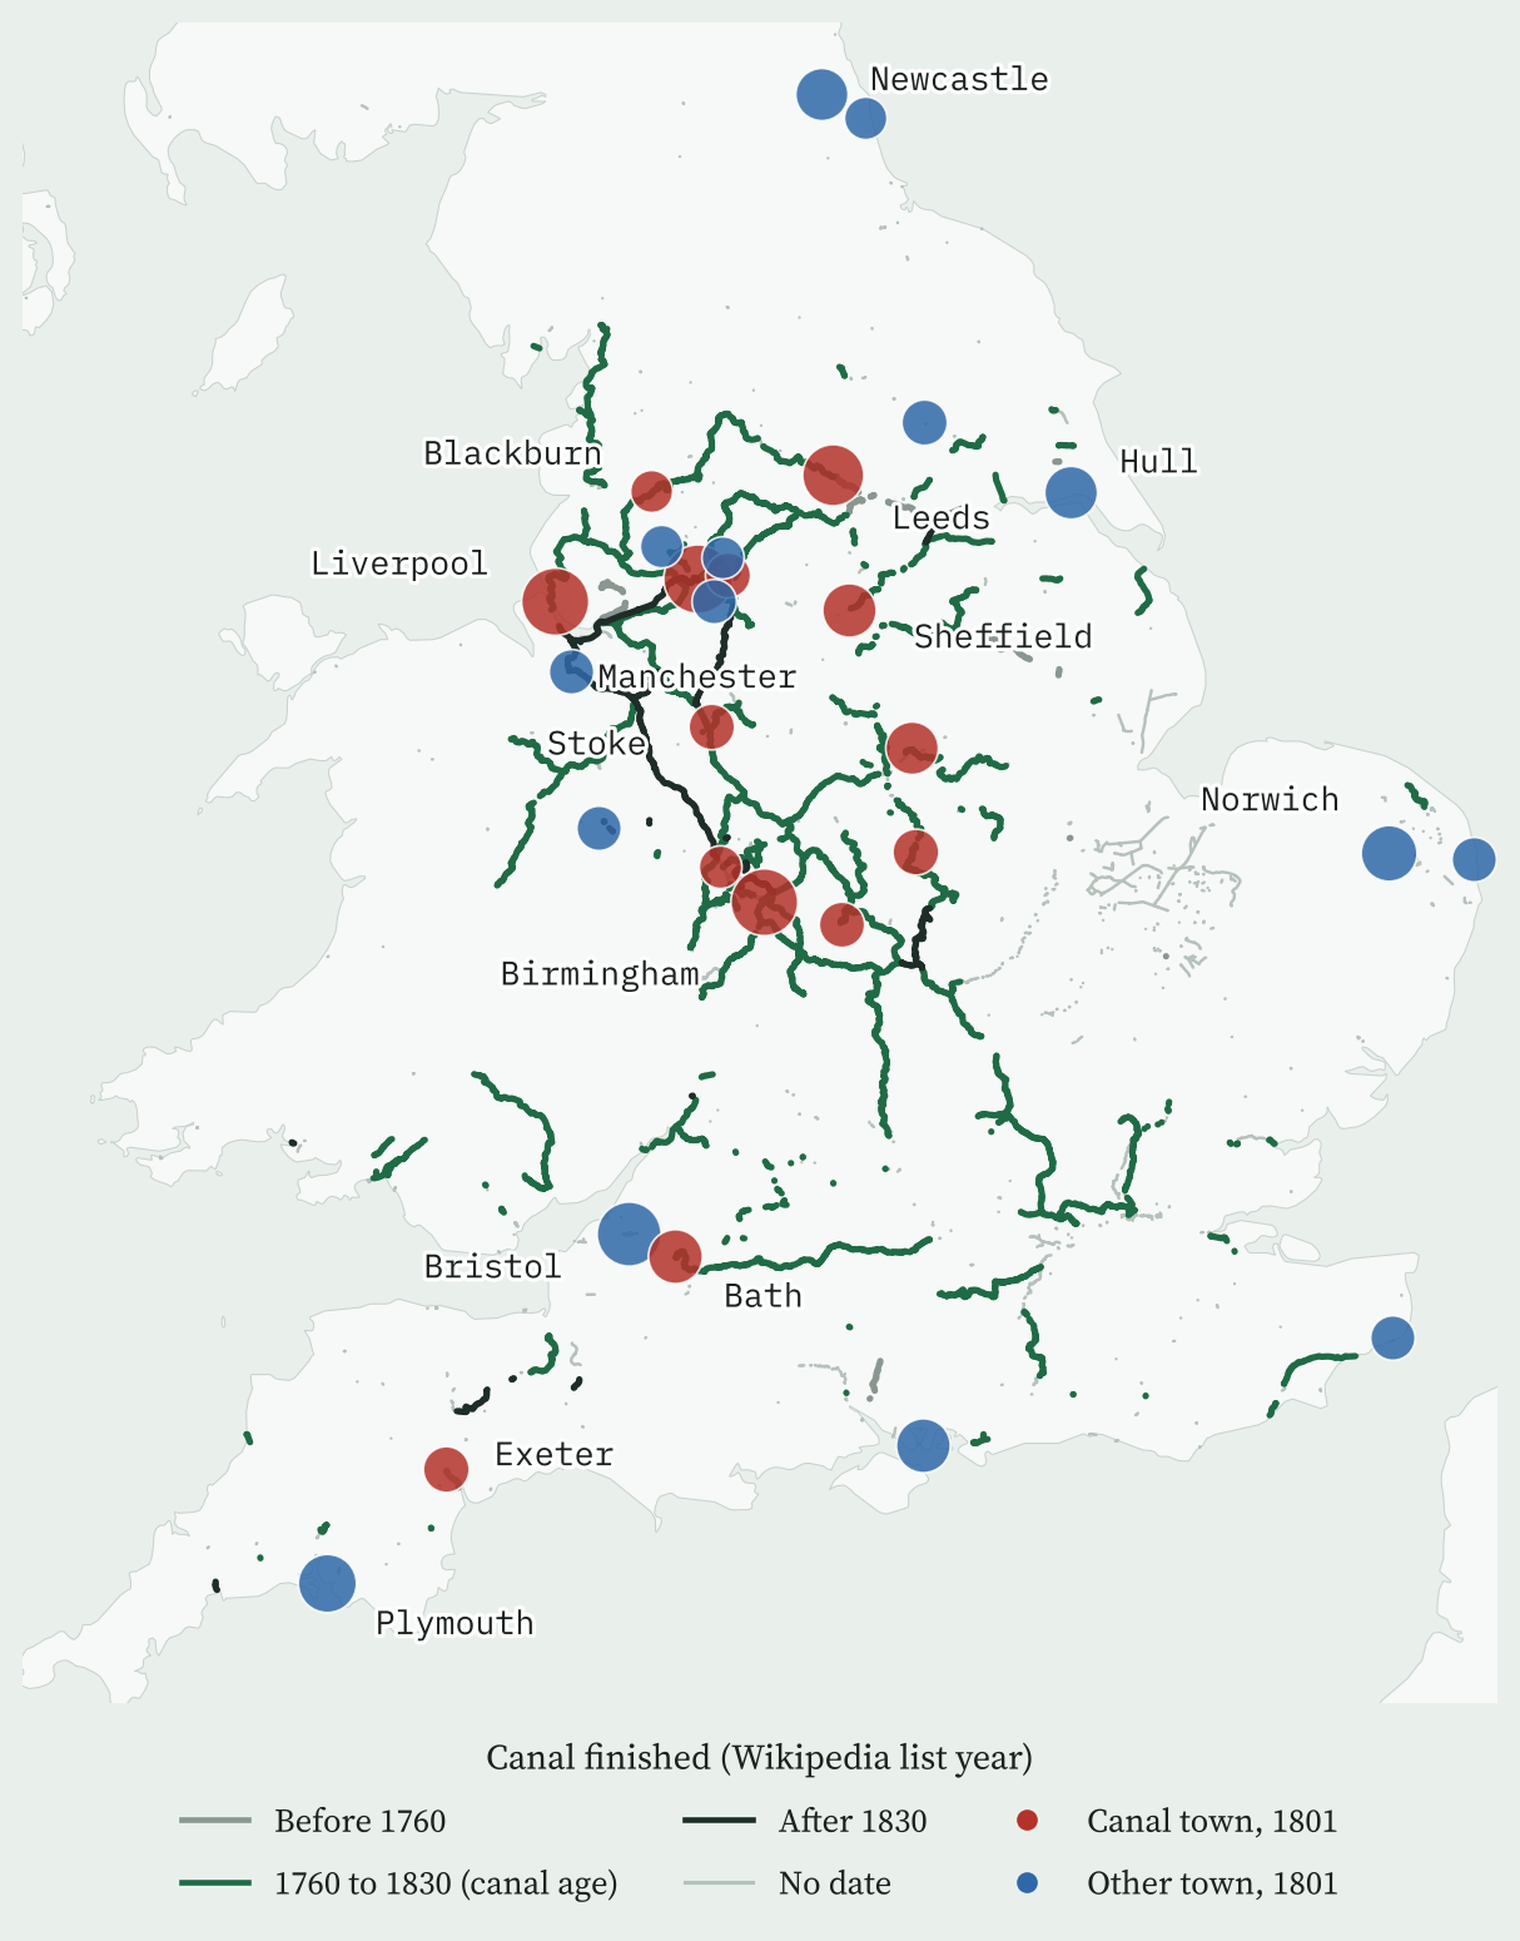
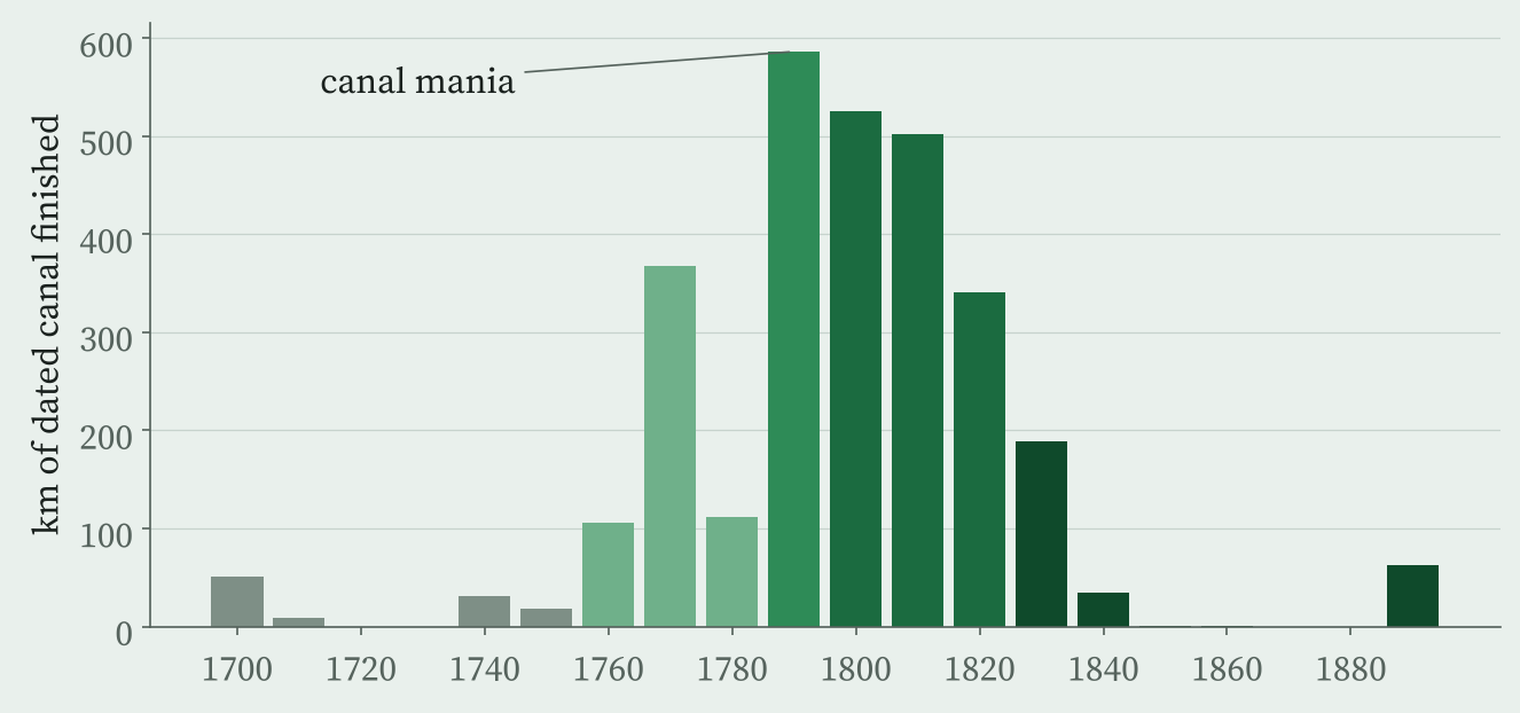
The interactive version animates this decade by decade, with the canals turning red in the year they open. One warning: the list gives one year per canal, normally the year the whole line was finished, so long canals like the Leeds and Liverpool (dated 1816) appear later than their first stretches did.
The canal towns did boom
To compare like with like I started from the 29 largest towns in England in 1801, leaving London aside. 14 of them sat within 2 km of a canal open by 1830. Between 1801 and 1861 those canal towns grew by a median of 4.0 times. The rest grew by at most 2.7 times. (At most, because the 1861 rankings stop at the top 30, so a town that fell out of them could only have grown so much.) England as a whole grew about 2.0 times between 1801 and 1851.
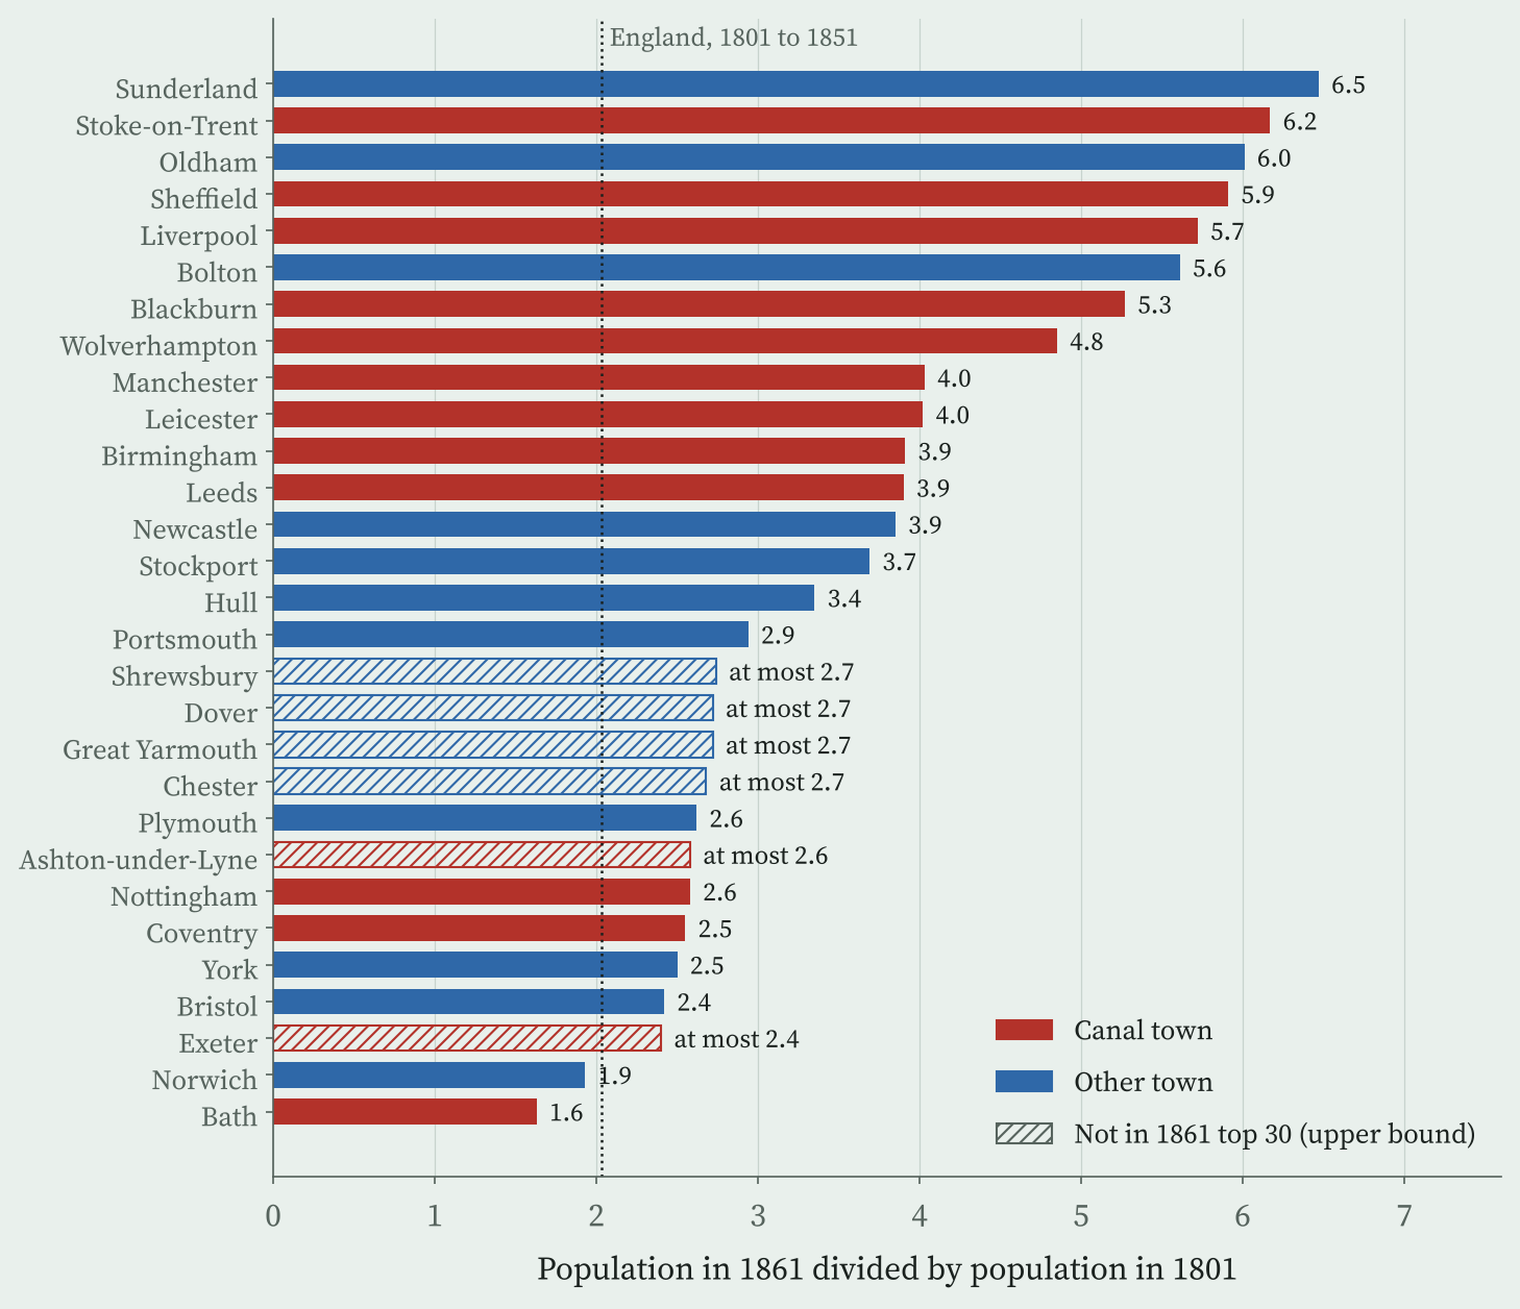
But look at who the other towns are. 6 of the 15 are on the coast, and most are old cathedral, county and port towns: Norwich, York, Exeter, Chester, Bristol. The canal towns are the new industrial places of the North and Midlands. And the fastest grower of all, Sunderland, had no canal; it is a coal port. Two cotton towns, Oldham and Bolton, also count as “other” in my data because their canal branches are not dated in my sources.
They were rising before the canals came
Here is the test I care about most. The same Wikipedia article ranks England’s largest towns in 1662, a century before the first big canal. Of the 14 canal towns of 1801, only 3 were in that 1662 top 30. Of the 15 other towns, 11 were. That gap is very unlikely to be chance (p = 0.009).
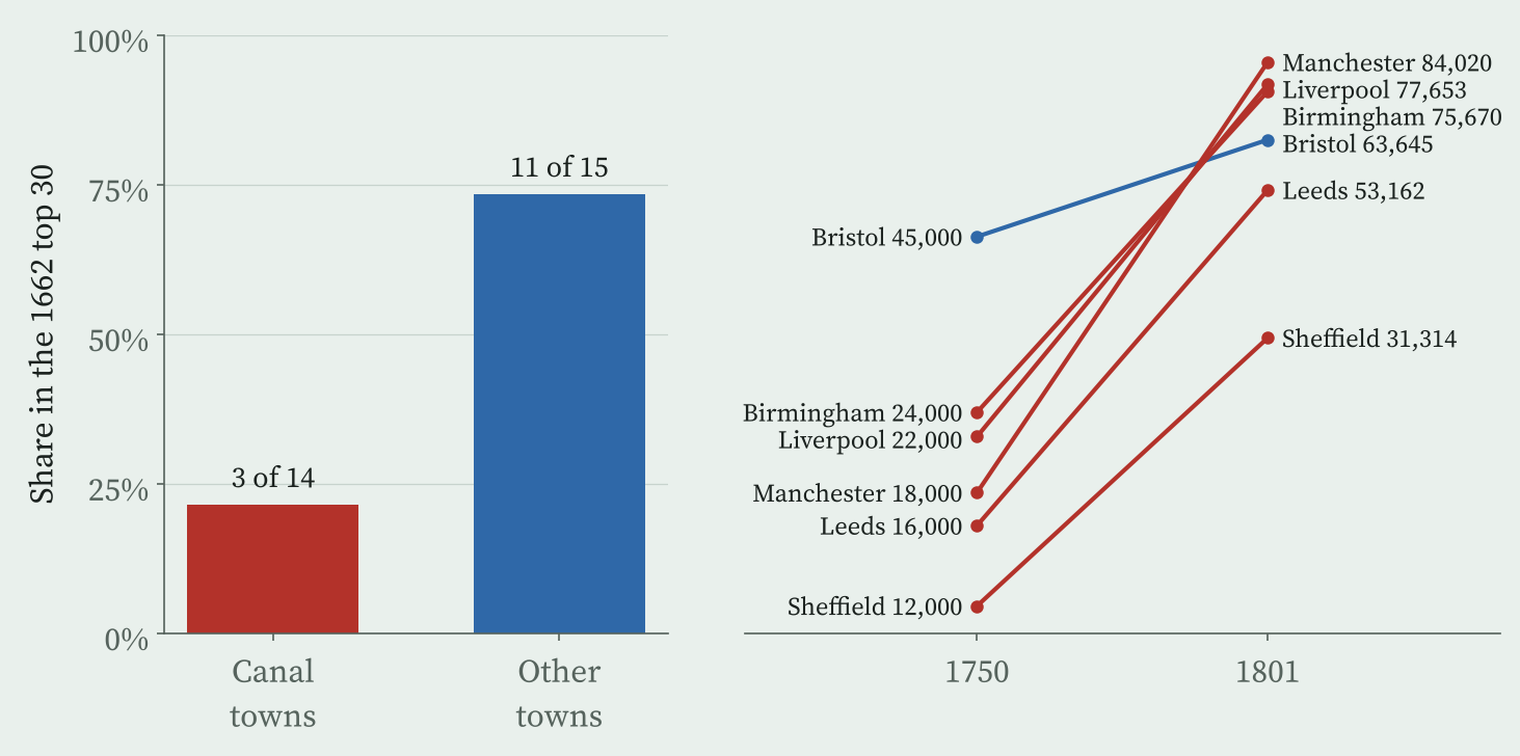
Manchester, Birmingham, Liverpool, Leeds and Sheffield are all missing from the 1662 table. By 1750, before any of the big canals, they already had between 12,000 and 24,000 people each. The canal towns were the boom towns of the eighteenth century first, and the canals followed them.
The canals were dug to towns that were already booming.
That does not mean the canals did nothing. Cheap coal and cheap carriage must have helped. But with these data I cannot say how much of the 4.0 against 2.7 gap the canals caused. And there is a second suspect: the railways, which arrived from 1830 and were everywhere by 1861. I have no railway data here, so the canal age and the railway age are mixed together.
Bigger today, but not richer
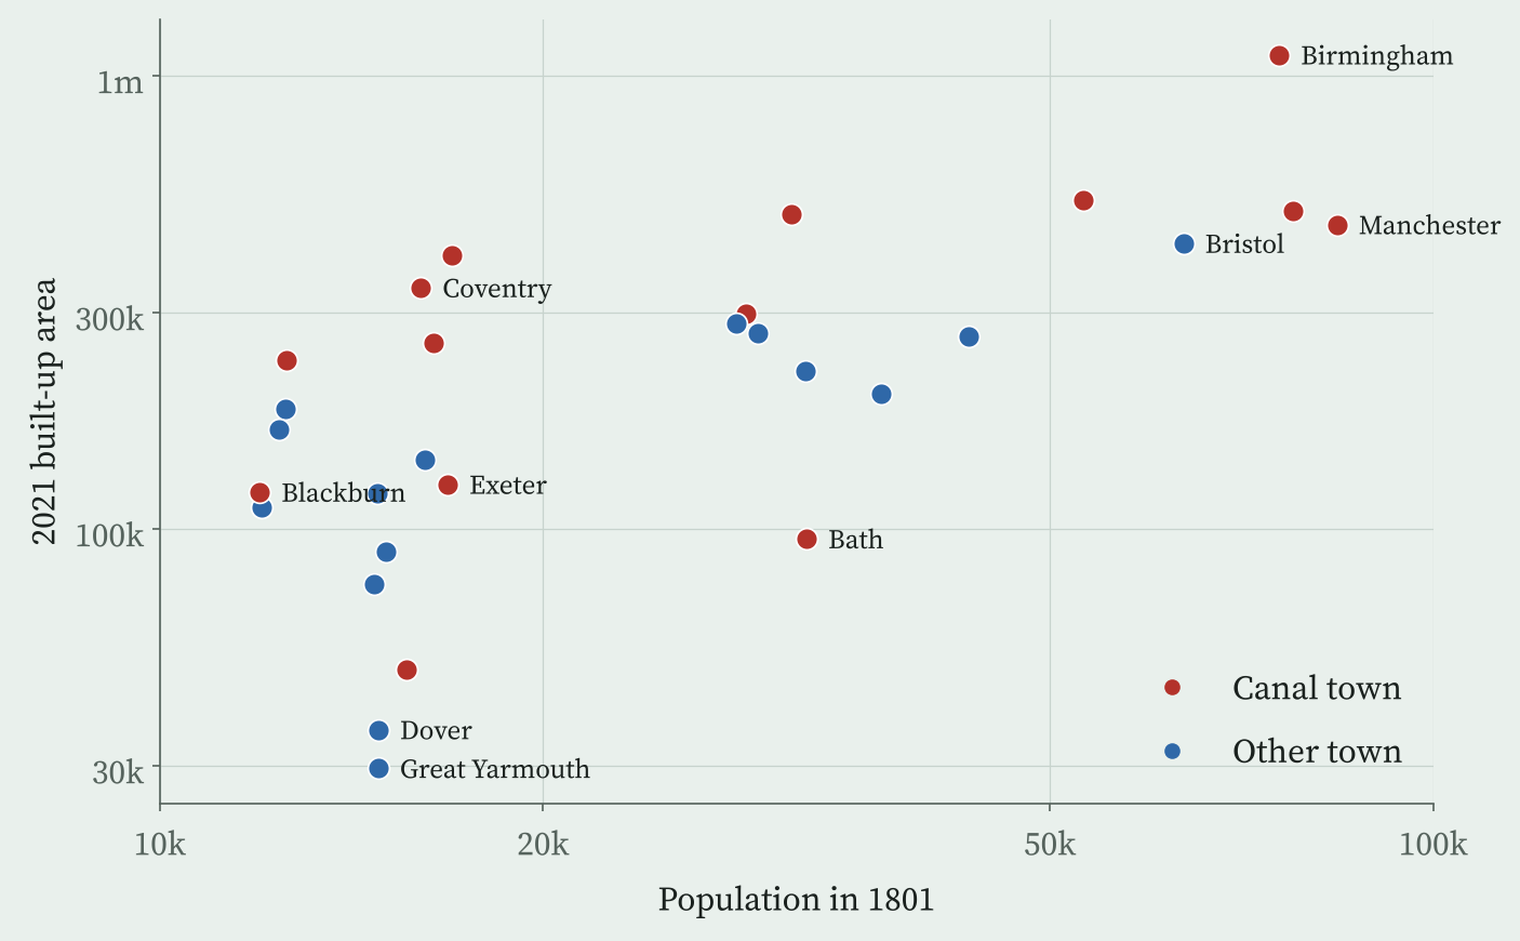
Two centuries on, the canal towns of 1801 have grown a median of 10.2 times to their 2021 built-up areas, against 6.9 times for the others. Size has stuck. Wealth has not. Using the ONS estimates of household income for the year to March 2023, and allowing for size in 1801, the coast and the North, the canal towns come out about 6.9% poorer.
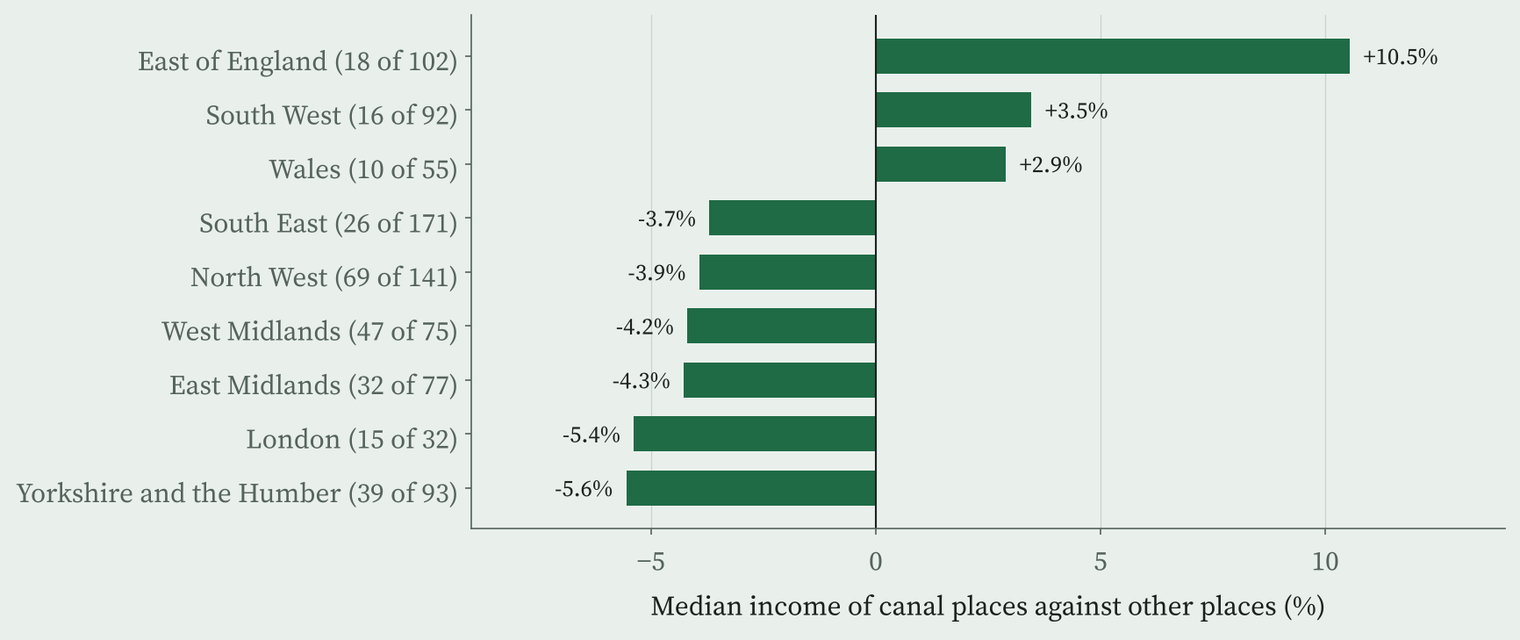
The same holds across all 884 towns and cities in England and Wales with at least 10,000 people. The 272 with a canal of 1830 or earlier within a kilometre of their edge are about 54% bigger than other places in their region, and once size is allowed for, about 2.7% lower in household income. Canal places are poorer than their neighbours in 6 of the 9 regions where both kinds exist.
Along the Leeds and Liverpool
Back to Lancashire. Blackburn grew from 11,980 people in 1801 to 129,200 in 1900. Burnley was not in the tables at all until 1900, when it had 97,000. Today Blackburn, Burnley and Wigan rank 701, 825 and 743 of 884 places for household income. Of the 30 towns of 10,000 or more along the canal, 26 are below the median for England and Wales.
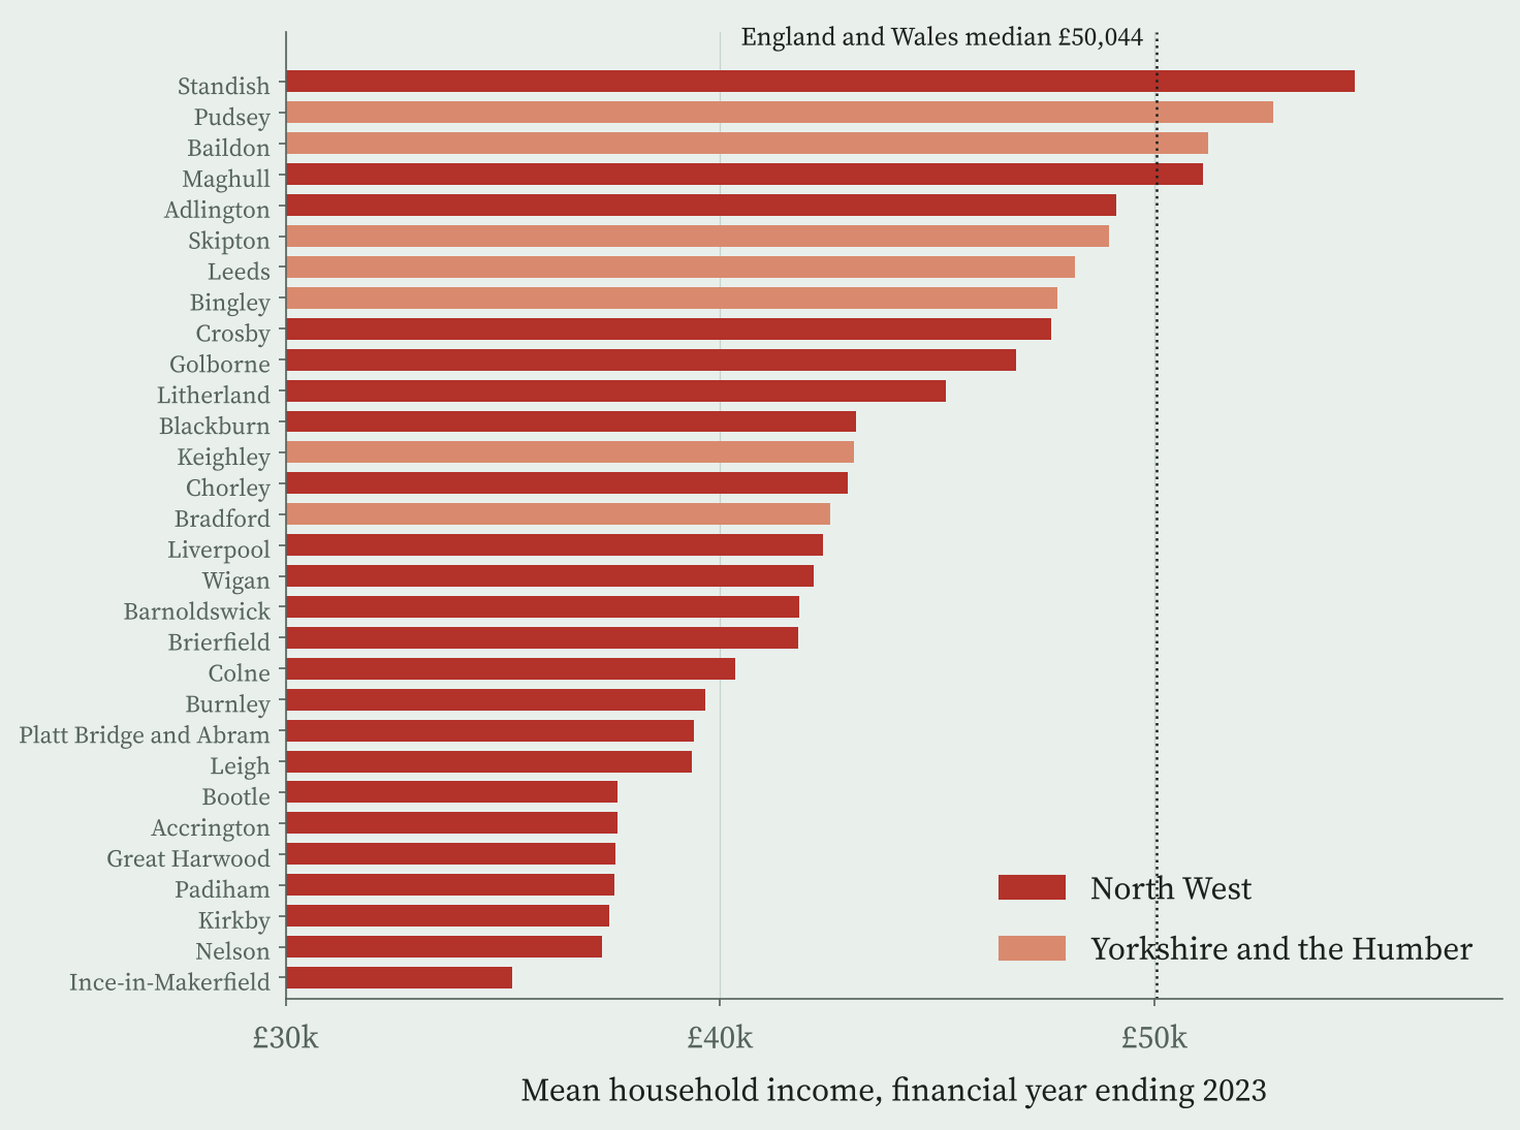
My reading, and it is only a reading, is that the canals tied towns to the industries of their age, coal, cotton and heavy goods, and those industries have gone. The towns kept their people. They did not keep their edge.
How I did this
Canal lines are OpenStreetMap waterway=canal ways, matched by name to the opening years in Wikipedia’s List of canals in the United Kingdom, with the 1929 Grand Union split back into its older canals and a few dates from Wikidata. Town populations come from the ranking tables in Wikipedia’s List of towns and cities in England by historical population, which list only the top 30 or 40 towns of each year and have no table for 1851. I placed each town with OS Open Names and matched it to its Census 2021 built-up area, with income from the ONS small area estimates. A canal town is within 2 km of a canal dated 1830 or earlier; the result holds at 1 km and with other definitions.
The samples are small and the dates are rough. Some canal towns count as “other” because their canal is undated or has been filled in, including Stockport, Bolton, Oldham, Derby and Bradford. Boundaries in 1801 and 2021 differ. Everything here is association, not cause.
Notes and sources
- Canal lines: OpenStreetMap contributors (ODbL), retrieved 27 October 2026.
- Opening years: Wikipedia, List of canals in the United Kingdom (CC BY-SA 4.0), and Wikidata (CC0).
- Town populations: Wikipedia, List of towns and cities in England by historical population (CC BY-SA 4.0); England’s population from Wikidata.
- 2021: Office for National Statistics, Census 2021 and income estimates for small areas, financial year ending 2023 (Open Government Licence v3.0); built-up areas and lookups from the ONS Open Geography Portal; OS Open Names. Contains OS data © Crown copyright and database right 2026.
- Paper, data and code: Zenodo and GitHub.
- I wrote the text, with drafting and editing assistance from Claude (Anthropic), which also helped prepare the analysis code. I reviewed and checked all text and results.

