
Tag: data visualisation
-
The Roman Commuter Belt?
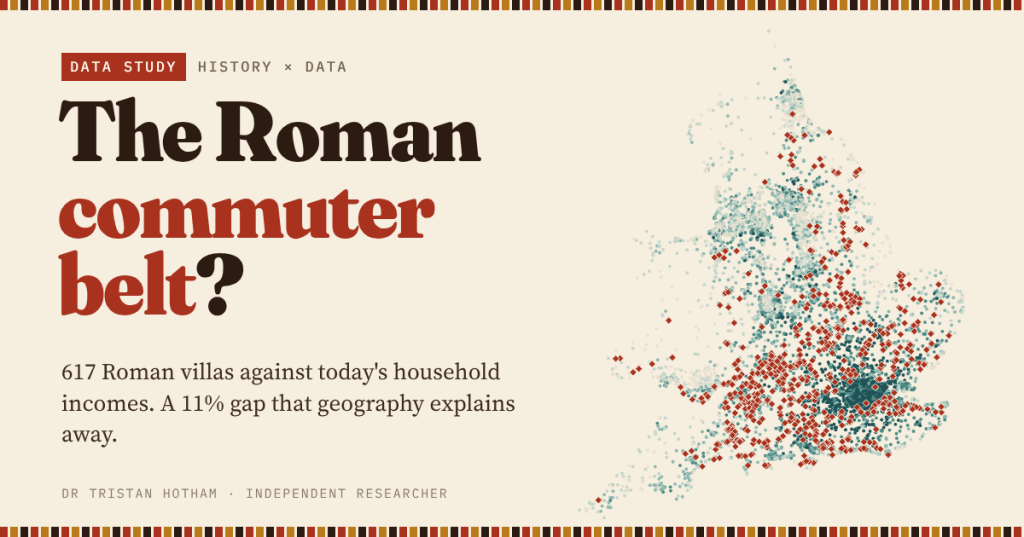
Roman villas and today’s richest neighbourhoods both crowd into the lowland south-east. I set 617 villas against household income across England and Wales: the villa premium is real at first sight, and almost all geography.
-
Laid Waste: the Harrying of the North
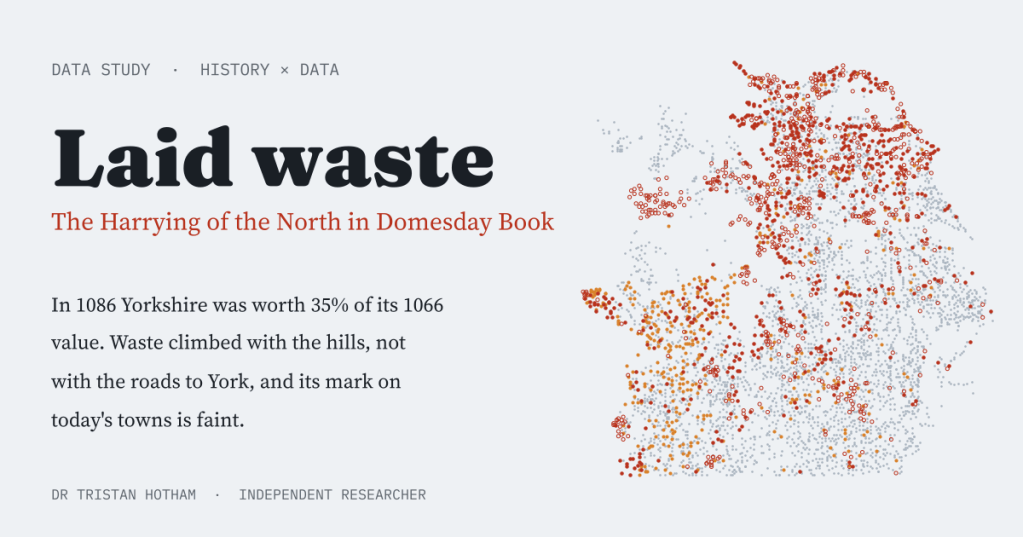
Domesday Book called hundreds of northern places waste after William the Conqueror’s Harrying of the North. I mapped them: Yorkshire was worth 35% of its 1066 value, the waste climbed the hills rather than the roads to York, and its scar on today’s map is faint.
-
Fire on the Hills: how fast could the Armada beacons carry the news?
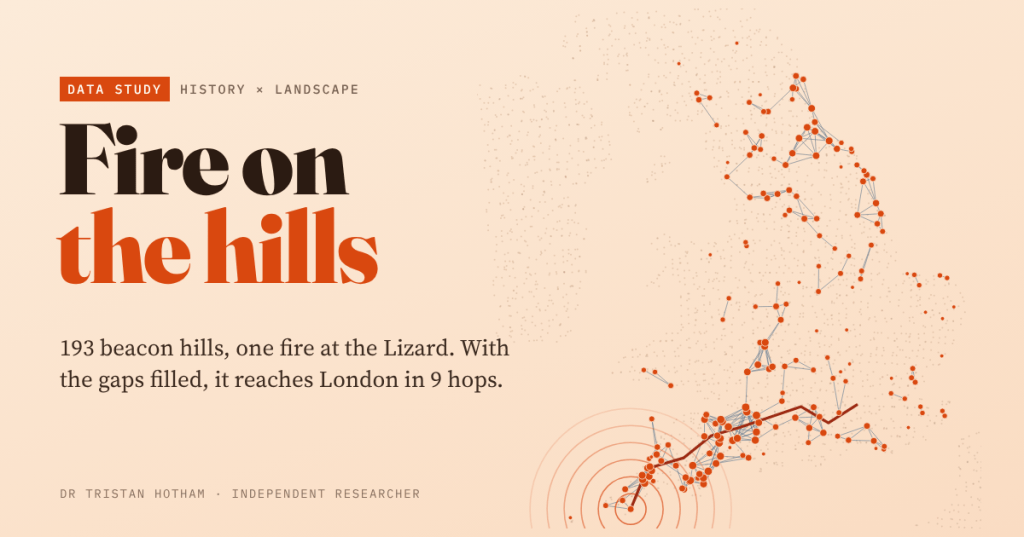
I traced the lines of sight between 193 hills named for a beacon and lit a fire at the Lizard. On the names alone it never leaves Cornwall; fill the gaps and it reaches London in 9 hops.
-
Ford or Bridge?
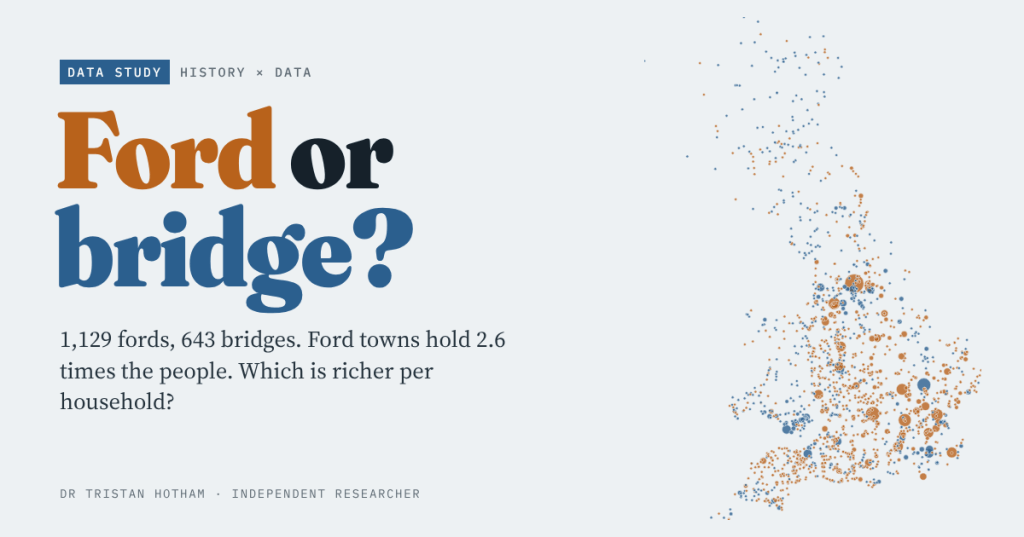
Oxford waded, Cambridge built. I set every ford and bridge place-name in Britain against the 2021 census and small-area income: ford towns hold 2.6 times the people, and the typical ford place is a little richer per household too.
-
Gallows Hill: where Britain put its execution places
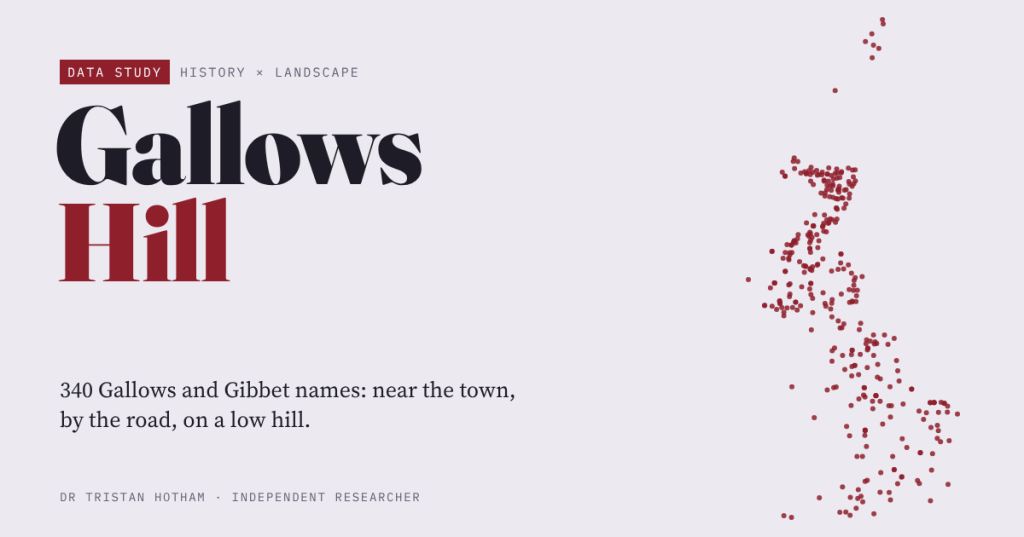
I measured 340 Gallows and Gibbet names on the OS map against fifty ordinary places each. They sit near towns but outside them, beside main roads, on low rises rather than high hills; the boundary story is faint.

