
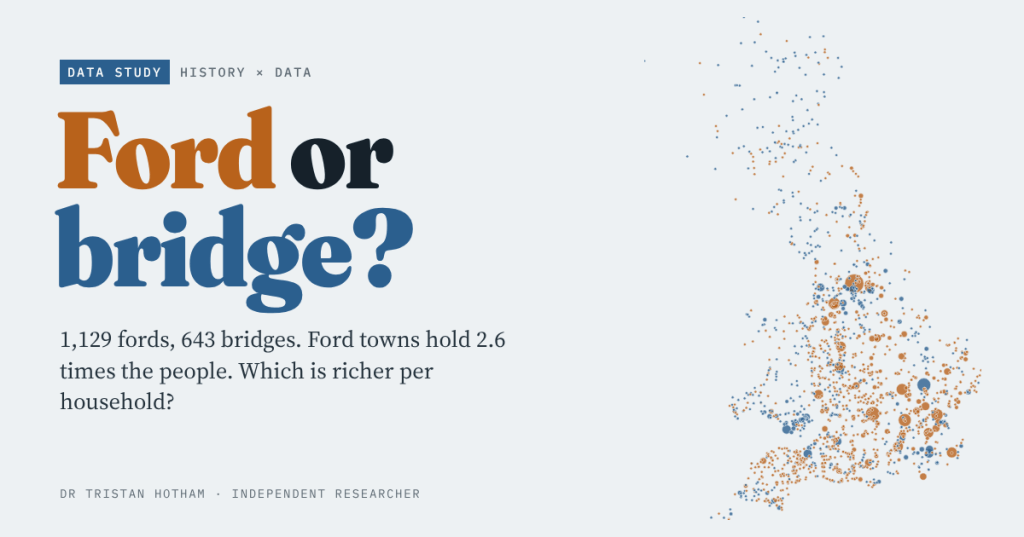
Oxford, Bradford and Stratford waded across; Cambridge, Tonbridge and Pontypridd built a bridge. I set every ford and bridge place-name in Britain against the 2021 census and the latest small-area income figures to see which is richer today, and whether a bridge ever helped a place grow.
Before there were bridges there were fords: shallow places where people, carts and cattle could wade across. Old English named hundreds of settlements after them. A bridge was a different thing. It needed timber or stone, money, and someone to keep it up. So a question has been nagging at me. If a place was named for its bridge, did that bridge make it? And today, which kind of place is better off: the fords or the bridges?
I took all 43,274 towns, villages, hamlets and suburbs on the Ordnance Survey’s open gazetteer and sorted their names. 1,129 are fords (Oxford, Garforth, Welsh rhyd), 643 are bridges (Tonbridge, Bridge of Allan, Welsh pont), and the rest are everything else. Then I matched them to the 2021 census and to the Office for National Statistics’ newest estimates of household income for small areas.
A map of crossings
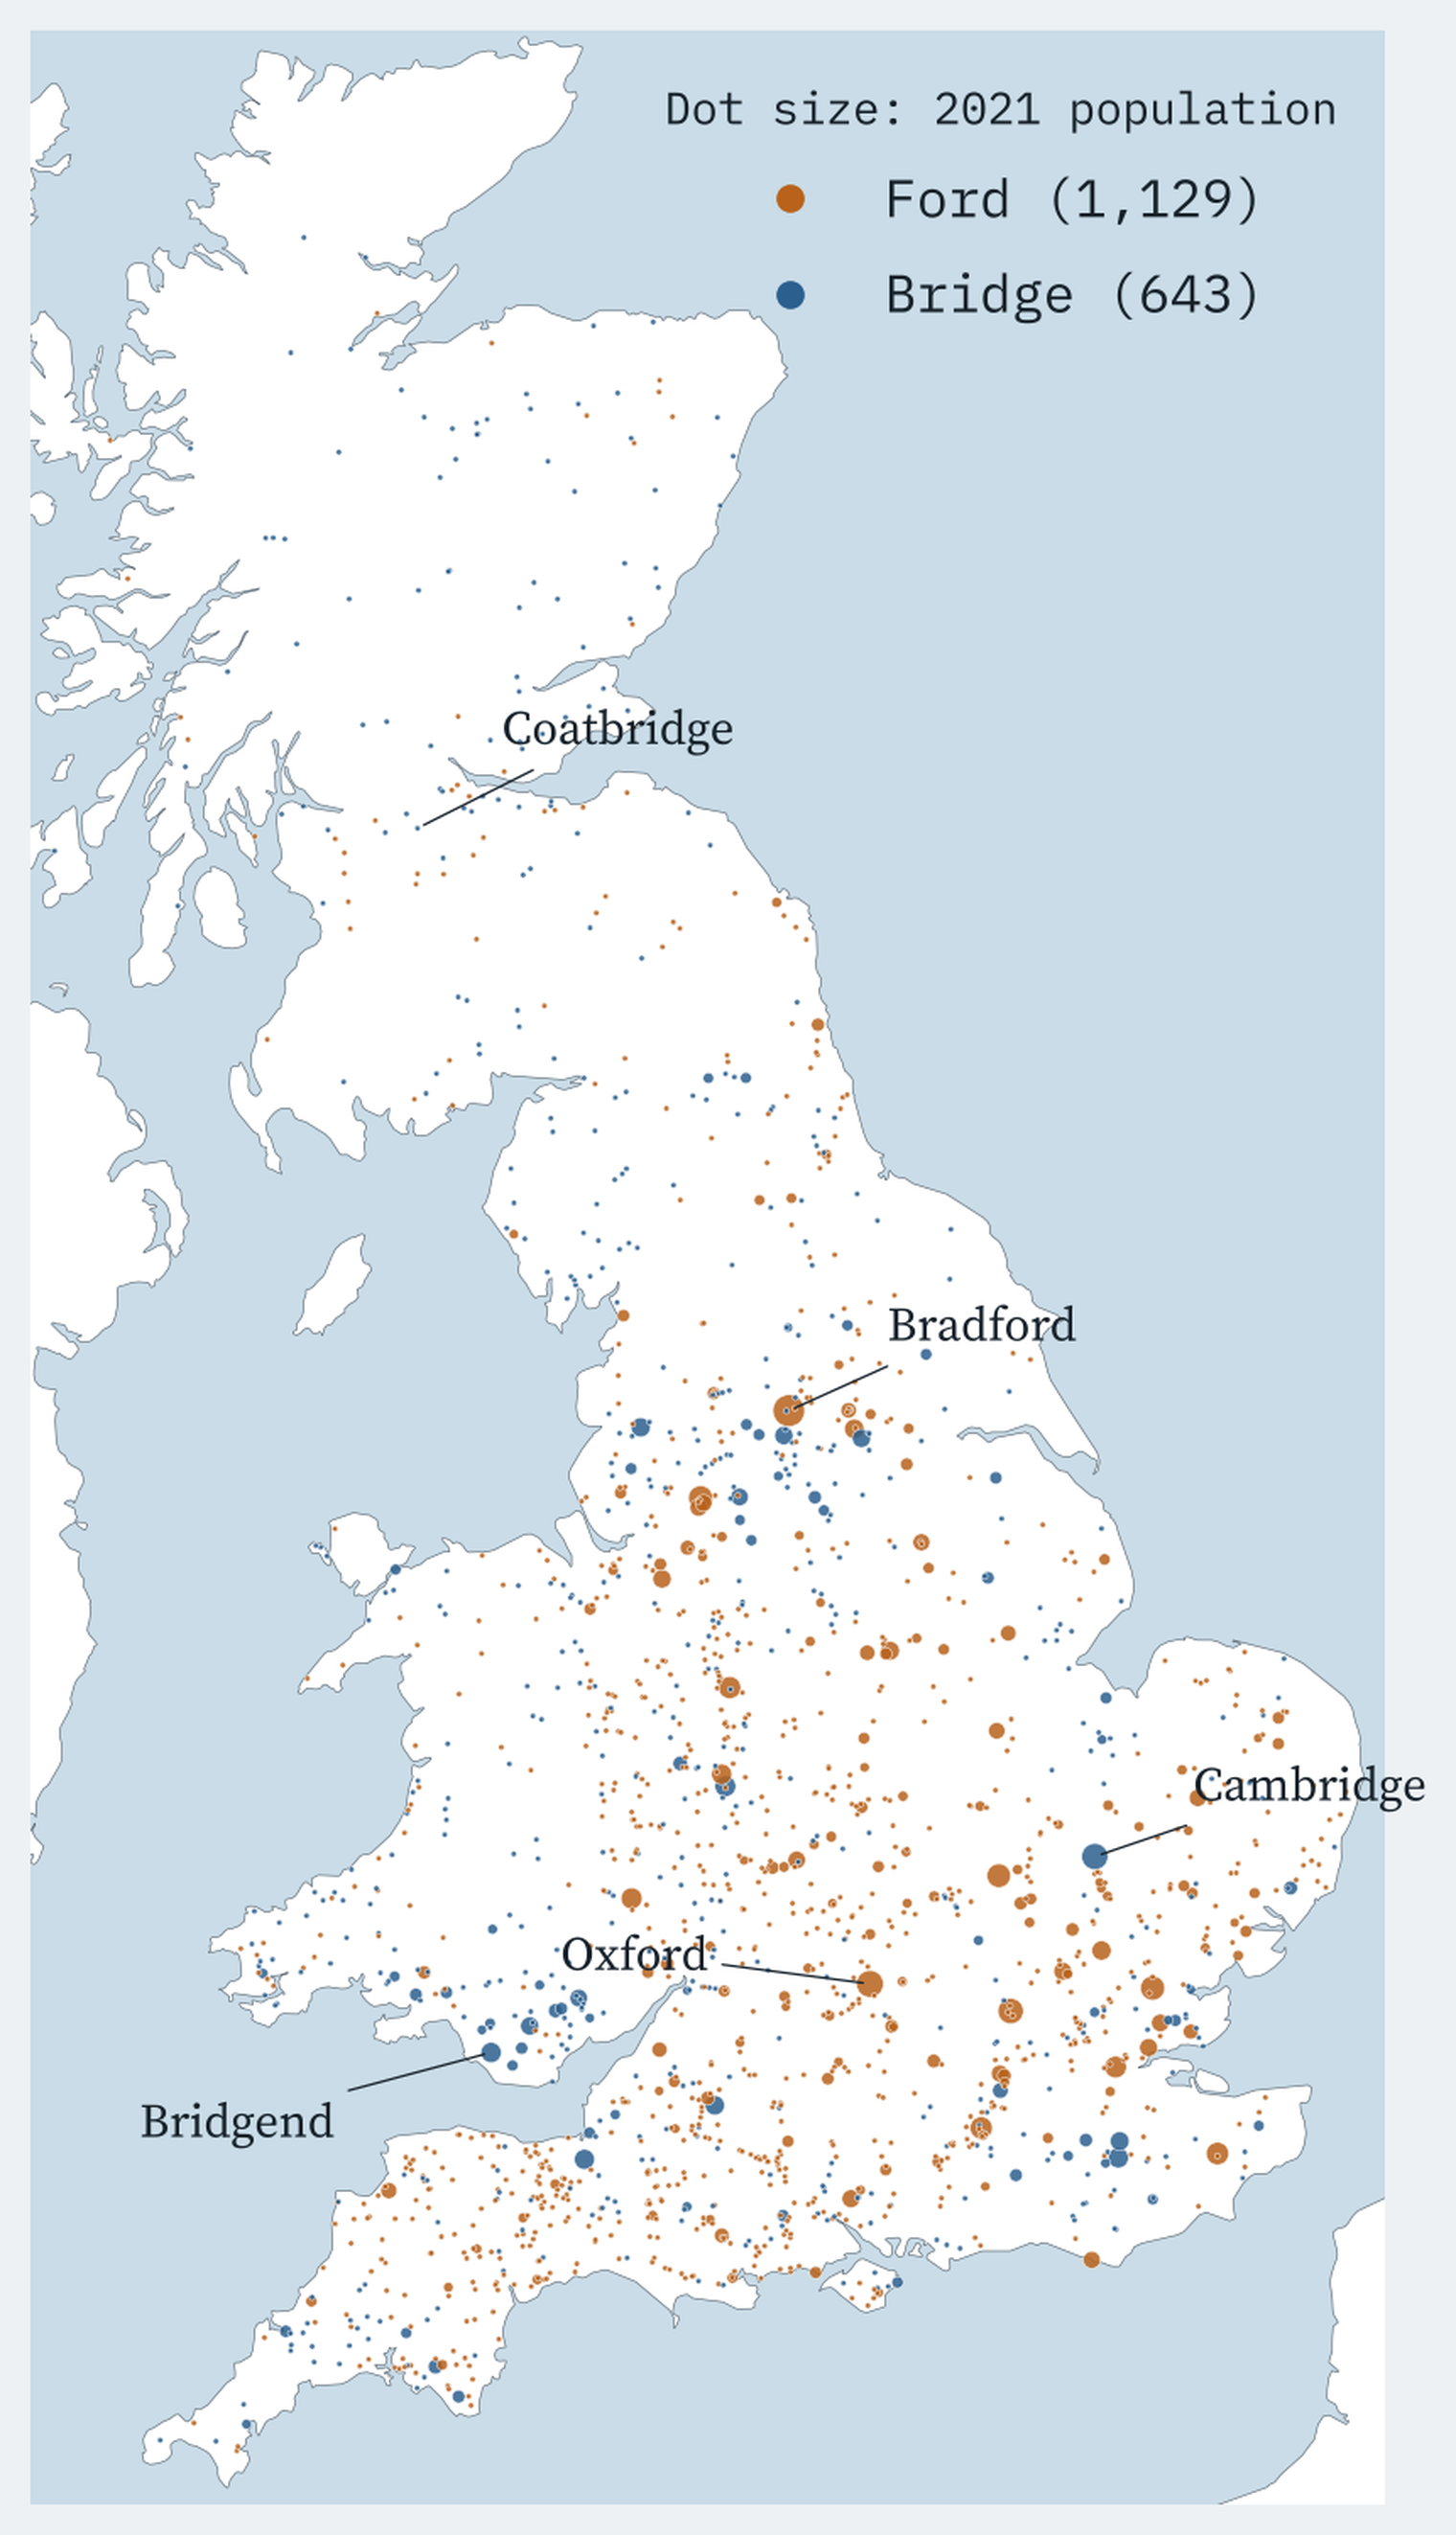
England is ford country, with 1,034 fords to 434 bridges. Wales and Scotland are the other way round: 110 bridges to 50 fords in Wales, most of them pont names, and 99 to 45 in Scotland, with its many “Bridge of” villages. The names mean what they say: half of all bridge places sit within 170 m of a named river, against 360 m for fords and 700 m for everywhere else.
In total, the fords win by a mile
To count people I matched each name to the ONS built-up area of the same name and added up its census population. In England and Wales, leaving out London (whose built-up area is split by borough), ford towns hold 2,290,193 people and bridge towns 867,692. That is 2.6 times as many people, and 2.6 times as much household income.
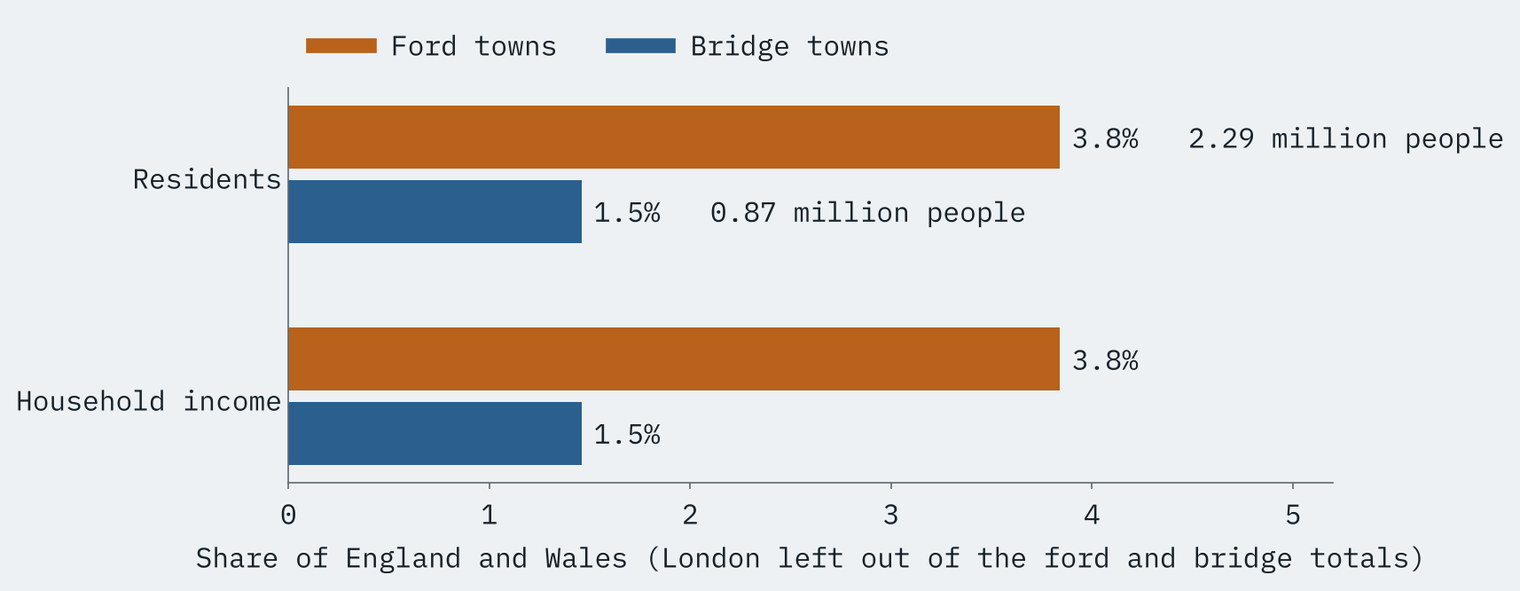
Part of that is just numbers: there are 2.1 ford towns for every bridge town. The rest is the giants. Bradford alone, with 331,757 people, outnumbers the top four bridge towns put together, and the ford list runs on through Oxford, Watford, Chelmsford, Salford and Bedford. On the bridge side Cambridge (149,510) stands alone; the next biggest, Stourbridge, has 58,064.
Per household, a narrow ford lead
Wealth per head is a closer race. The ONS estimates the mean income of households in each neighbourhood; it does not publish income per person at this scale. The typical ford town has households on £58,732 a year, the typical bridge town £51,752. Weight each town by its population, so every resident counts once, and it is a dead heat: £55,537 against £55,664. That tie is Cambridge’s doing. Without it, bridge towns fall to £52,499.
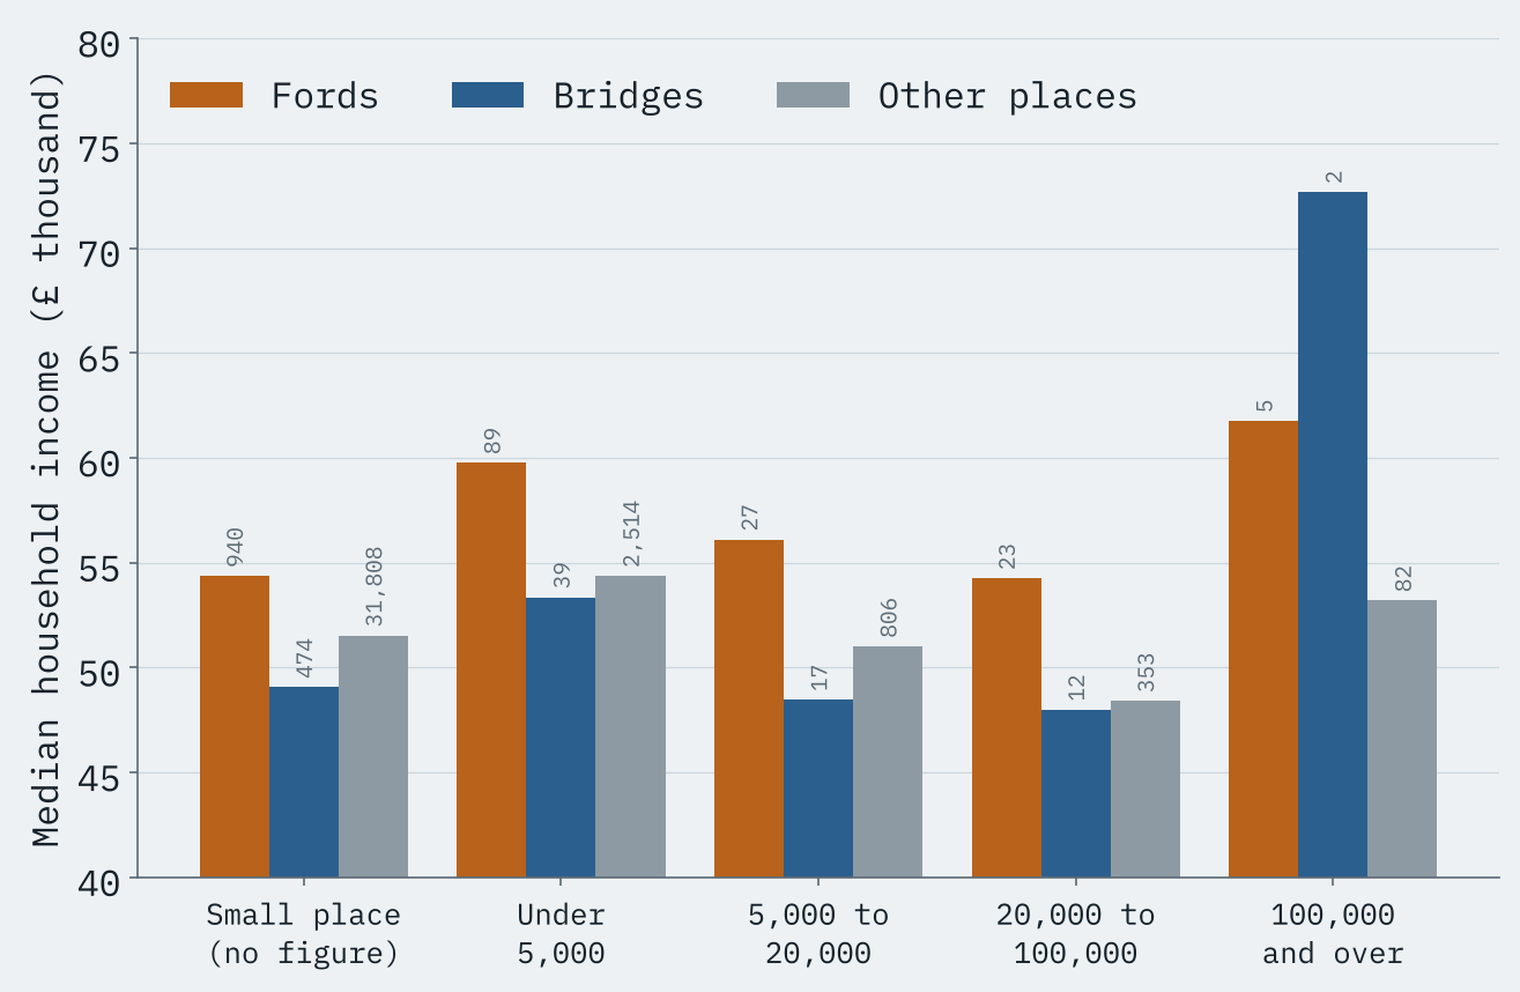
Comparing like with like does not change the picture. Within every size of place but the very largest, which has only two bridge towns, the median ford place is richer than the median bridge place.
The south-east effect
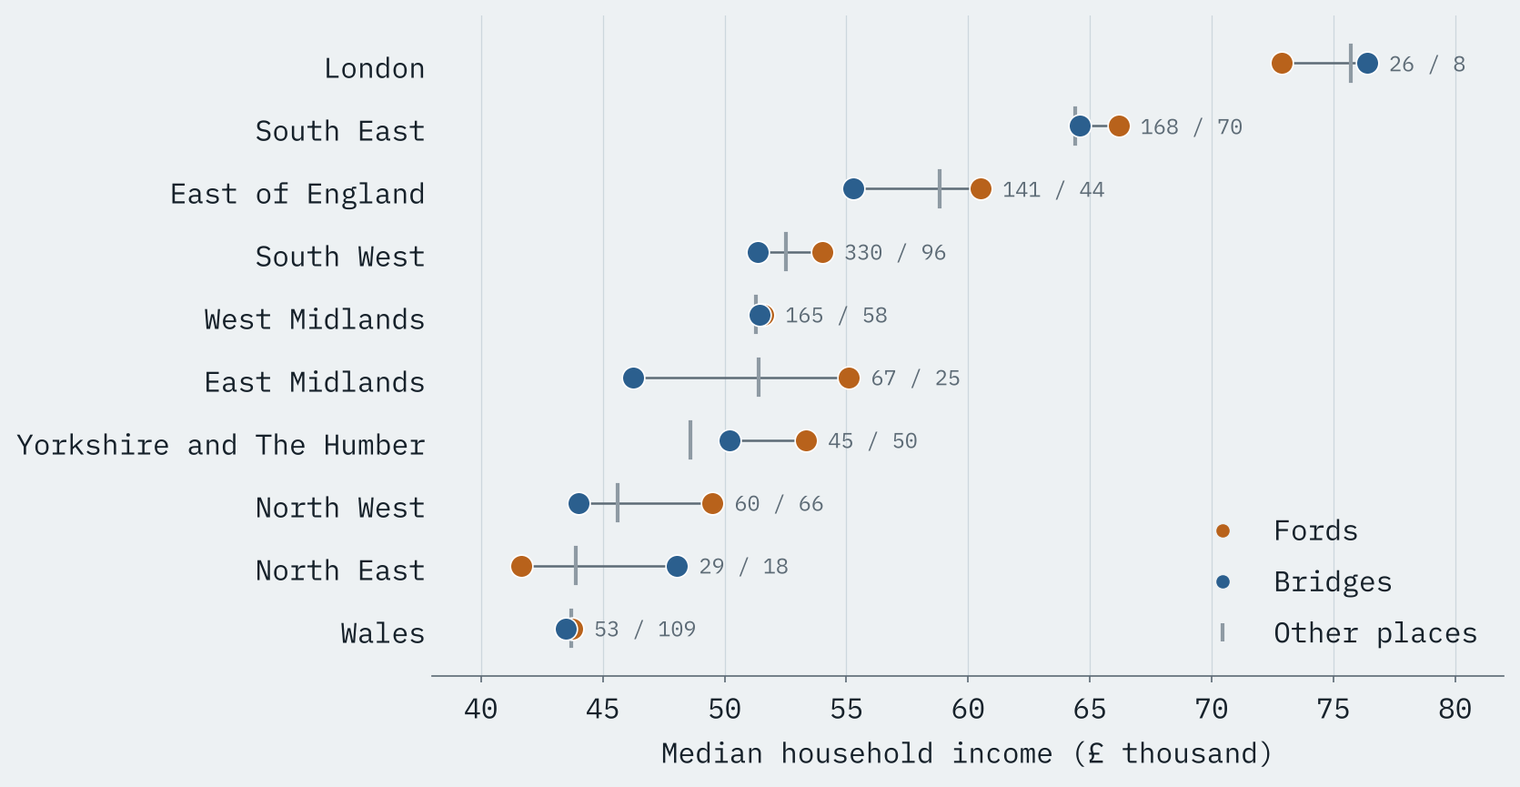
Much of the gap is geography. 31% of ford places are in London, the South East or the East of England, against 22% of bridge places, and Wales alone holds 20% of the bridges. Even so, region by region the fords lead in 8 of 10, though in the West Midlands and Wales only by a whisker. Bridges come out ahead only in London and the North East.
The bridge premium is a ford premium
Putting it together, I modelled household income for all 37,191 named places in England and Wales. Raw, bridge places are 8.5% poorer per household than ford places. Hold region and size equal and the gap shrinks to 3.6%, but it does not go away, and it survives every check I tried: dropping doubtful names, dropping two-word names like Hebden Bridge, England only, adding distance to a Roman road.
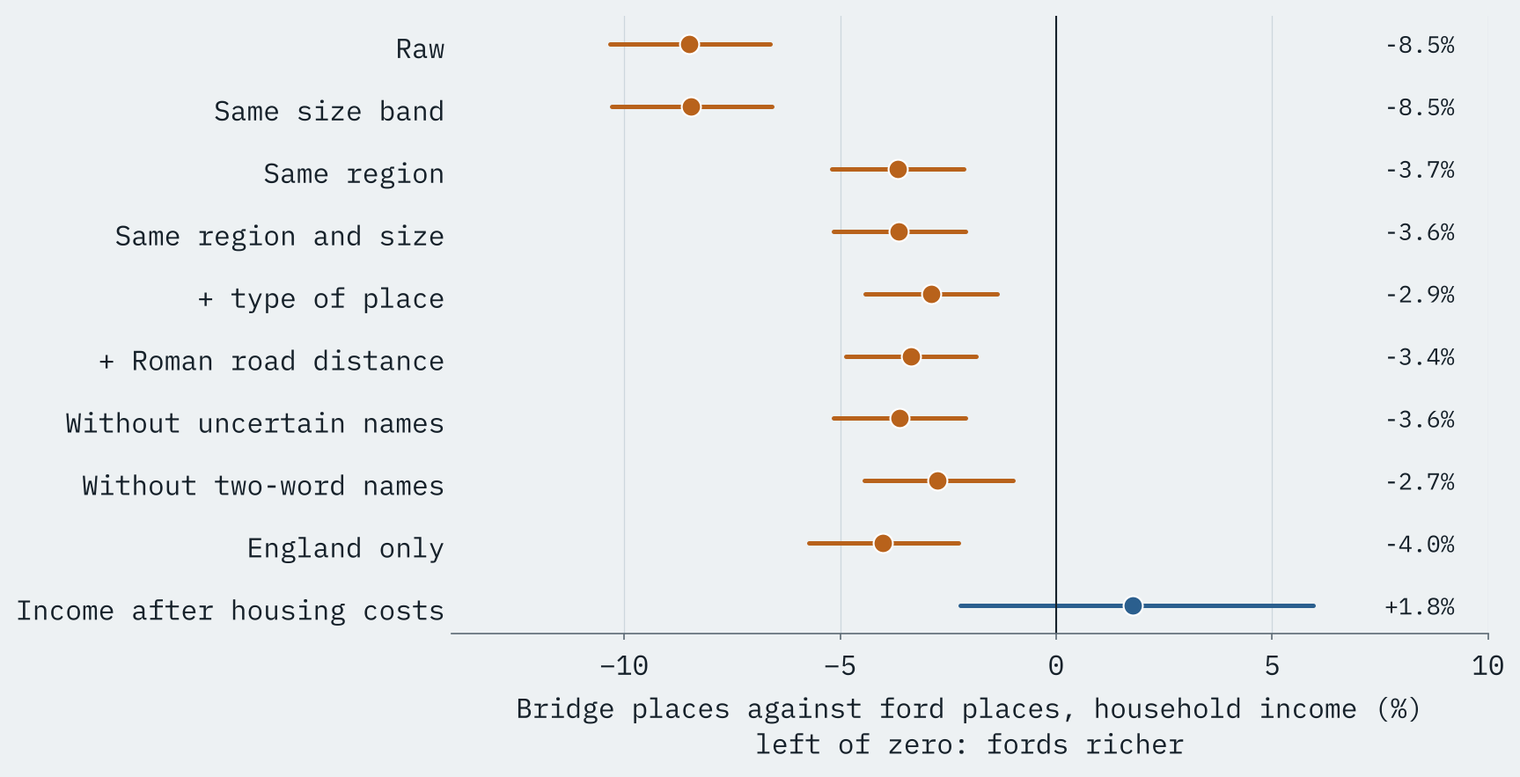
One measure tells a different story. On income after tax and housing costs, bridge towns are 1.8% ahead, well within the margin of error. Some of the ford lead is gross income that goes on housing.
If there is a premium in a crossing name, it belongs to the ford.
Did a bridge help?
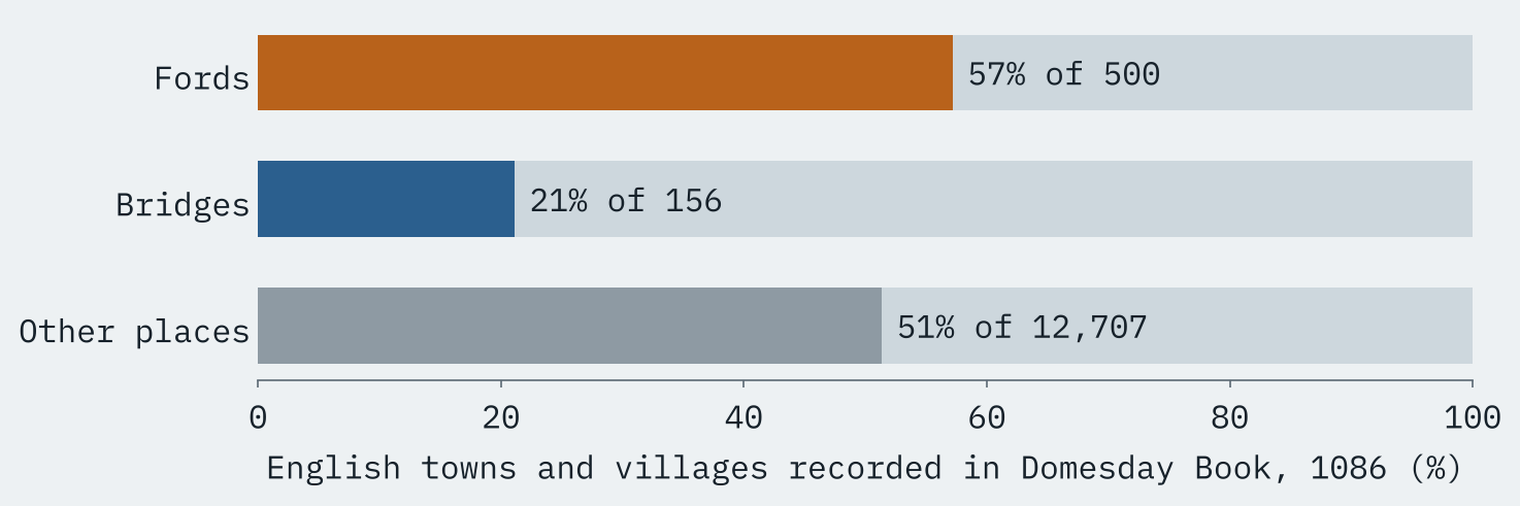
This is the question I most wanted to answer, and the one the data can answer least. What it can show is that bridge names are younger. Of England’s ford-named towns and villages, 57% are recorded in Domesday Book in 1086. Of the bridge-named ones, only 21%. 14 ford places had burgesses, the townsmen of a borough, among them Hereford, Hertford, Stafford and Thetford. Of the bridge places, only Cambridge did.
And bridge places are not bigger than ford places once region is allowed for; the estimate comes with a range from 23% smaller to 55% larger, which is no evidence either way. I hoped to test real medieval bridges directly, but Wikidata dates only 26 British bridges to before 1540, the famous ones in places like Durham, Chester and Hereford. That is a list of which bridges get written about, not a test of what bridges do. My best guess is that bridges were usually built where a place and a road already were, often at the old ford: Hereford is a ford name with a medieval bridge. But that is a guess, not a finding.
A pleasing check on the data: all 19 Stratford and Stretford places, “the ford on the street”, lie within a kilometre of a mapped Roman road.
How I did this
Names come from OS Open Names. A name is a ford if its last main word ends in -ford, -fords or -forth, and a bridge if it ends in -bridge, -brig or -brigg; “Bridge of” names, Welsh pont and rhyd names and Gaelic àth names are included. I checked 13 names against a source: Telford (named after the engineer), Gifford (a family) and Milford Haven (a Norse fjord) are out, Pontefract (“broken bridge”), Brigg and Brighouse are in, and Bridgwater is flagged as uncertain. Populations are Census 2021 residents of ONS built-up areas; income is the ONS mean total household income for the financial year ending 2023, for the neighbourhoods that make up each town or, for small places, the nearest neighbourhood. Domesday comes from the Hull Domesday Project data. Scotland has no matching income data, so it sits outside the income tests. Everything here is correlation, not cause and effect.
Notes and sources
- Place names and rivers: OS Open Names and OS Open Rivers. Contains OS data © Crown copyright and database right 2026 (Open Government Licence v3.0).
- Population: Office for National Statistics, Census 2021 (TS001), with the ONS Built-up Areas 2022 and lookups (Open Government Licence v3.0).
- Income: Office for National Statistics, Income estimates for small areas, England and Wales, financial year ending 2023, published 10 December 2025 (Open Government Licence v3.0).
- Domesday: Hull Domesday Project, Professor J.J.N. Palmer, George Slater and the University of Hull (CC BY-NC-SA), via realm-domesday.
- Bridges: Wikidata (CC0) and OpenStreetMap (ODbL). Roman roads: Itiner-e (de Soto and others 2025, CC BY 4.0).
- Paper, data and code: Zenodo and GitHub.
- I wrote the text, with drafting and editing assistance from Claude (Anthropic), which also helped prepare the analysis code. I reviewed and checked all text and results.

