
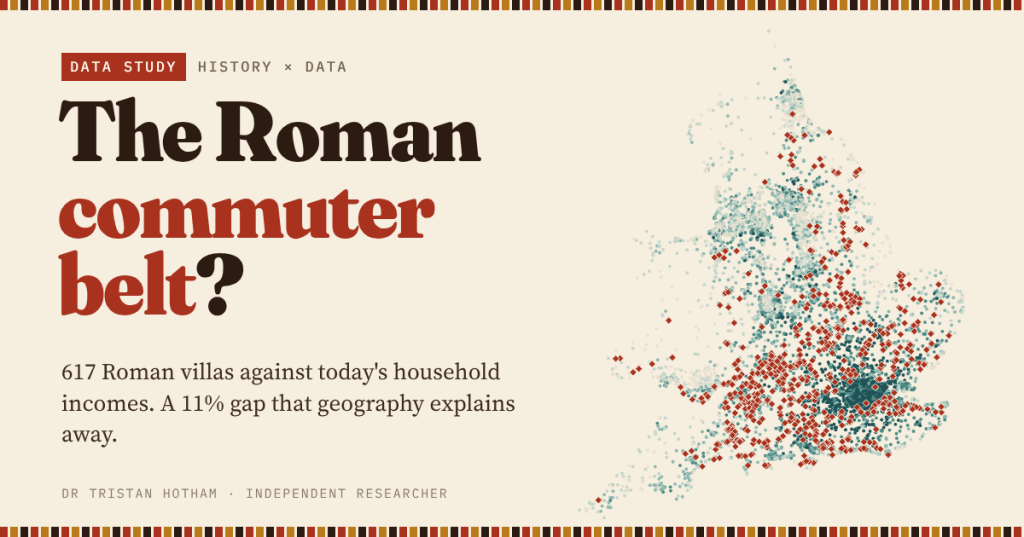
Roman villas and today’s richest neighbourhoods both crowd into the lowland south-east. I built an open list of 617 villas and set it against household income in every neighbourhood of England and Wales, to see whether the villas mark the money or just the map.
Drive west out of London towards the Berkshire Downs and the Cotswolds and you pass through prosperous commuter country. In Roman Britain the same countryside was dotted with villas: the farmhouses and country houses of the province’s landed families, with their mosaics, bath suites and painted walls. Put a map of villas next to a map of income and the resemblance is hard to miss.
Recently I asked whether Domesday Book still predicts the size of English places. Here I go back further, to Roman Britain, with a sharper question. Are the neighbourhoods next to Roman villas richer today? And if they are, is that about the villas, or just about being in the lowland south-east?
Two maps that look alike
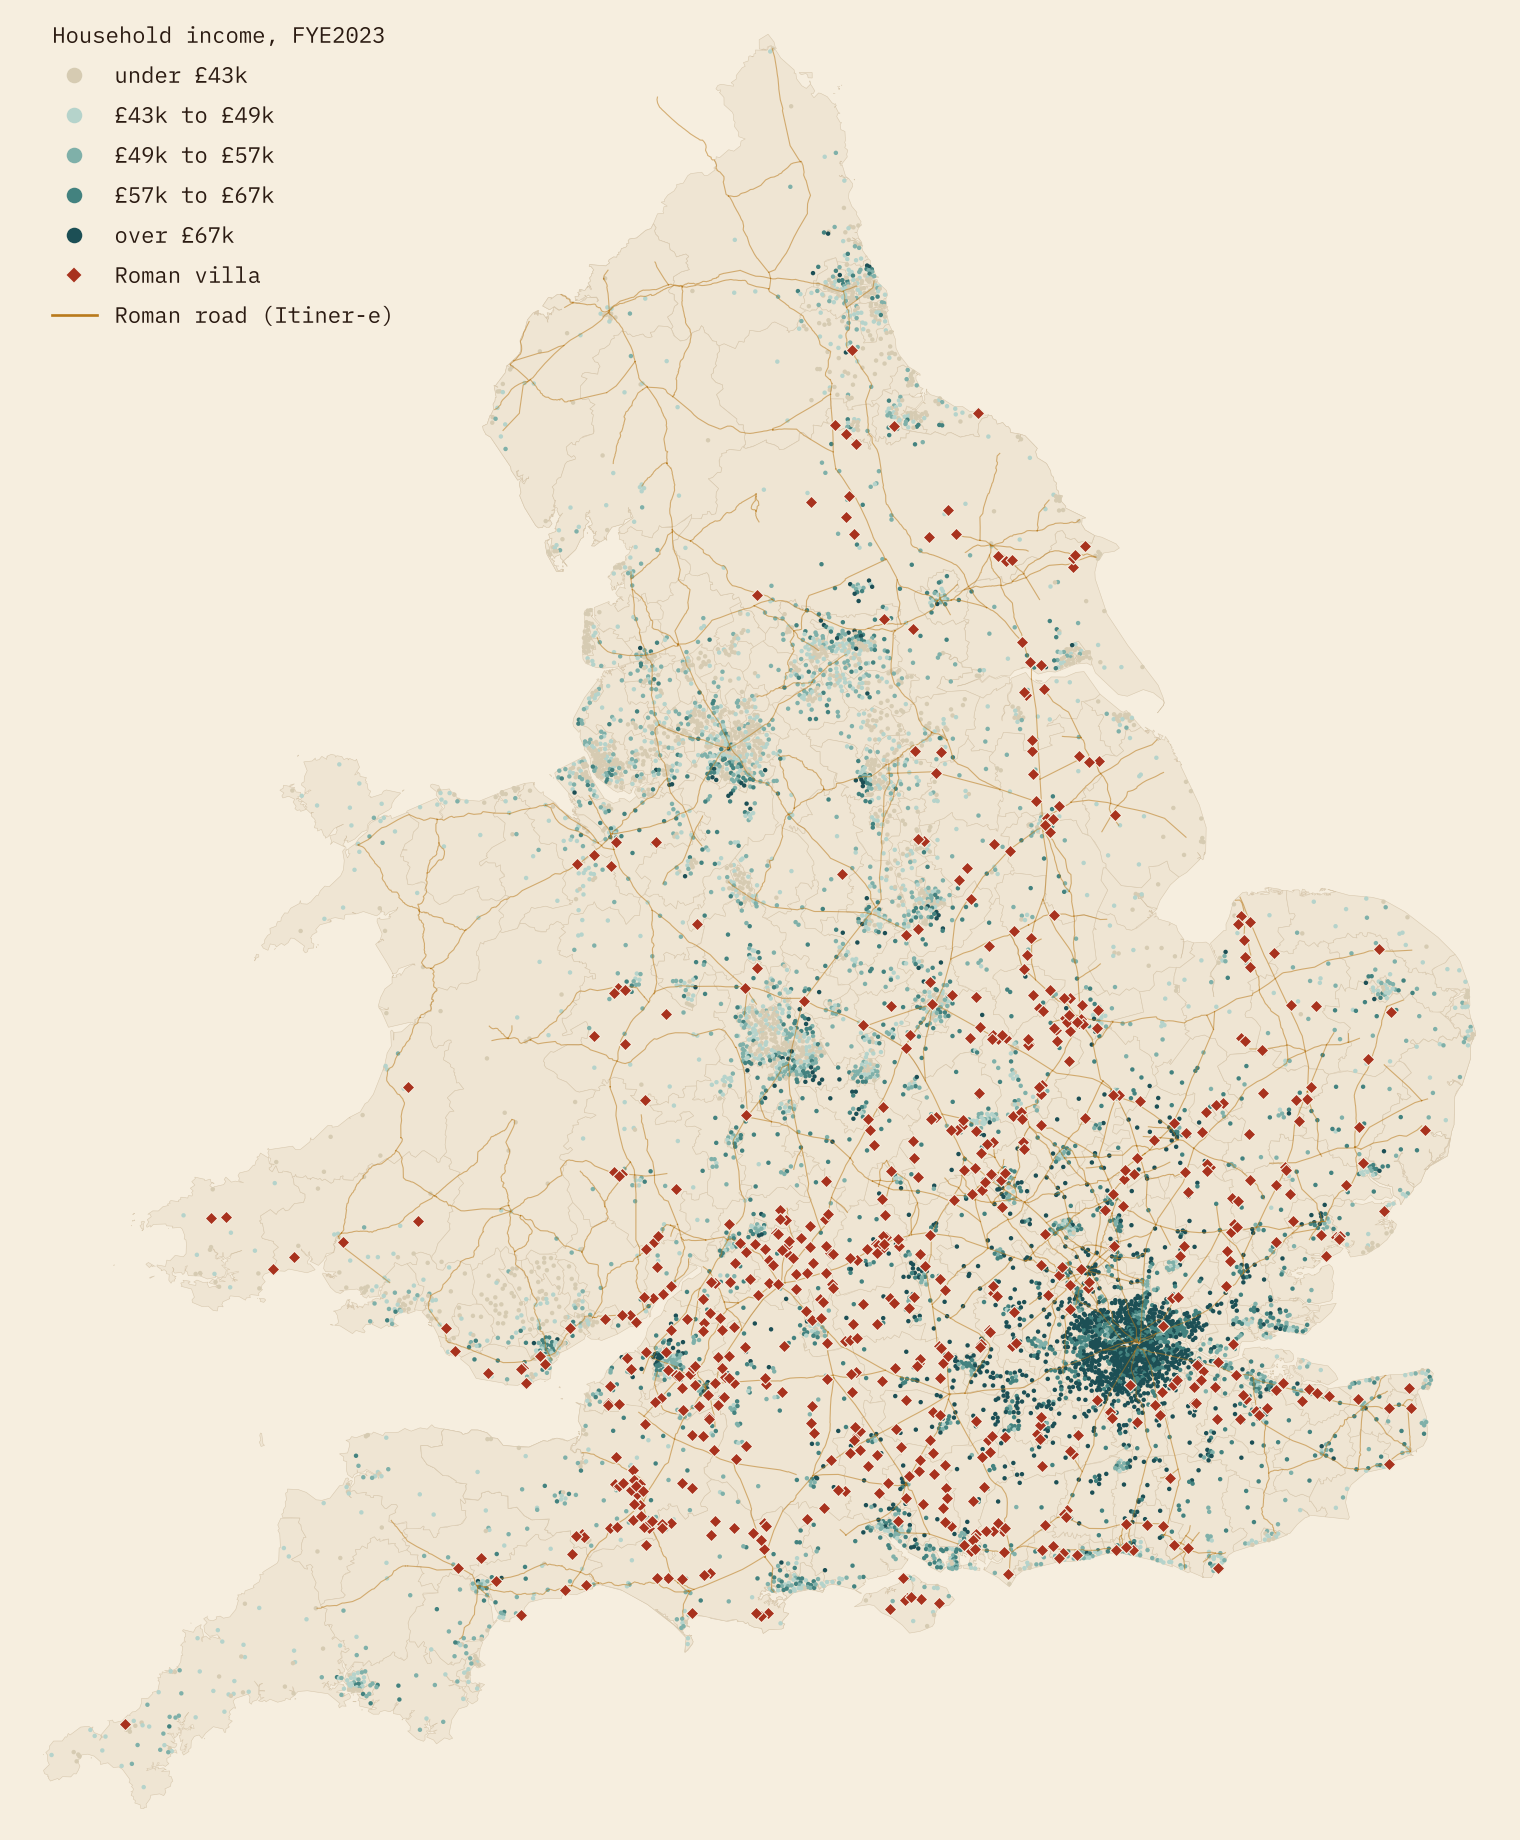
The villas form a broad arc from Kent through Hampshire, Wiltshire and Somerset to the Cotswolds and the East Midlands. About 74% of them lie in the South East, East, South West and London. Today’s money has a different shape: a dark core around London that fades with distance.
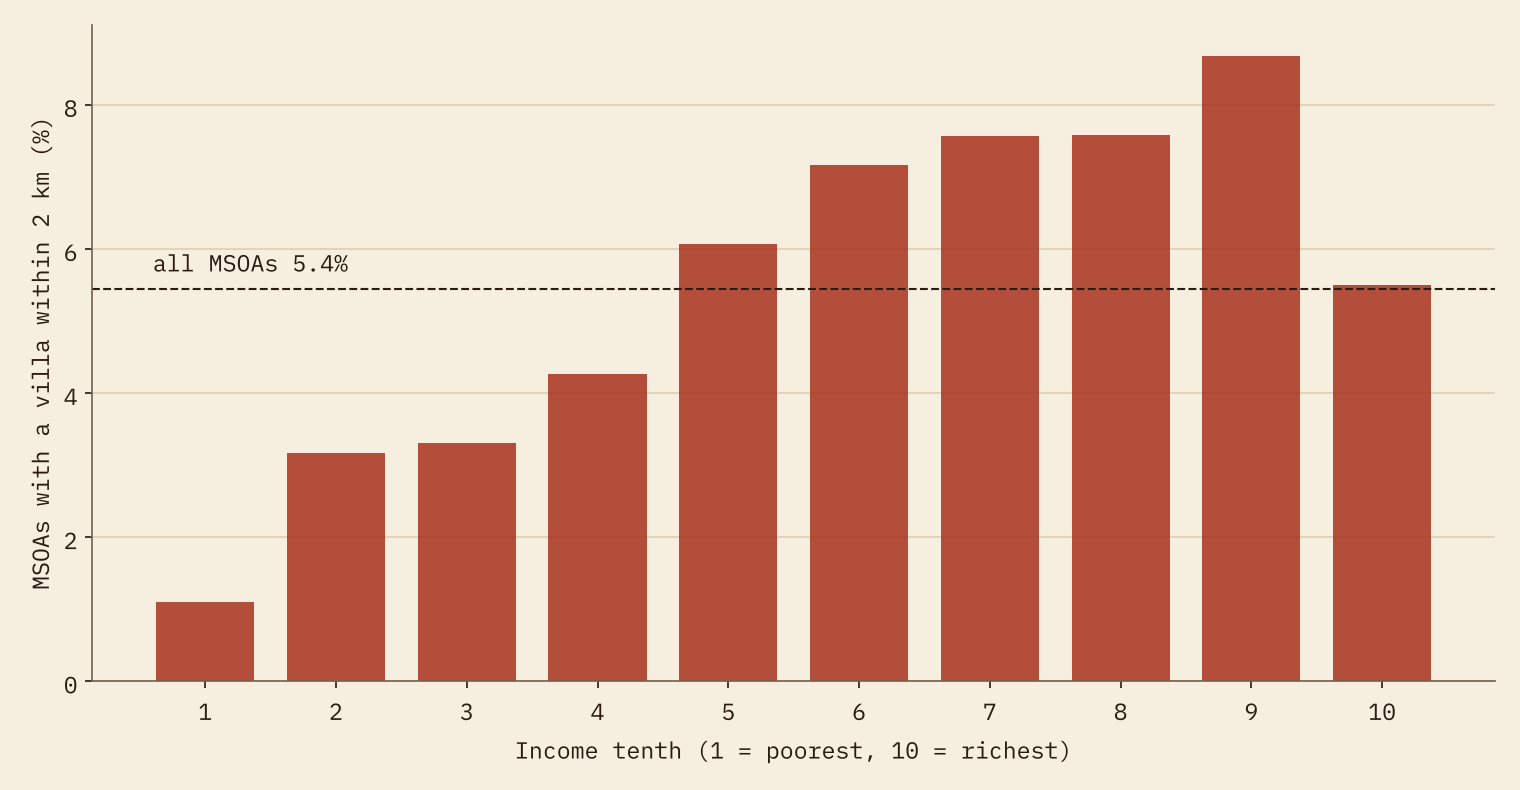
I call a neighbourhood a “villa neighbourhood” when a known villa lies within 2 km of its population-weighted centre. That is 395 of the 7,264 middle layer super output areas (MSOAs) of England and Wales. Their median household income is £57,822, against £52,315 for the rest: 11% more. In the poorest tenth of neighbourhoods only 1.1% have a villa nearby.
The villa belt is not the commuter belt
Distance from London is the obvious suspect. Income falls steadily as you move away from Charing Cross, from a median of £72,872 within 25 km to £44,110 beyond 300 km. Villas follow a different curve. They are scarce in the inner ring, where London has built over most of what there was, peak at 10.5 per 1,000 km² between 75 and 100 km out, and then thin away to the north and west.
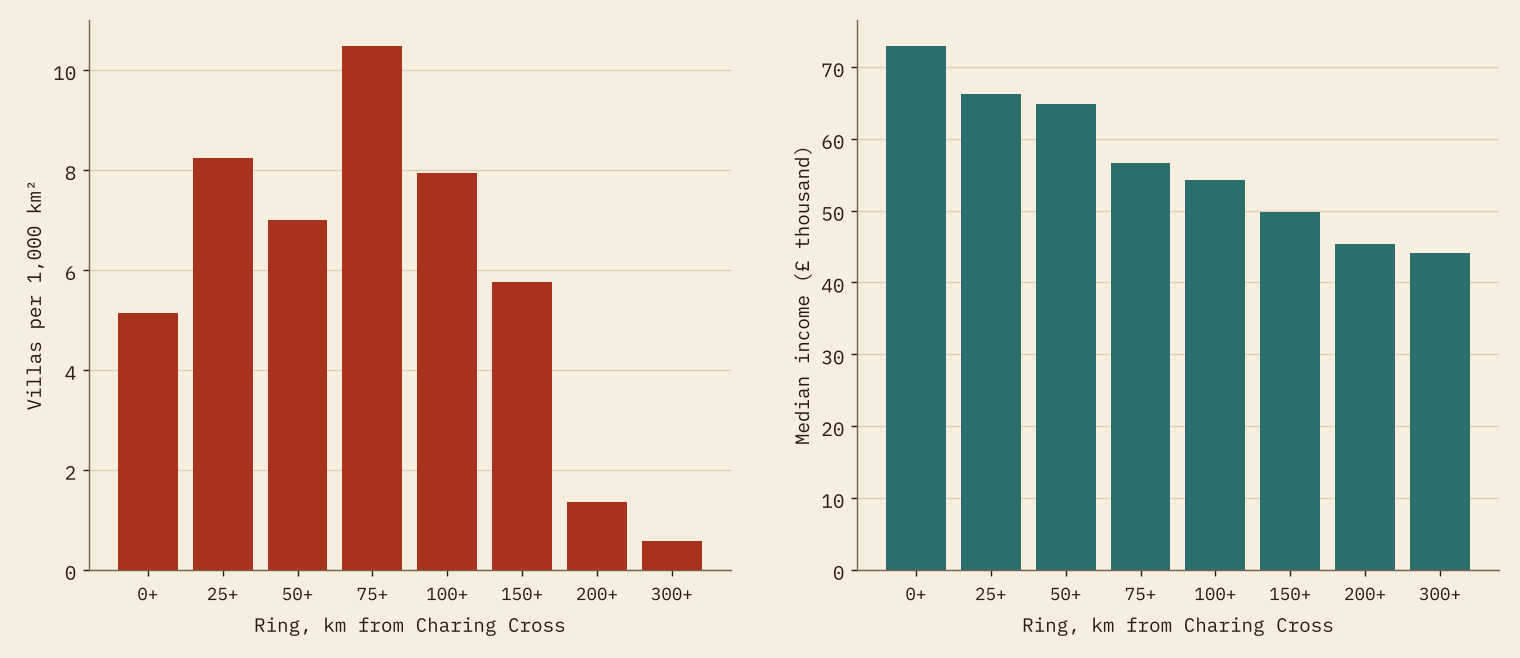
So the two belts overlap, but they are not the same belt. Villa country is the outer edge of commuter country and the farmland beyond it.
Compare like with like and the premium vanishes
To separate the villas from the geography I fitted a series of regressions, adding controls one block at a time. With no controls, villa neighbourhoods have incomes about 8.6% higher. Comparing only within the same region cuts that to 2.2%. Adding distance to London takes it to 0.5%. Then distance to Roman roads and towns, height, hilliness, the coast and how urban the area is leave 0.4%, and comparing only within the same local authority leaves 0.3%. None of these is distinguishable from zero.
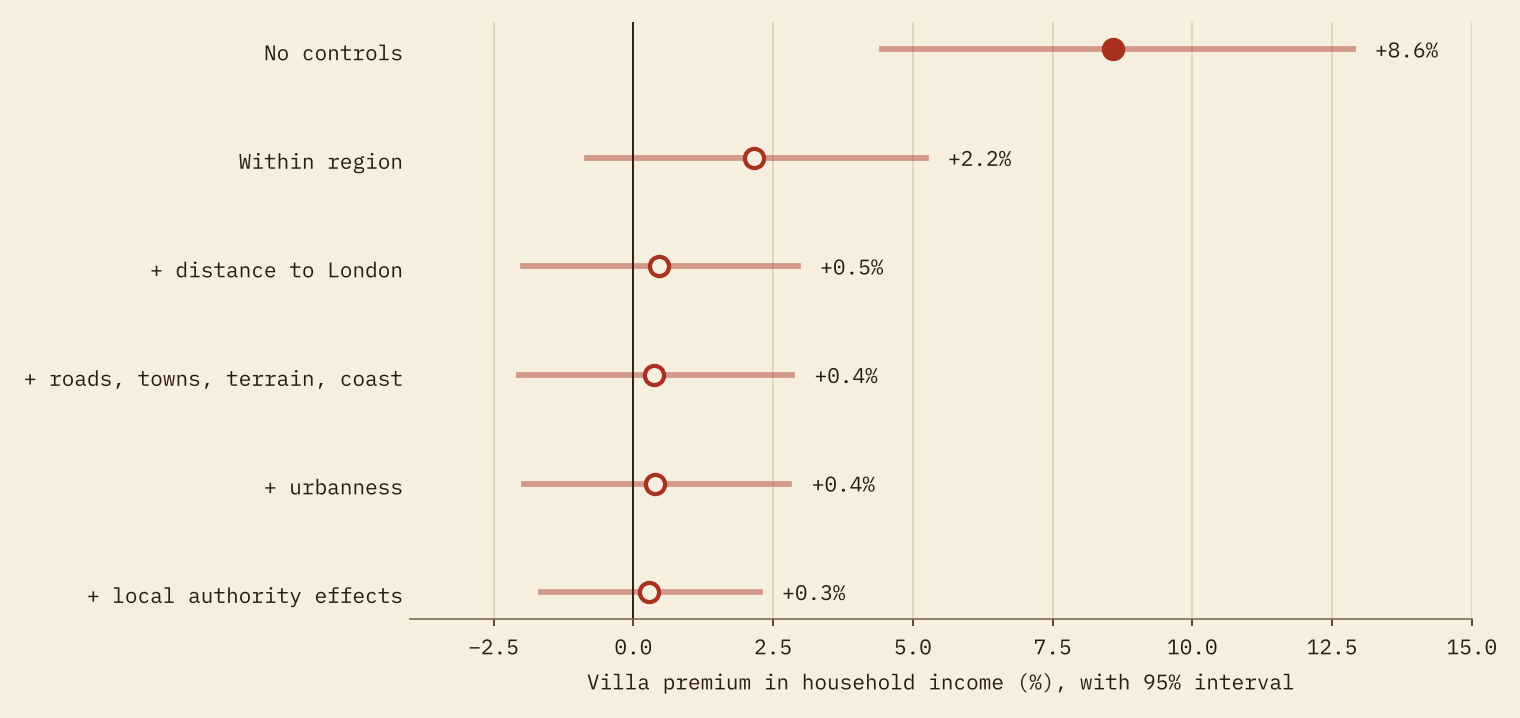
It holds when I change the rules: a 5 km radius, only the villas listed on Wikipedia, income after housing costs, London left out, or the three southern regions alone. The fully controlled premium stays between −0.4% and +1.5%. Roman forts show the mirror image. They sit mostly in the north and Wales, so neighbourhoods near them look 14% poorer at first, and that gap disappears too once the same controls go in.
A Roman villa nearby tells you which part of the country you are in. It does not tell you which street is rich.
Move the villas
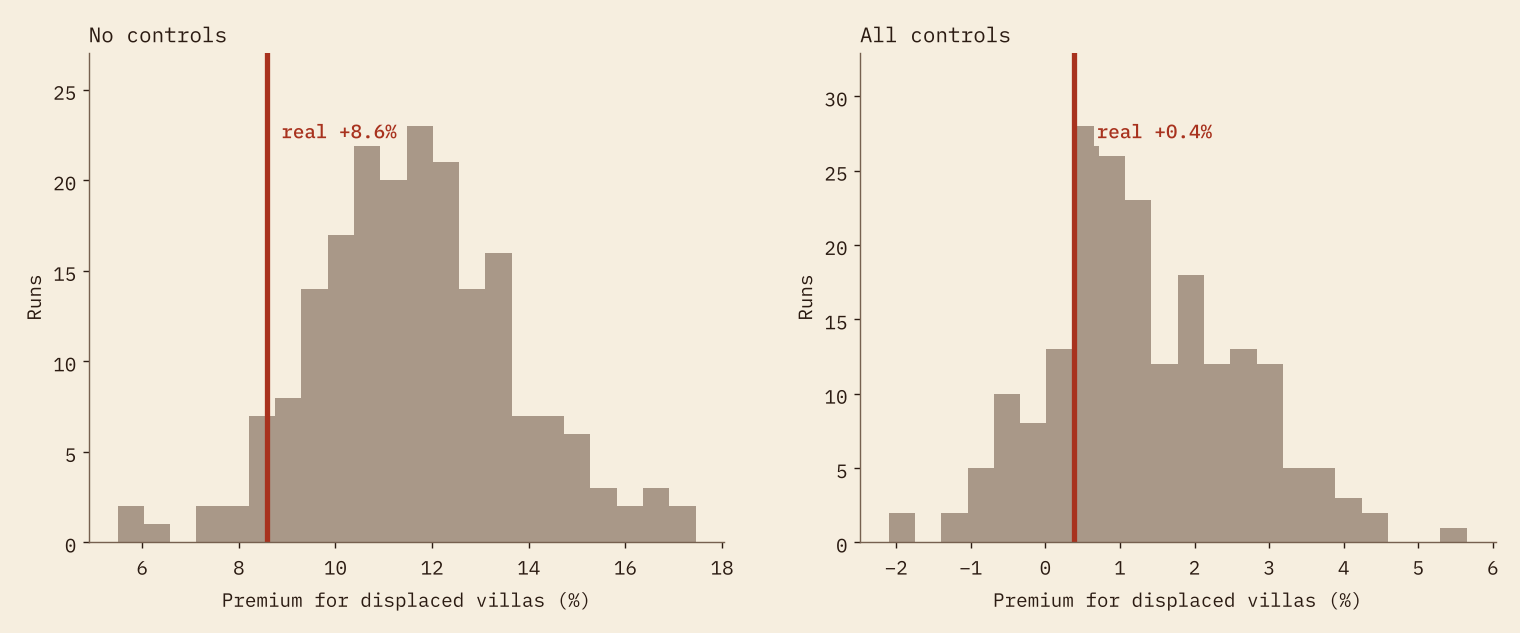
My favourite test is the bluntest. I picked up every villa and dropped it 5 to 15 km away in a random direction, always on land, and measured the “villa premium” again for the fake sites. I did that 200 times.
If the real sites marked something special about their exact spot, the fakes should do worse. They do not. The displaced villas show a median raw premium of 11.6%, and 94% of runs beat the real thing. Any spot within 15 km of a villa predicts income as well as the villa itself.
Districts, not streets
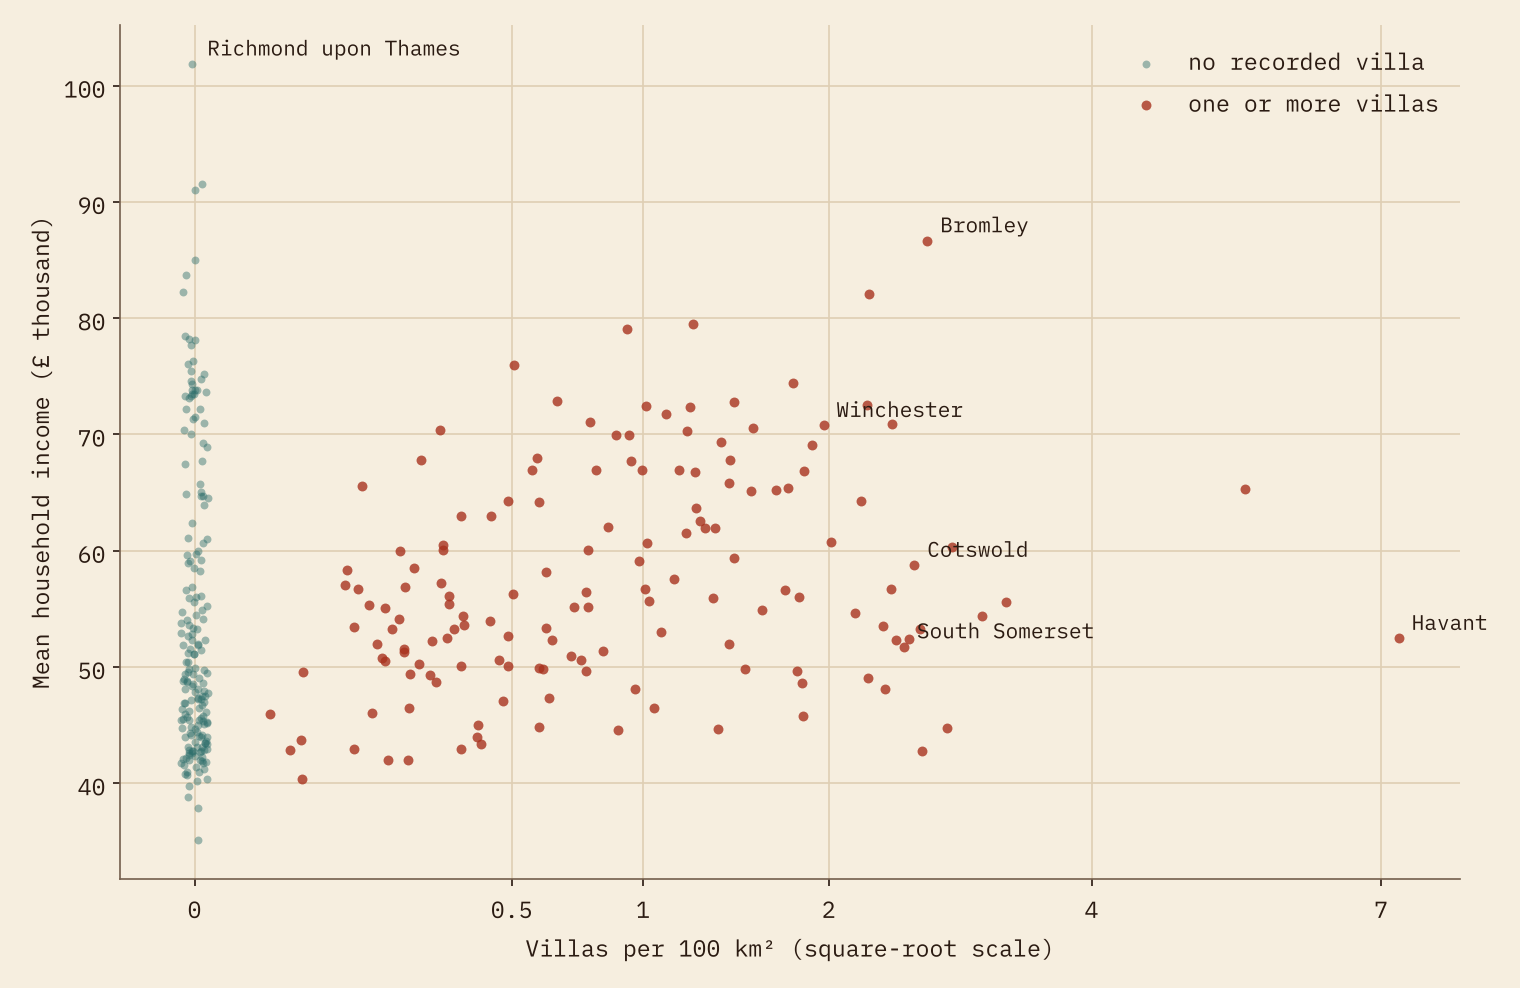
Zoom out to the 338 local authorities and there is a modest link: districts with more villas per 100 km² tend to be a little richer (a rank correlation of 0.27, and 0.21 after allowing for distance to London, population density and region). That fits the rest. Districts are big enough to capture broad differences in land and history; within a district, living next to the villa itself buys nothing.
The most villa-dense districts are a mixed bunch. Cotswold has the most villas, 30, and ranks 113 of 338 for income. South Somerset (186) and the Isle of Wight (260) are villa-rich but sit in the lower half. And 55% of authorities have no recorded villa at all, including Richmond upon Thames, the richest of them.
How I did this
I could not find a single open, downloadable list of Roman villas for England and Wales, so I built one. Wikipedia’s lists of villas in England and Wales give 500 rows with Ordnance Survey grid references, which I converted to coordinates. I added Roman villa items from Wikidata, archaeological sites named as villas in OpenStreetMap, and the villas in the Pleiades gazetteer, then joined records that lie close together or share a name. That leaves 617 villas, 332 of them confirmed by two or more sources.
Be clear about what that list is. It holds excavated and well recorded villas that have reached open sources, not every villa that existed. Recording is richer in the south and in well studied, heavily developed counties, which is one more reason not to trust the raw gap. Income is the ONS modelled estimate of mean household income for each MSOA in the financial year ending 2023. I had no open soil data, so height and hilliness stand in for land quality. Everything here is correlation, not causation.
Notes and sources
- Villas: Wikipedia, List of Roman villas in England and List of Roman villas in Wales (CC BY-SA 4.0); Wikidata (CC0); OpenStreetMap contributors (ODbL); Pleiades (CC BY 3.0).
- Income: Office for National Statistics, Income estimates for small areas, England and Wales, financial year ending 2023. Census 2021, MSOA centroids and Built-up Areas: ONS. Open Government Licence v3.0.
- Roman roads: Itiner-e. Elevation: AWS Terrain Tiles.
- Companion study: Is Domesday Destiny?
- Paper, data and code: Zenodo and GitHub.
- I wrote the text, with drafting and editing assistance from Claude (Anthropic), which also helped prepare the analysis code. I reviewed and checked all text and results.

