
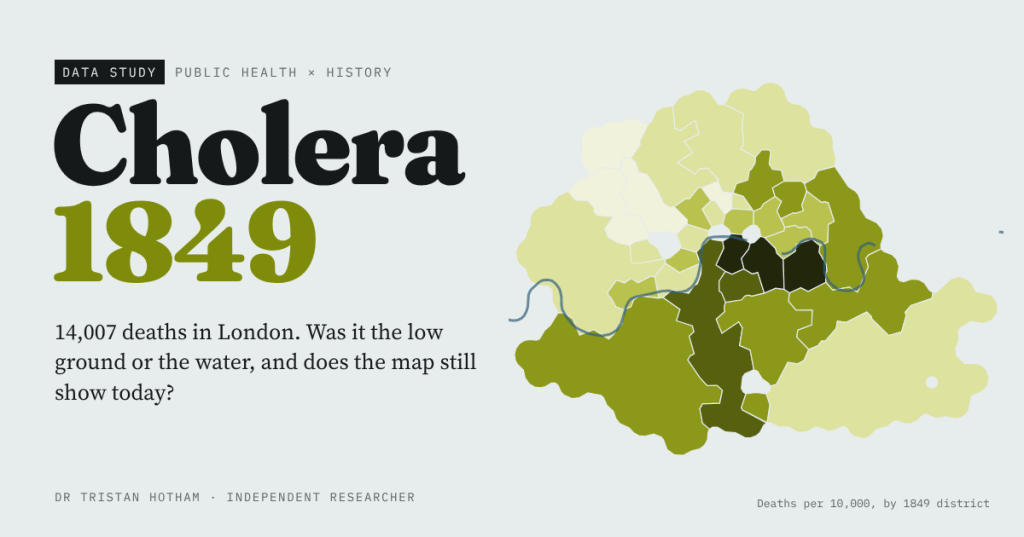
In 1849 cholera killed 14,007 people in London. William Farr blamed the low ground and John Snow blamed the water. I rebuilt both arguments from their own tables, measured every death on Snow’s Broad Street map, and asked whether the worst-hit districts are still the poorest today.
The maps that made modern public health are, at heart, maps of who died where. Cholera reached England and Wales in 1848, and over two years about 52,000 people there died of it. In London it fell with brutal unevenness. In Rotherhithe, on the low south bank of the Thames, 205 of every 10,000 people died in 1849. In Hampstead, up on its hill, 8.
Two men read that pattern in opposite ways. William Farr, the statistician at the General Register Office, laid the deaths out district by district and found that the higher the ground, the fewer the deaths. He took it as a sign of bad air rising from the riverside soil. John Snow, a doctor, thought cholera was something people swallowed, and that the low districts were simply the ones drinking the Thames. Their figures survive, and volunteers and researchers have typed them up and shared them openly. So I put them side by side.
A map of a bad summer
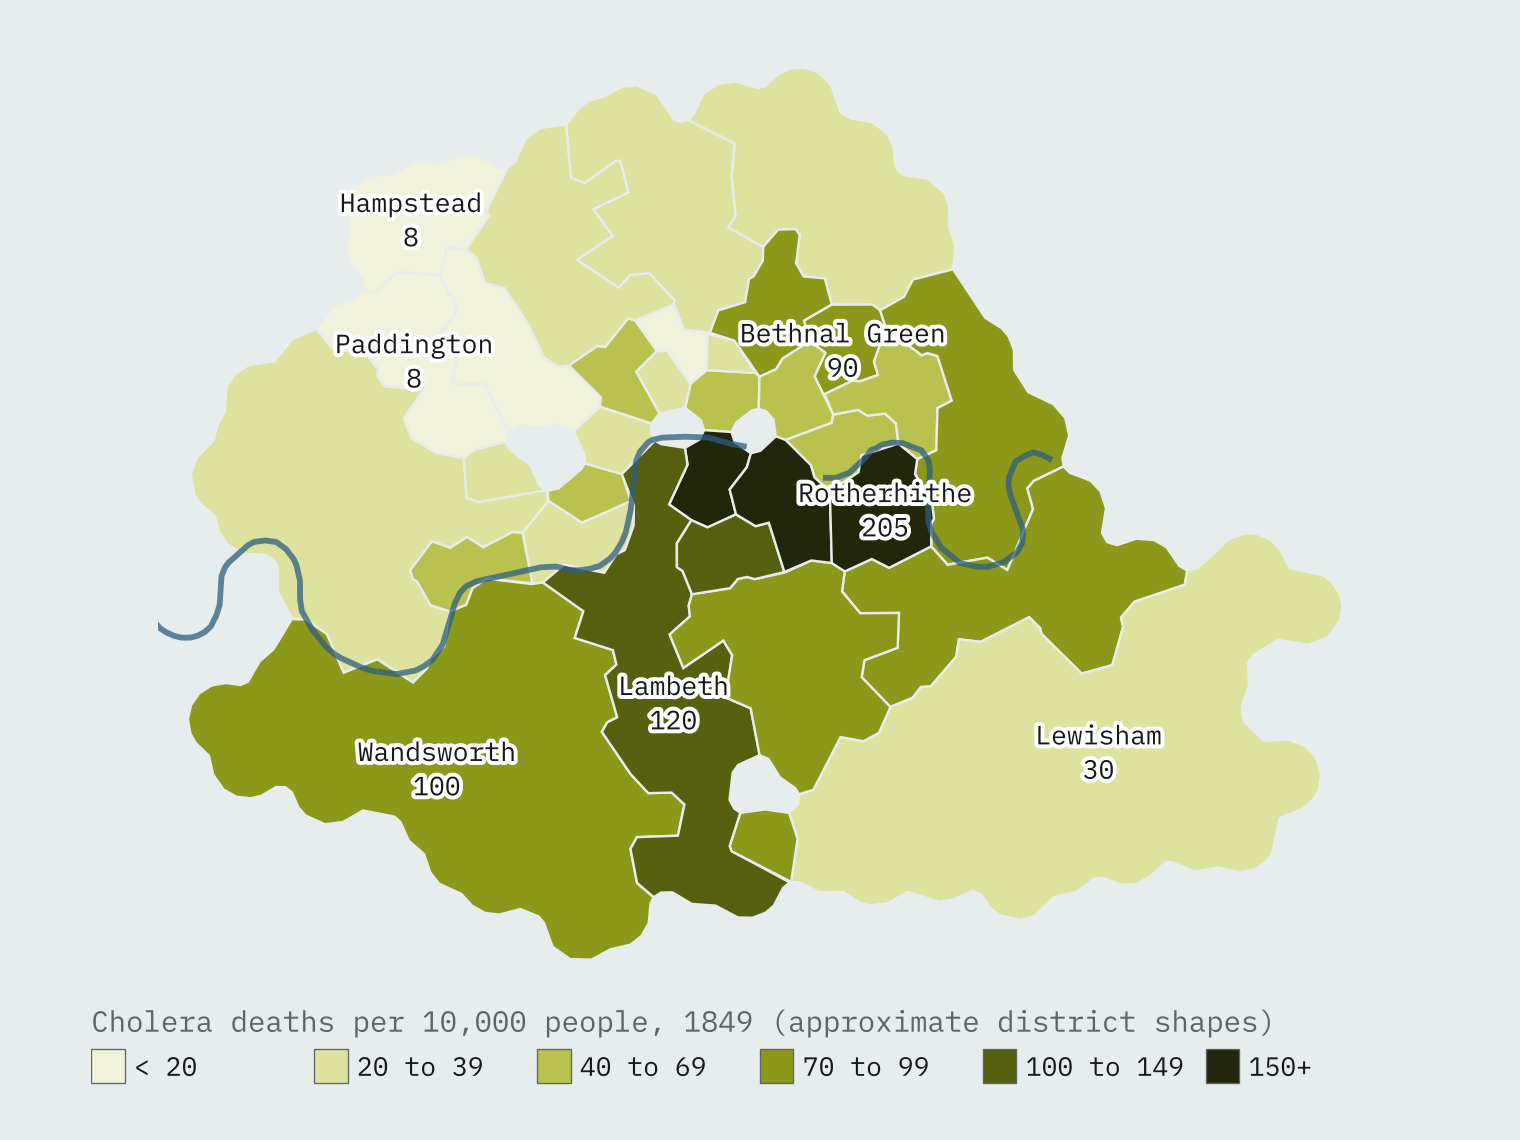
Farr’s 38 districts recorded 14,007 cholera deaths among 2,278,925 people. The dark heart of the map is the south bank between London Bridge and Rotherhithe: Rotherhithe, St Olave, Bermondsey, St George Southwark and St Saviour all lost more than 150 people in every 10,000. The worst district had 26 times the death rate of the best.
Farr was right about the pattern
Farr’s table gives each district’s height above the Thames high-water mark, and his law holds up beautifully. The rank correlation between height and death rate is -0.81. The 16 districts below 20 feet lost 91.7 people per 10,000; the two at 100 feet or more lost 16.3.
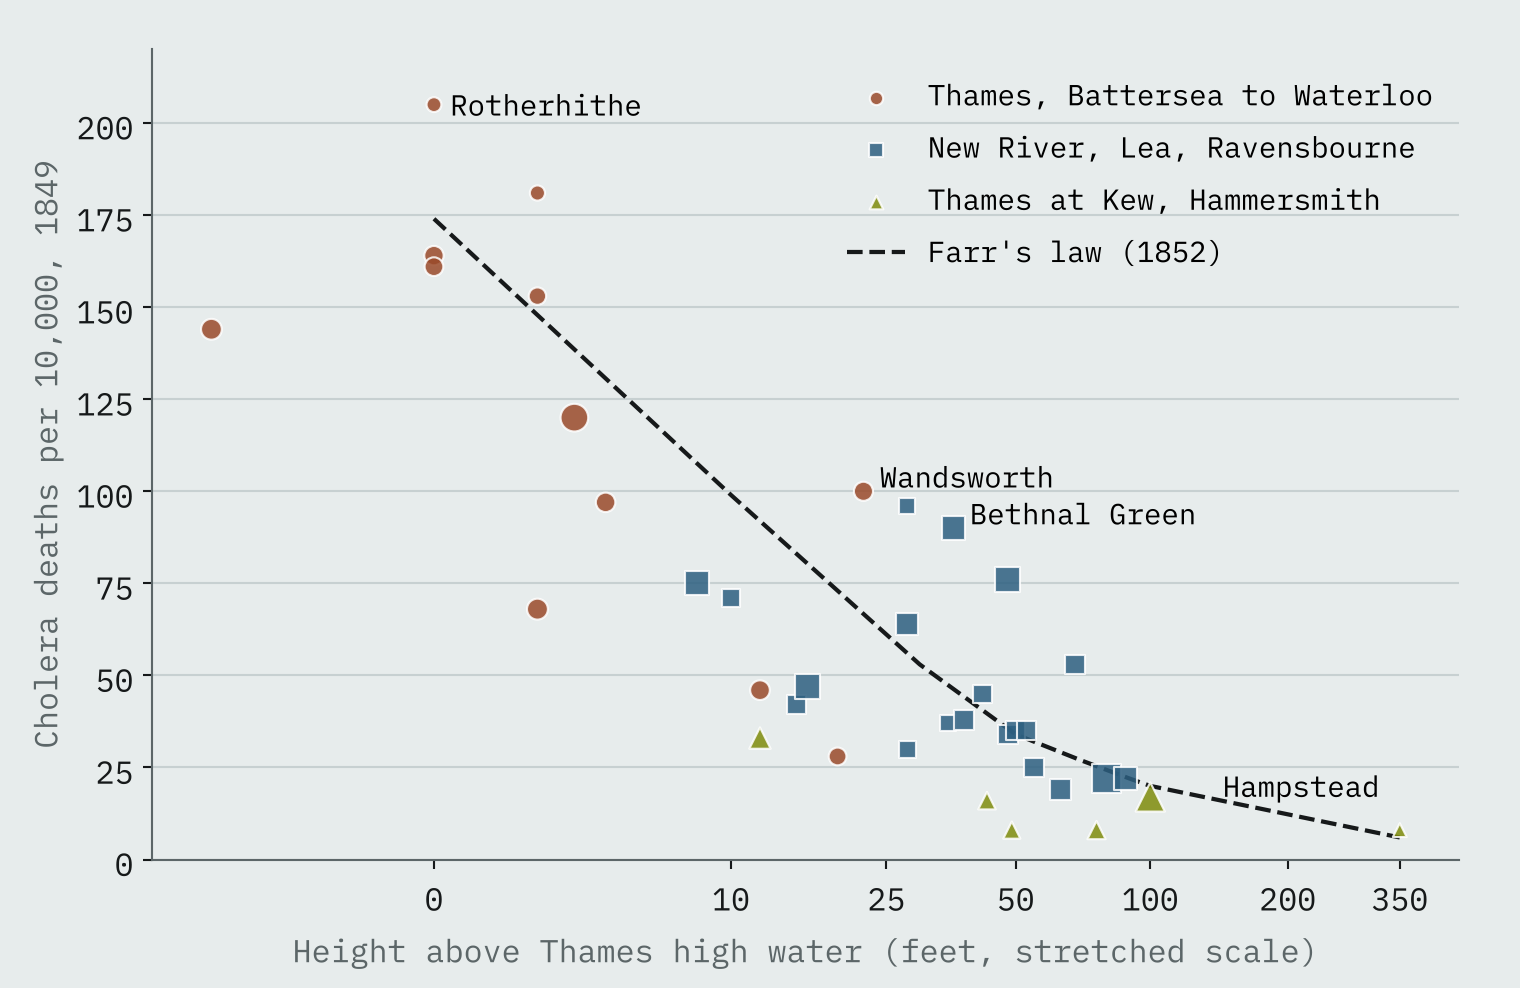
But look at the colours. The twelve districts drinking Thames water drawn between Battersea and Waterloo Bridge were all low, none higher than 22 feet, and they lost 114.4 people per 10,000. Districts supplied from the Thames upstream at Kew and Hammersmith lost 17.8. Height and water went together, and Farr’s table cannot pull them apart: height alone explains 63% of the variation in death rates, water alone 58%, the two together 75%.
Same streets, different water
The answer came from south London, where two water companies, the Southwark and Vauxhall and the Lambeth, served the same districts house by house. By 1854 the Lambeth company was drawing its water from further up the Thames at Seething Wells. The Southwark and Vauxhall was still drawing from a stretch fouled by sewage.
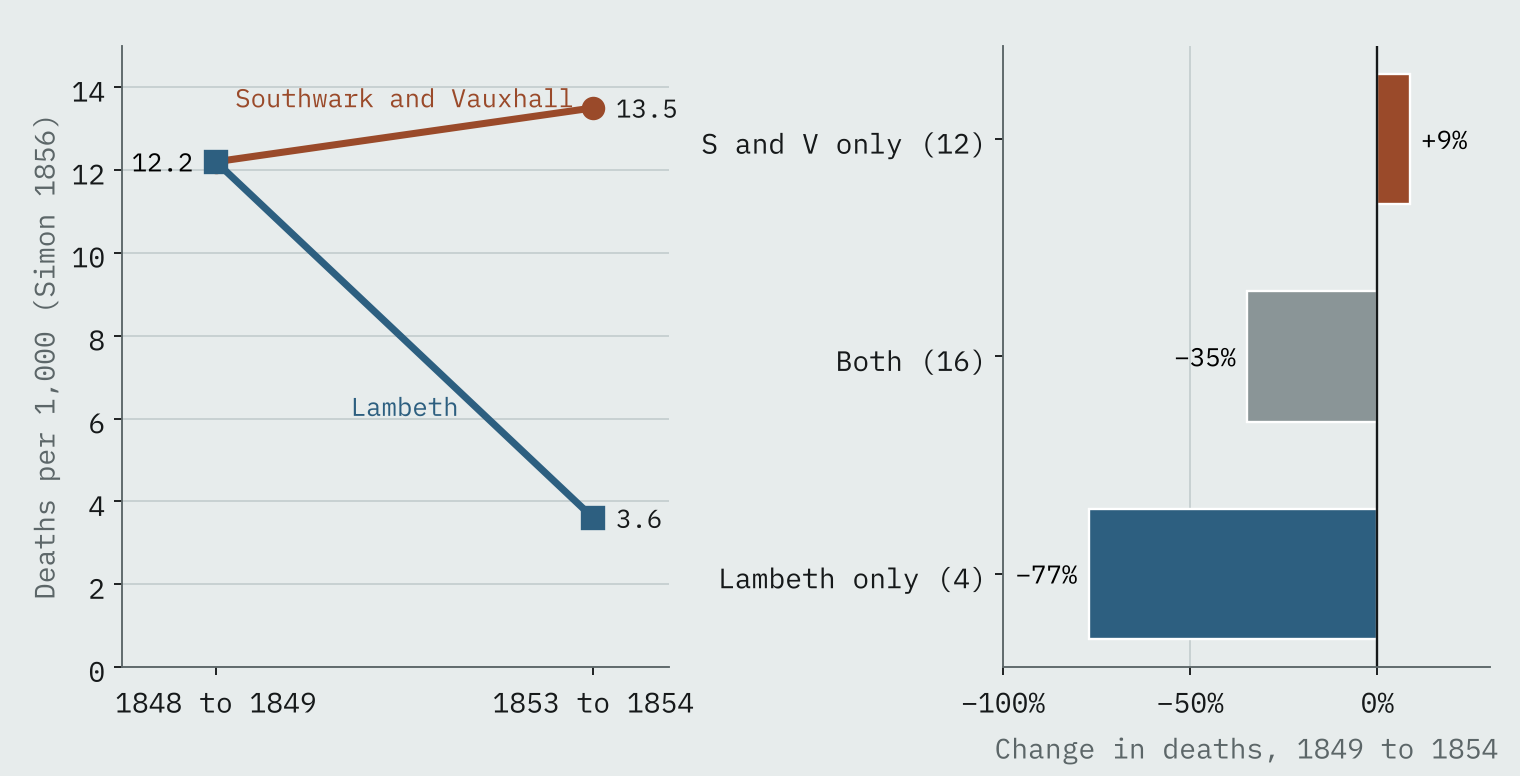
In 1849 the two companies’ customers died at the same rate, 12.2 per 1,000. In 1854 Southwark and Vauxhall customers died at 13.5 per 1,000 and Lambeth customers at 3.6. The houses had not moved and the ground had not risen. Only the water had changed.
The houses had not moved and the ground had not risen. Only the water had changed.
Broad Street, street by street
At the end of August 1854 cholera exploded around Broad Street in Soho. Snow marked every death on a map, and that map has since been digitised and pinned to modern coordinates. Half of its 578 deaths were within 117 metres of the Broad Street pump. Walking along the streets, 65% of them were closer to that pump than to any other.
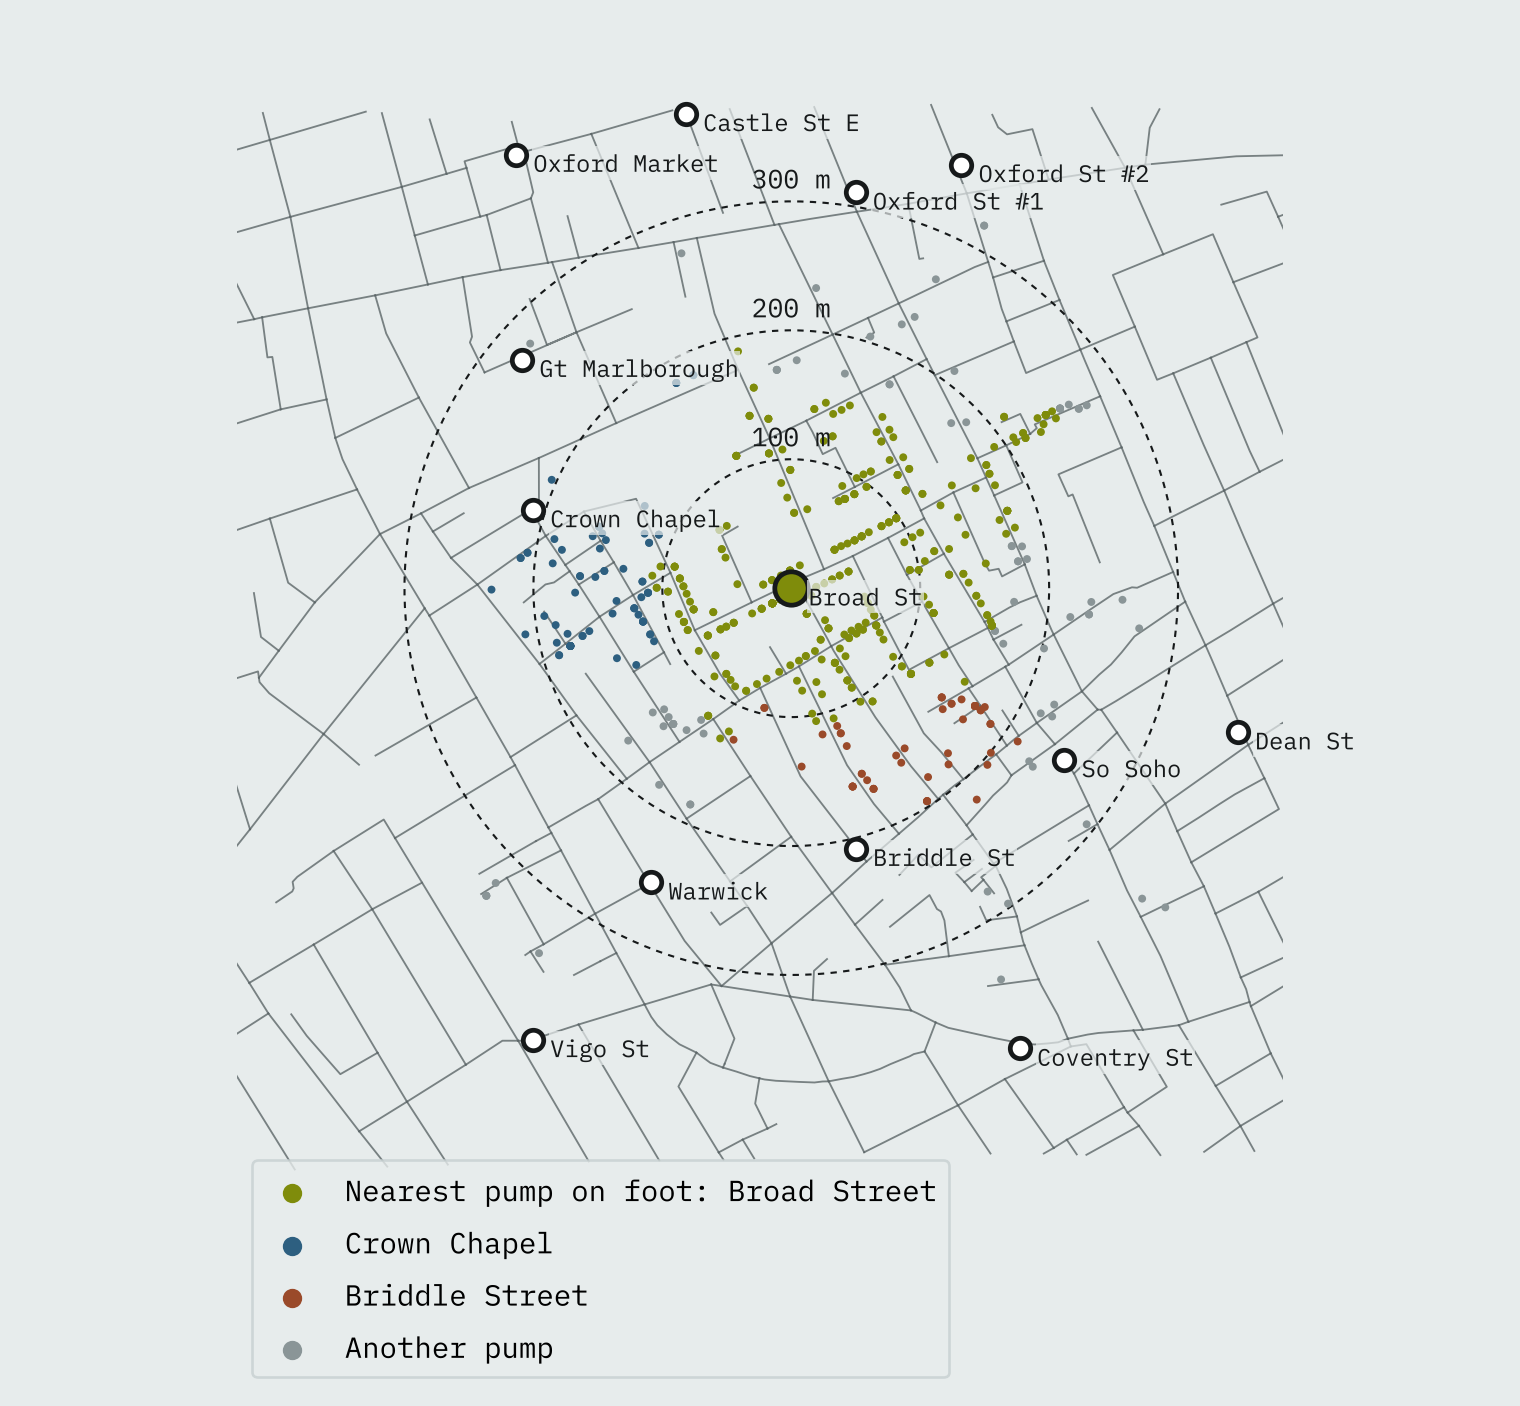
My measure puts 203 deaths nearer to another pump, many only just. Snow, who walked these streets, counted only 10 deaths in houses “decidedly nearer” another pump, and found that 5 of those families always sent to Broad Street because they liked its water better, and 3 were children who went to school near it. A map gives you geometry. The case was made on doorsteps.
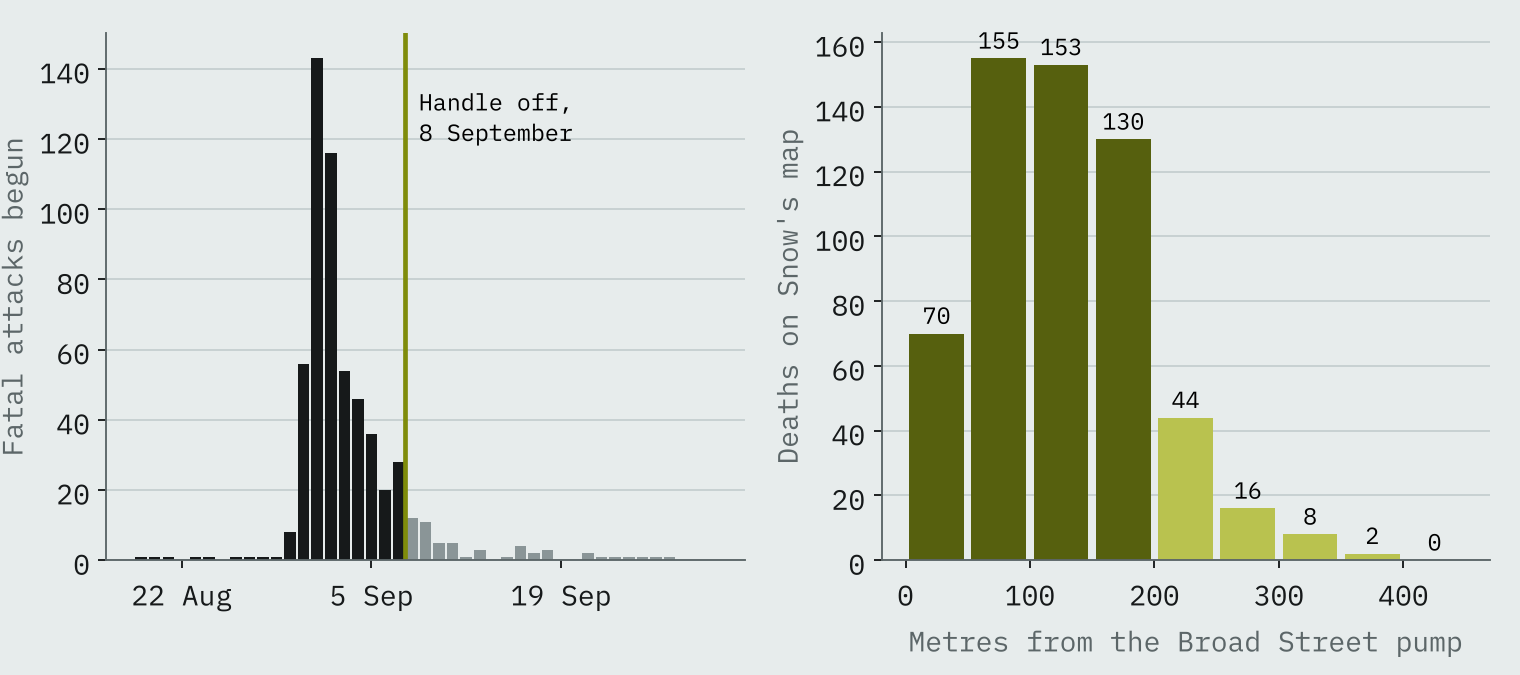
The famous handle came off on 8 September. By then the outbreak had already turned: 315 fatal attacks began between 31 August and 2 September, and only 28 on 7 September. Snow himself wrote that the attacks had fallen so far before the handle came off that it was impossible to decide whether the well was still dangerous.
Does 1849 still show?
Then the question I most wanted to answer. Are the districts that suffered worst in 1849 still the poorest parts of London? I gave each of today’s small areas to the 1849 district whose named places lie nearest, on the same side of the river, which gives 31 areas covering 2,981,956 people, and compared them with ONS income estimates for 2023.
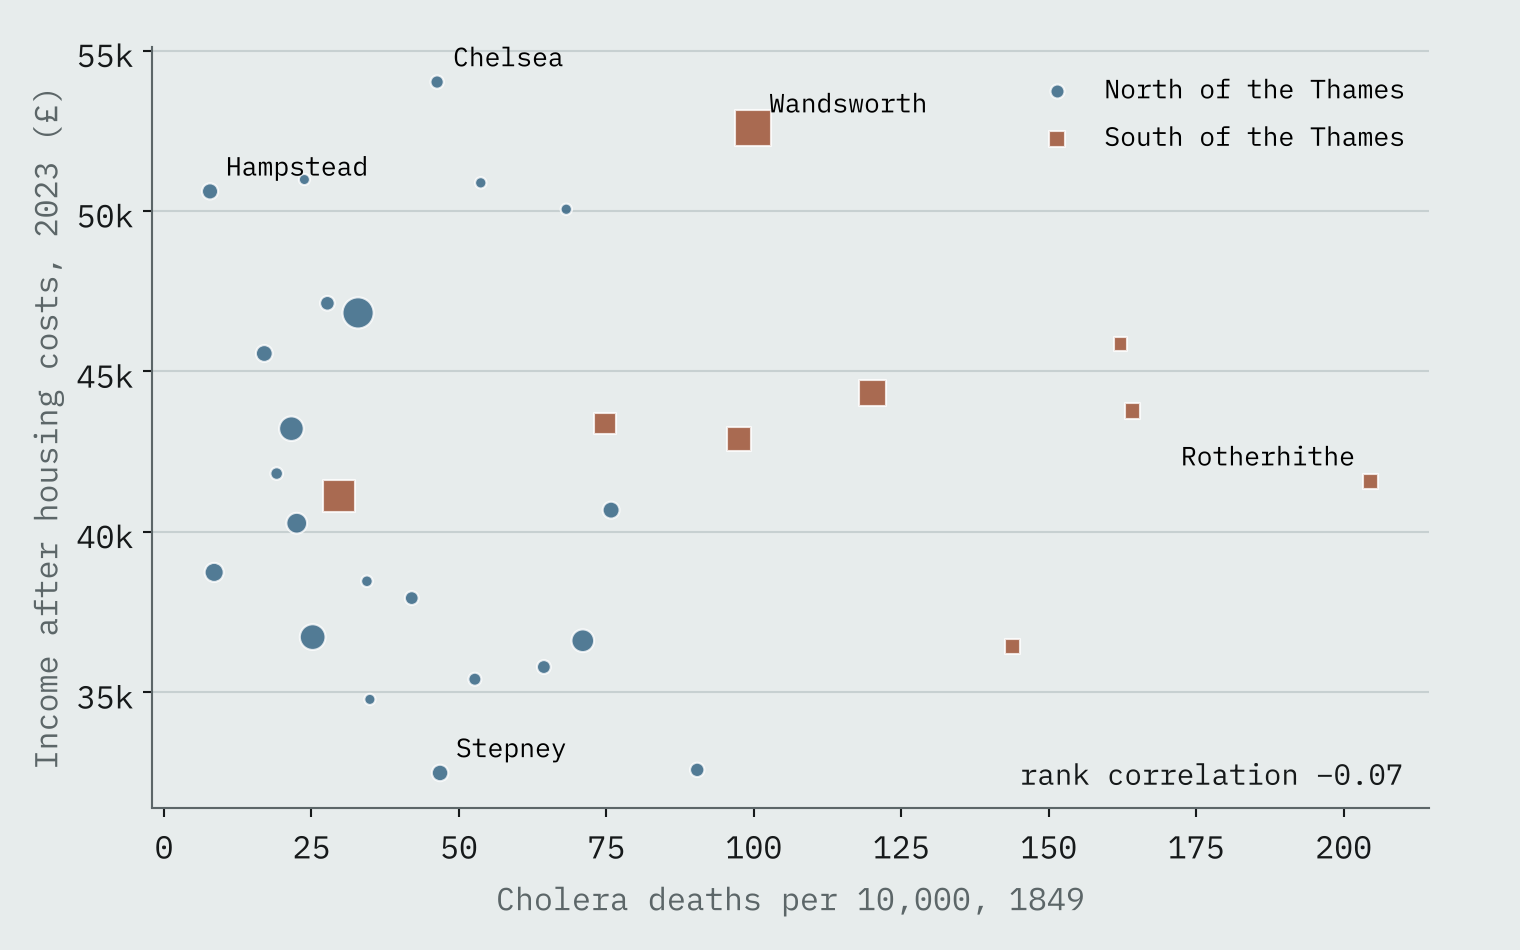
They are not. The rank correlation is -0.07, which is nothing at all. The eight worst-hit areas of 1849 now average £46,700 a year after housing costs, and the eight least hit £41,200. Wandsworth, where 99.9 in 10,000 died, now has the second highest income of the 31 areas.
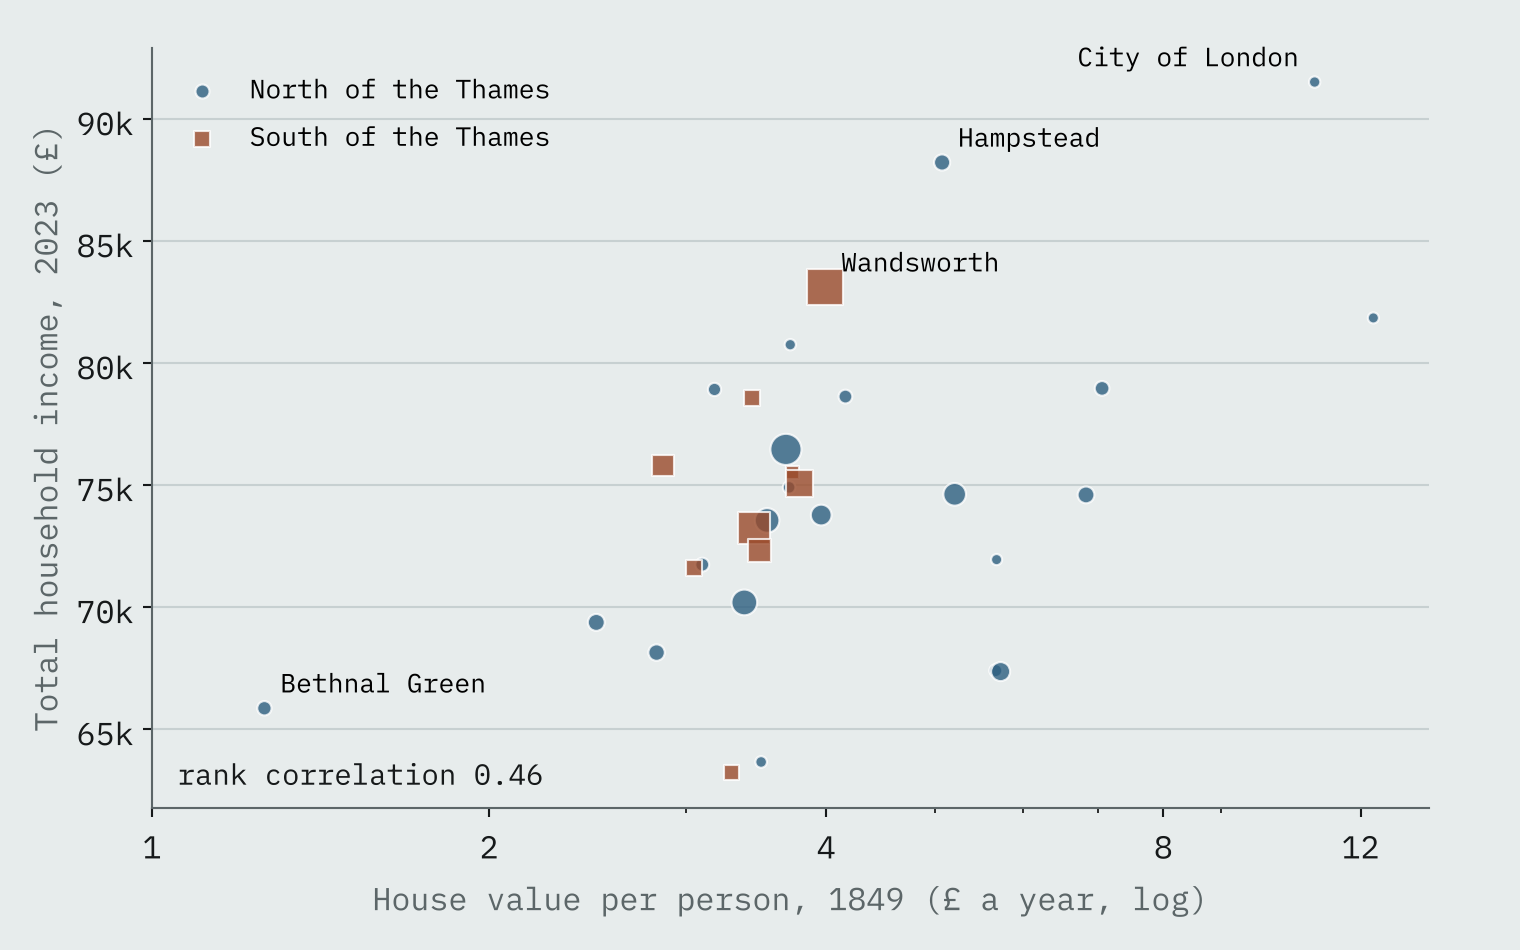
Something older does persist, though. Farr also recorded the value of houses per person, a rough guide to how well off a district was. That lines up with household income today, with a rank correlation of 0.46. Bethnal Green had the cheapest housing per head in 1849 and has the second lowest income after housing costs now. Cholera’s map has faded. The map of who could afford what has not.
How I did this
Farr’s district figures come from his 1852 report as tabulated by Bingham, Verlander and Cheal (2004) in the HistData R package. The south London water company tables are Thomas Coleman’s transcriptions of Snow (1855) and Simon (1856). Snow’s map, digitised by Rusty Dodson and Waldo Tobler, is georeferenced in Peter Li’s cholera R package; I measured walking distances along its streets. Income is the ONS small area estimate for the financial year ending 2023, weighted by Census 2021 population.
The weak point is the link between 1849 and today. I could not find an open boundary file for the 1849 districts, so I placed each one by named places from OS Open Names and merged ten small central districts into three areas. The shapes are approximate, and with 31 areas only strong links would show. I also looked for an open copy of Farr’s table for all of England and Wales, and did not find one, so this is a London story.
Notes and sources
- Farr’s 1849 district table and daily deaths: HistData R package (GPL), from Bingham, Verlander and Cheal (2004), Public Health 118(6), and Farr (1852), Report on the Mortality of Cholera in England, 1848-49.
- Snow (1855) and Simon (1856) water company tables: Thomas Coleman, SnowCholera (BSD 2-Clause).
- Snow’s Broad Street map: Peter Li, cholera R package (GPL), from the digitisation by Rusty Dodson and Waldo Tobler.
- Income and population: Office for National Statistics, income estimates for small areas, FYE2023, and Census 2021 (Open Government Licence v3.0). Named places and the Thames: OS Open Names and OS Open Rivers (contains OS data © Crown copyright and database right 2026).
- Background: Wikipedia articles on John Snow, William Farr and the 1854 Broad Street cholera outbreak (CC BY-SA 4.0).
- Paper, data and code: Zenodo and GitHub.
- I wrote the text, with drafting and editing assistance from Claude (Anthropic), which also helped prepare the analysis code. I reviewed and checked all text and results.

