
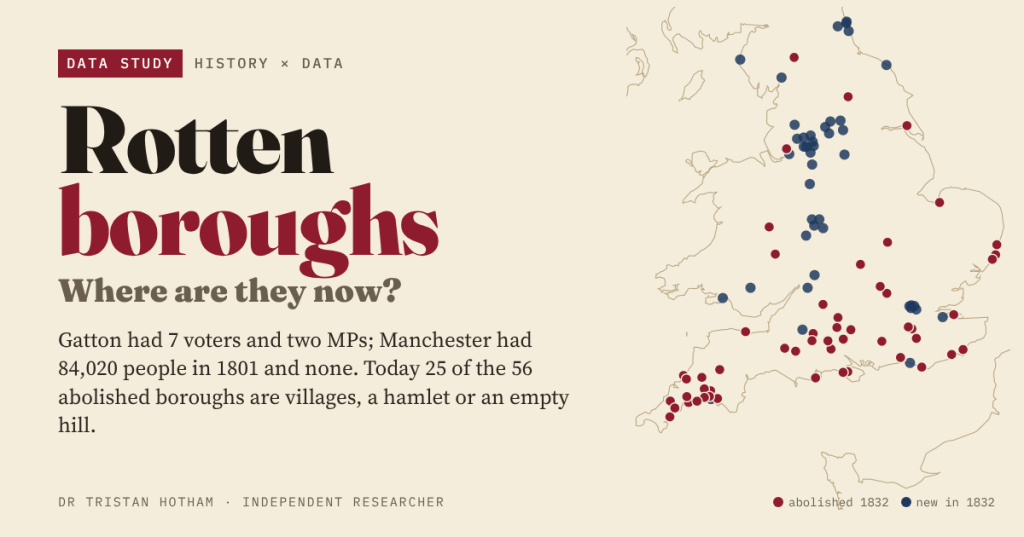
Before 1832, a grassy hill near Salisbury sent two MPs to Westminster and Manchester sent none. The Great Reform Act swept away 56 of these rotten boroughs. I mapped every one of them, and every town that took their seats, to see what became of them.
Anyone who did British history at school has probably met Old Sarum. At the general election of 1831 it returned two Members of Parliament. It had 11 voters, all landowners who lived somewhere else, and nobody living there at all: the medieval town had long since moved down the hill to become Salisbury. Gatton in Surrey had 7 voters. Dunwich in Suffolk, a once busy port that had mostly fallen into the North Sea, had 32.
Meanwhile Manchester, with 84,020 people at the 1801 census and the second largest town in England, had no MP of its own. Nor did Birmingham, Leeds or Sheffield. The Reform Act of 1832 was written to fix that. But the textbook story stops in 1832. I wanted to know where the rotten boroughs are now.
Out with the south, in with the north
The Act came with lists. Schedule A named 56 boroughs to lose both their MPs. Schedule B named 30 more to lose one of their two. Schedules C and D gave MPs to 43 towns that had never had their own. I placed every one of them using the Ordnance Survey’s gazetteer of place names, and the map tells the story at a glance.
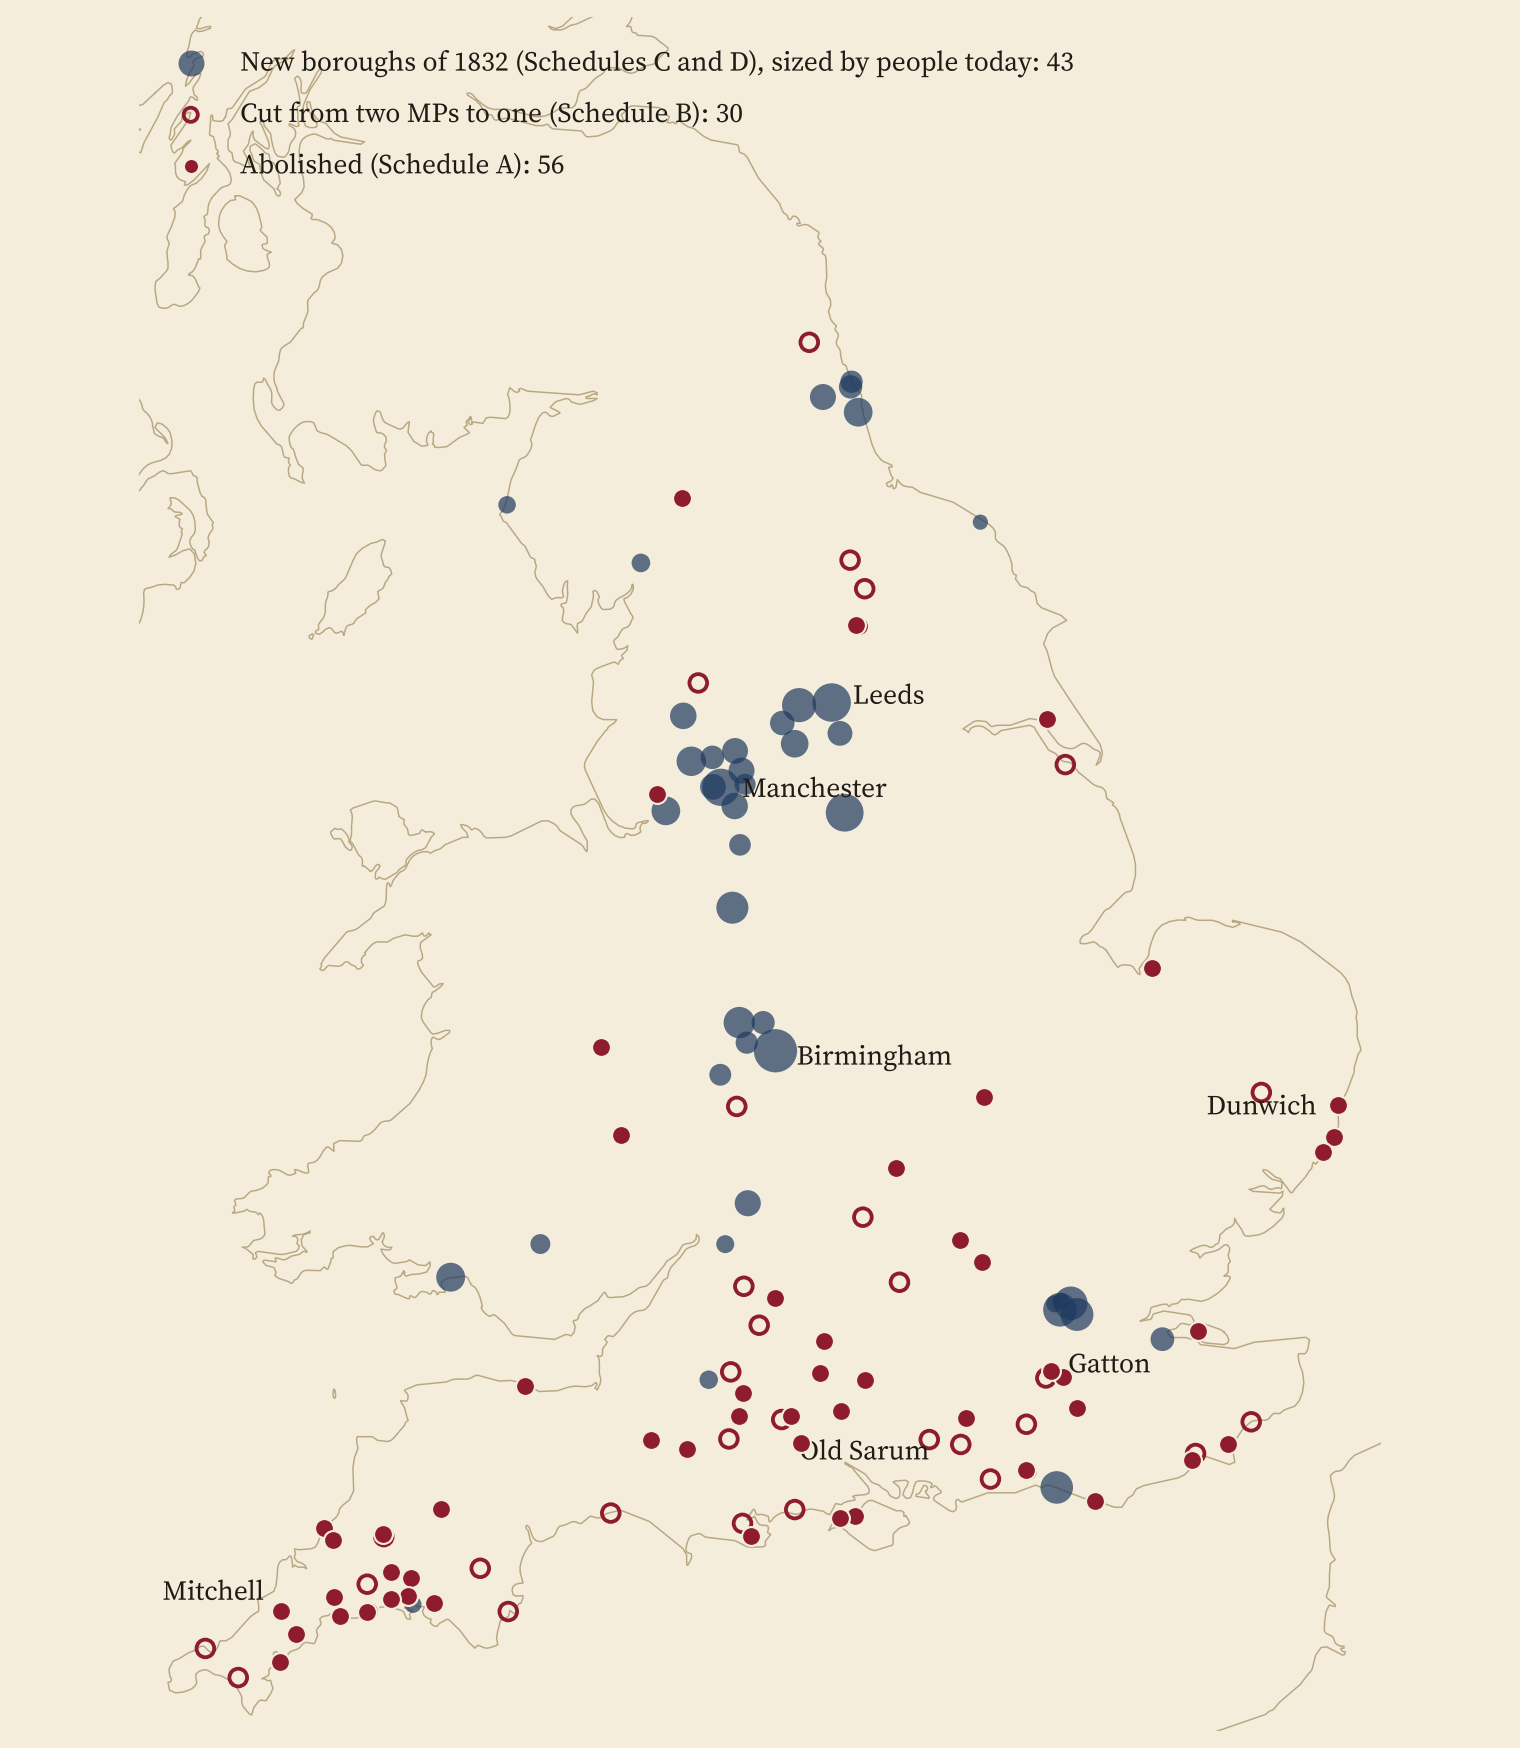
47 of the 56 abolished boroughs lie in today’s South West, South East and East of England. 32 of the 43 new ones lie in the North, the Midlands or Wales. Political weight moved about 254 km north in a single Act. The seat counts add up exactly as the Act intended: 143 borough seats removed and 65 new ones created.
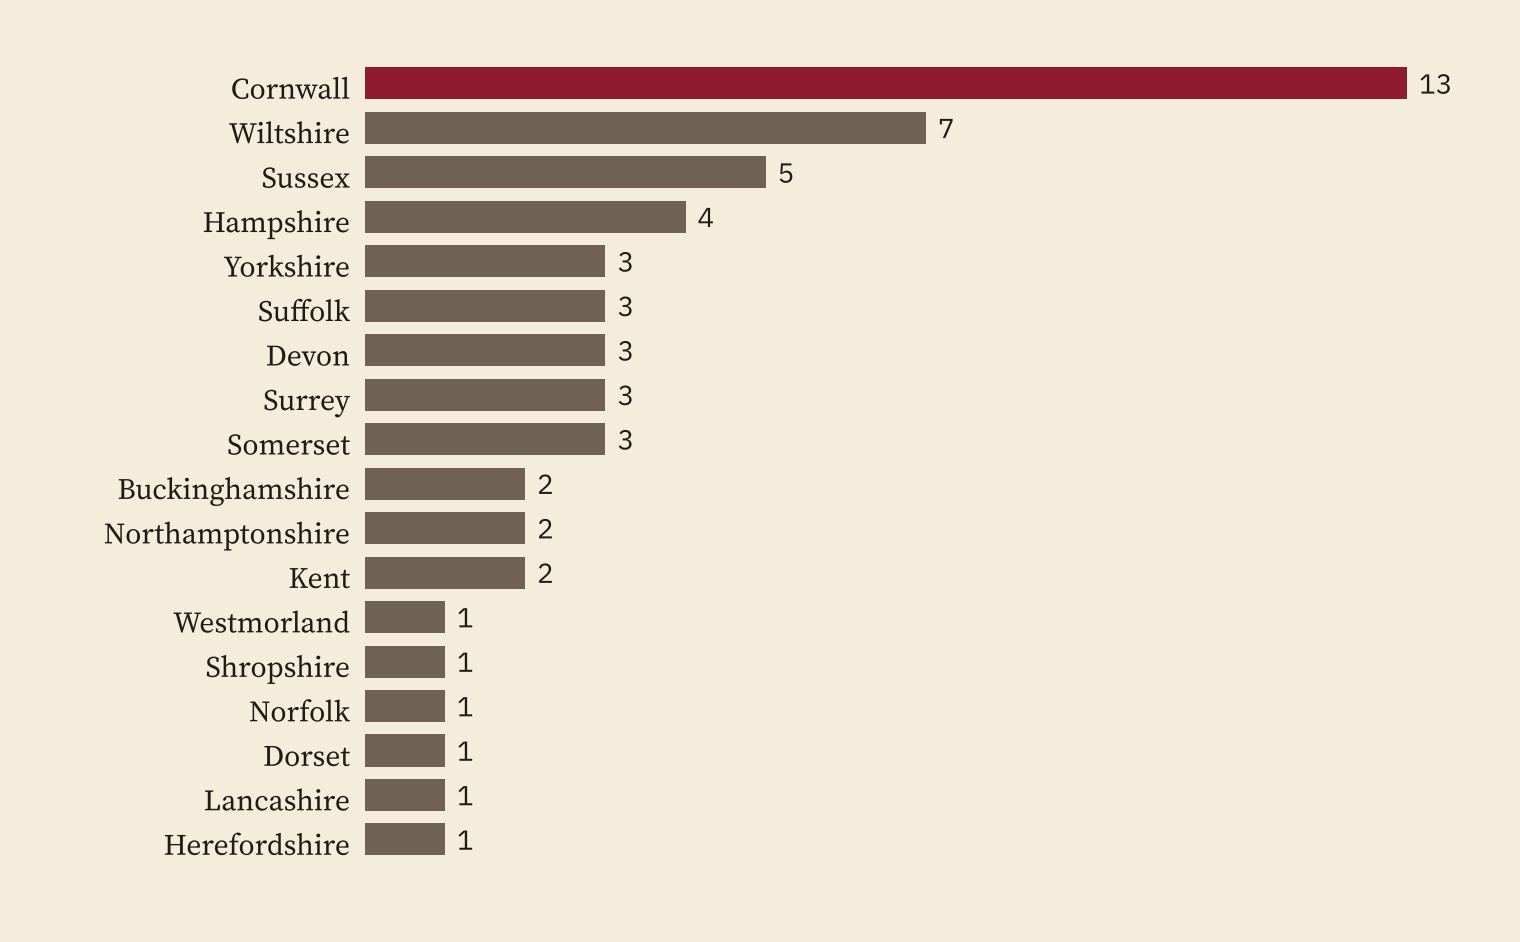
And no county lost more than Cornwall. 13 of the 56 abolished boroughs were Cornish, and Cornwall’s MPs fell from 44 to 14 at a stroke.
Seven voters, two MPs
How small were they really? There was no secret ballot and no electoral register, so the numbers are estimates, mostly from the History of Parliament as quoted on Wikipedia. I found an 1831 electorate for 34 of the 56 abolished boroughs. The median had 39 voters. 7 had fewer than 20. Gatton, Mitchell and St Germans had 7 each.
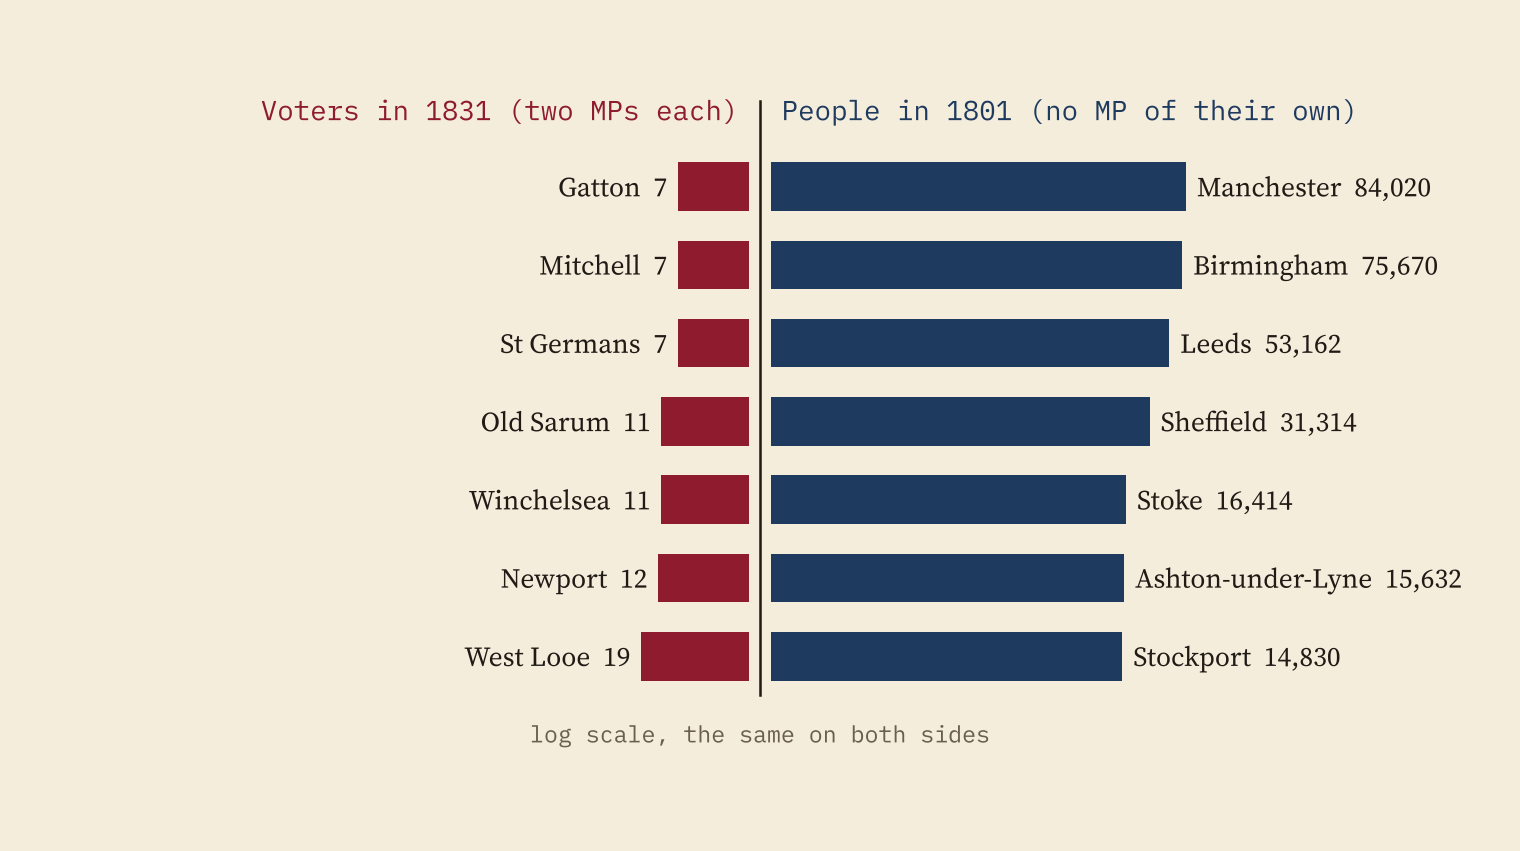
On the other side of the ledger, 12 of the 30 biggest towns in England in 1801 had no MP of their own until 1832. Together they held 352,572 people. The 41 rotten boroughs with an 1831 population held just 35,753 between them, and returned 81 MPs.
Two MPs for 7 voters at Gatton; none for 84,020 people in Manchester.
Where are they now?
Here is the part I had never seen answered. The Ordnance Survey classes every populated place as a city, town, village, hamlet or suburb. Of the 56 abolished boroughs, 27 are towns today and 23 are villages. Newtown on the Isle of Wight is a hamlet. 4 have been swallowed by bigger places: East and West Looe are the two halves of Looe, Newport is part of Launceston and Plympton Erle is a suburb of Plymouth. And Old Sarum is still an empty hill.
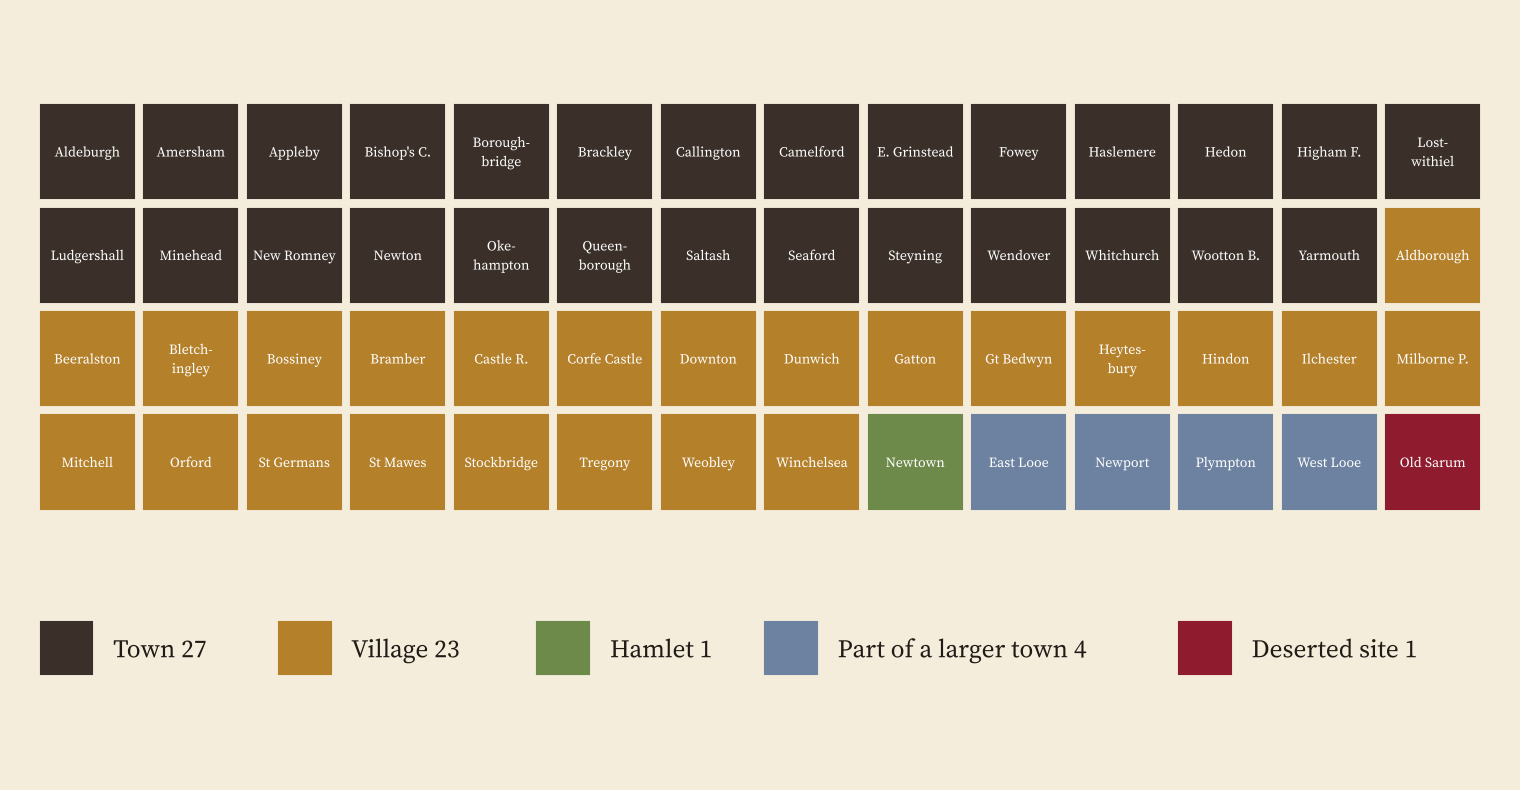
One small trap: the Ordnance Survey does list a village called Old Sarum, but it is a new housing estate about 1.4 km from the hill. I kept the borough on the hill.
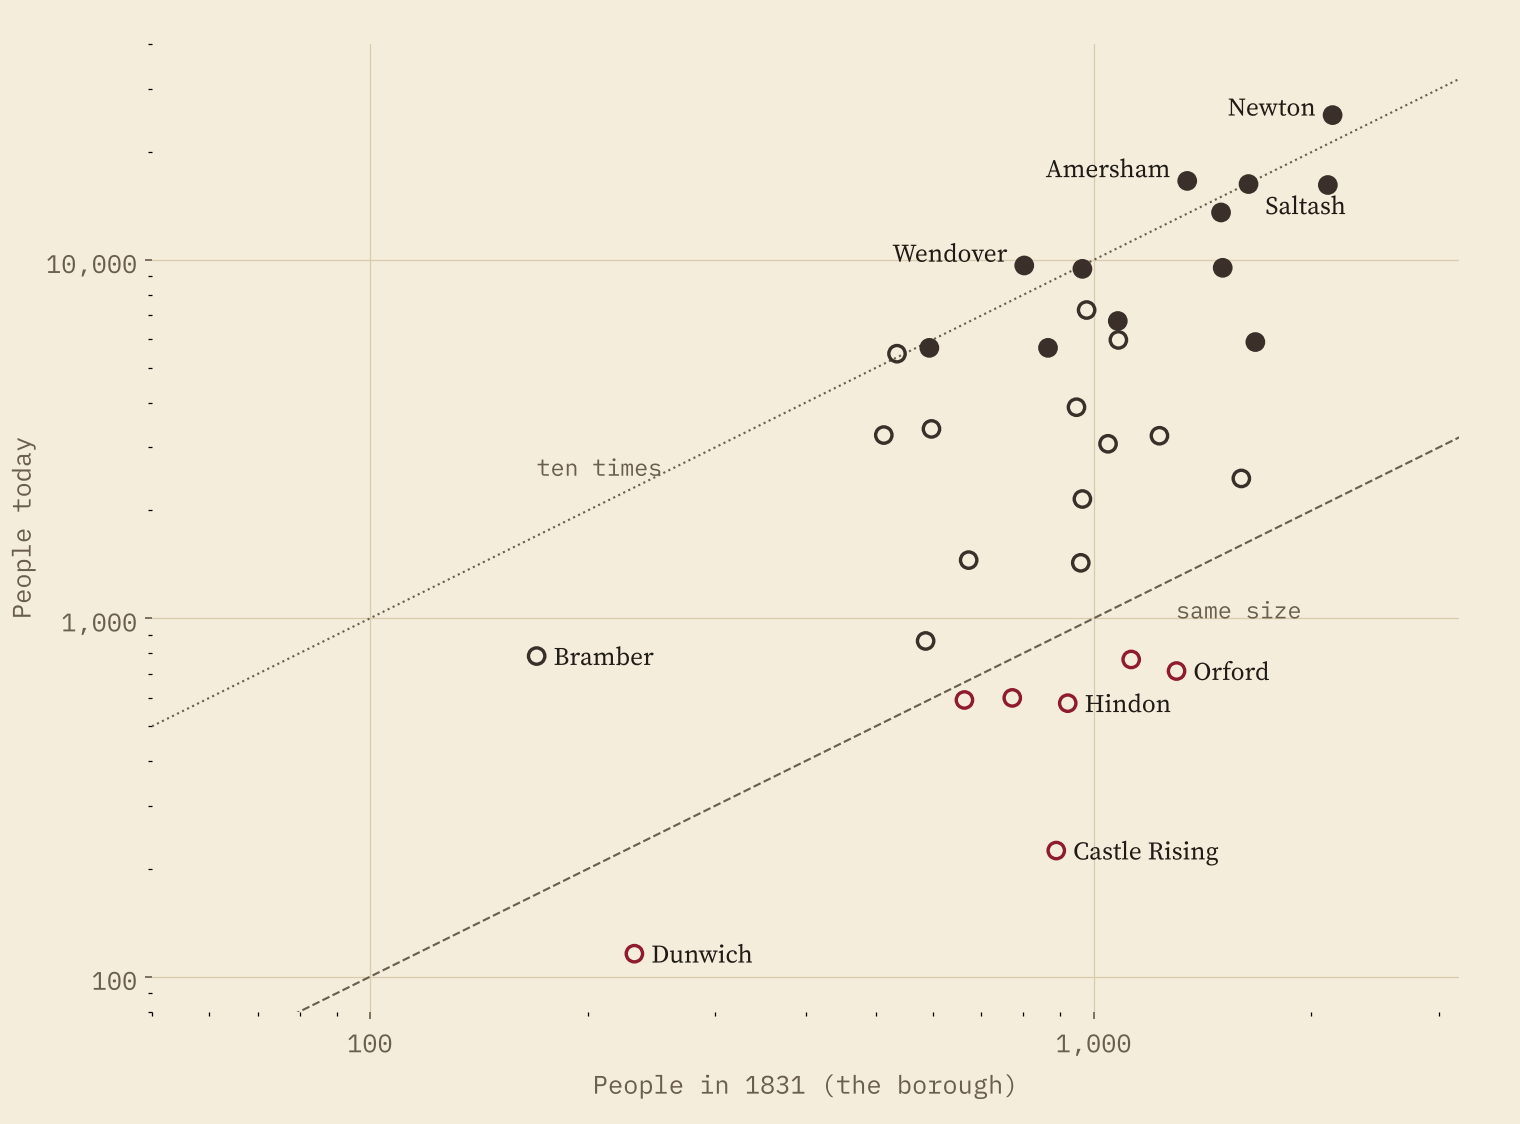
Most of them grew. For 33 boroughs I can set the 1831 census beside a figure for today, and the median grew 4.6 times. Amersham went from 1,347 people to 16,618, Wendover from 802 to 9,653. But 7 have fewer people now than in 1831, including Castle Rising, Orford, Winchelsea and, of course, Dunwich, whose parish has 116 people today.
Richer or poorer than their neighbours?
Last, money. I compared each place’s mean household income (ONS estimates for 2022 to 2023) with the area 5 to 25 km around it. The rotten boroughs come out dead level with their neighbours: a median difference of 0.0%, with 26 of 56 richer. The new boroughs of 1832 are clearly poorer than the country around them: median -4.8%, and only 10 of 43 richer.
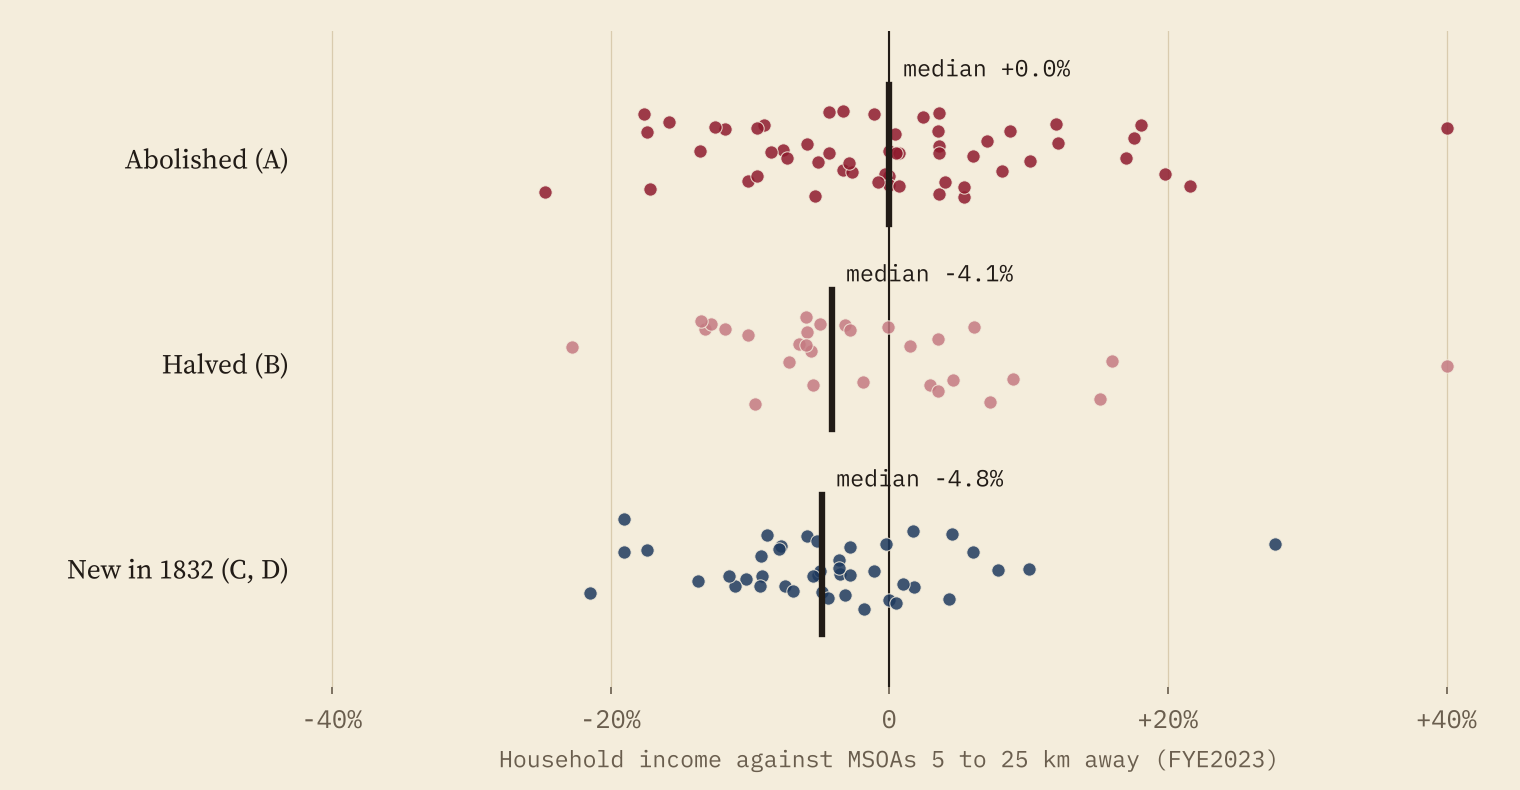
29 of the 56 abolished boroughs have a household income above the median for England and Wales, against 9 of the 43 new boroughs. The industrial towns that took the rotten boroughs’ seats became the big, and on average poorer, places of modern England. The rotten boroughs mostly became comfortable small towns and villages. This is a description, not a cause: nobody got richer or poorer because of the Reform Act.
How I did this
The lists of boroughs come from Wikipedia, checked against each other, and the seat counts reproduce the Act’s totals. Voters and 1831 populations come from the constituency articles in Wikipedia’s Rotten boroughs category, each checked by hand. Places come from OS Open Names. Today’s populations are Census 2021 built-up areas for towns of 5,000 or more and civil parish figures from Wikidata for smaller places (their census year is not recorded in my extract). Incomes are the ONS small area estimates for the financial year ending 2023. The 1831 boroughs and today’s areas do not share boundaries, so growth figures are a rough guide, and I left Heytesbury out because its tiny borough was only part of its parish. Electorates before 1832 are estimates, and sources sometimes disagree: I keep the alternatives in the data.
Notes and sources
- Schedules: Wikipedia, List of constituencies enfranchised and disfranchised by the Reform Act 1832, checked against Rotten and pocket boroughs and Reform Act 1832 (CC BY-SA 4.0), retrieved 27 October 2026.
- 1831 voters and populations: the constituency articles in Wikipedia’s Rotten boroughs category and Cornish rotten and pocket boroughs; Cornwall’s MPs from Parliamentary representation from Cornwall (CC BY-SA 4.0).
- 1801 populations: Wikipedia, List of towns and cities in England by historical population (CC BY-SA 4.0). Parish populations: Wikidata (CC0).
- Today: Office for National Statistics, Census 2021 and income estimates for small areas, financial year ending 2023 (Open Government Licence v3.0); built-up areas and lookups from the ONS Open Geography Portal; OS Open Names. Contains OS data © Crown copyright and database right 2026.
- Paper, data and code: Zenodo and GitHub.
- I wrote the text, with drafting and editing assistance from Claude (Anthropic), which also helped prepare the analysis code. I reviewed and checked all text and results.

