
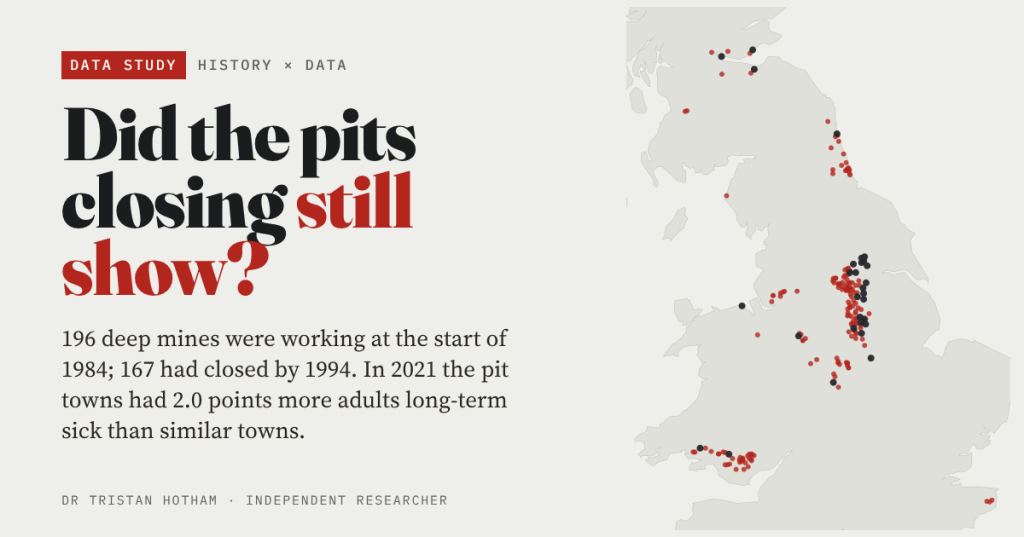
At the start of 1984 Britain still had a deep coal industry. Ten years later it was nearly all gone. I mapped every deep mine that was working that year, found the towns around them, and asked a simple question of the 2021 Census: forty years on, can you still see where the pits were?
The miners’ strike began on 6 March 1984, with a walkout at Cortonwood Colliery in South Yorkshire, and ended a year later. Few events in post-war Britain are still argued over so fiercely, and I am not going to settle those arguments here. My question is narrower and can be put to data: do the places that lived by the pits still look different from other places of the same size, in the same part of the country?
The short answer is yes, clearly. The longer answer has a twist: it hardly matters when a town’s pit closed.
Every deep mine of 1984
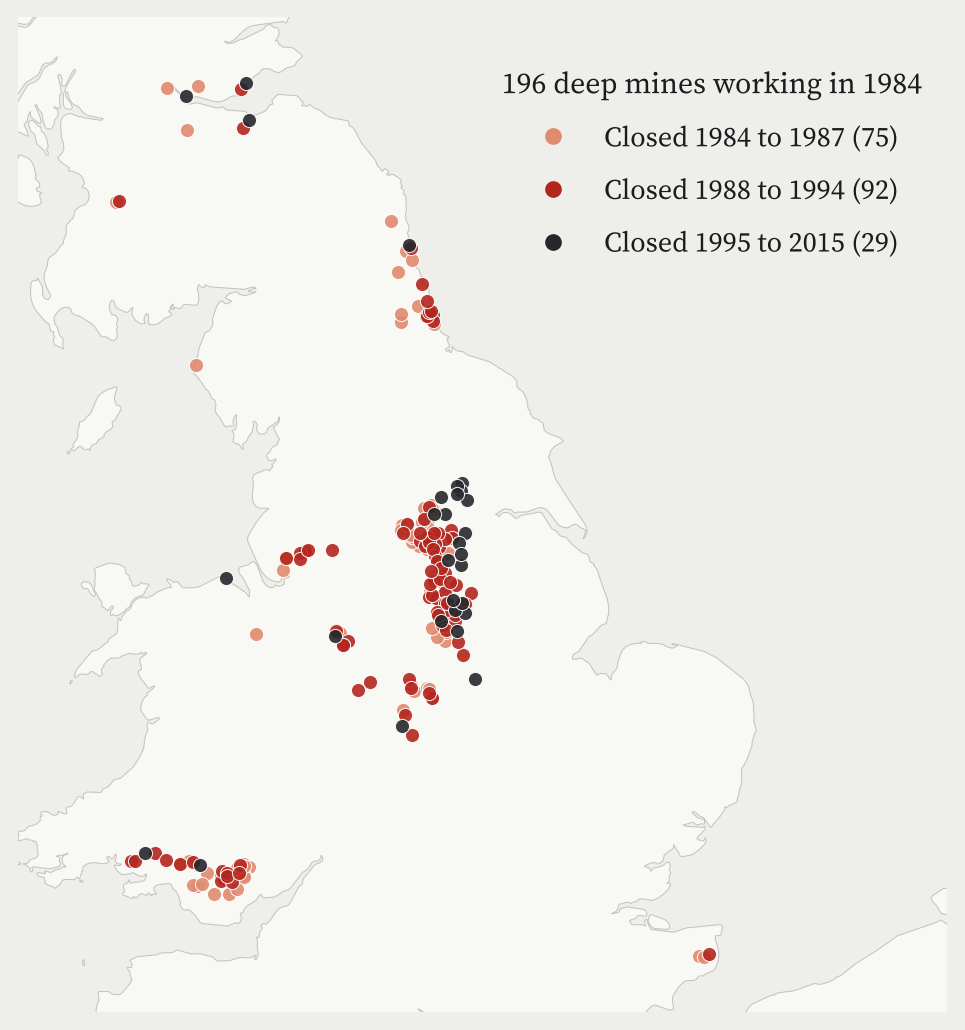
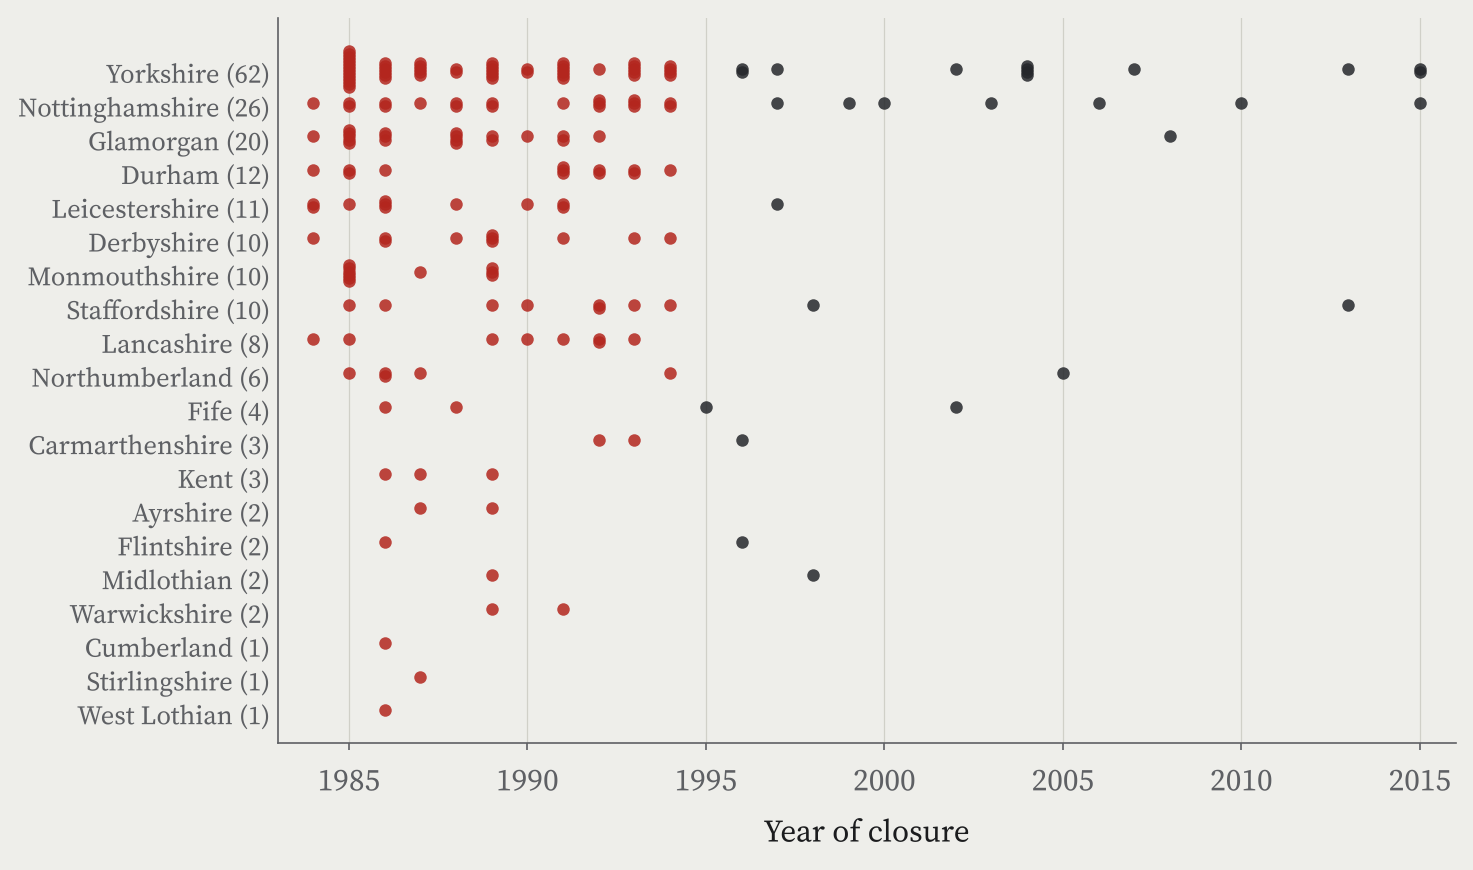
There is no single open list of the pits working in 1984, so I built one. Wikipedia has a full list for Yorkshire. For everywhere else I used the Northern Mine Research Society’s tables of the National Coal Board’s collieries, kept every pit that closed in 1984 or later, and checked the years against Wikipedia where I could: where both give a year they agree exactly 81% of the time. That gives 196 colliery units, 151 in England, 35 in Wales and 10 in Scotland. It is a little more than the 173 pits usually quoted, because some combined mines appear under more than one name.
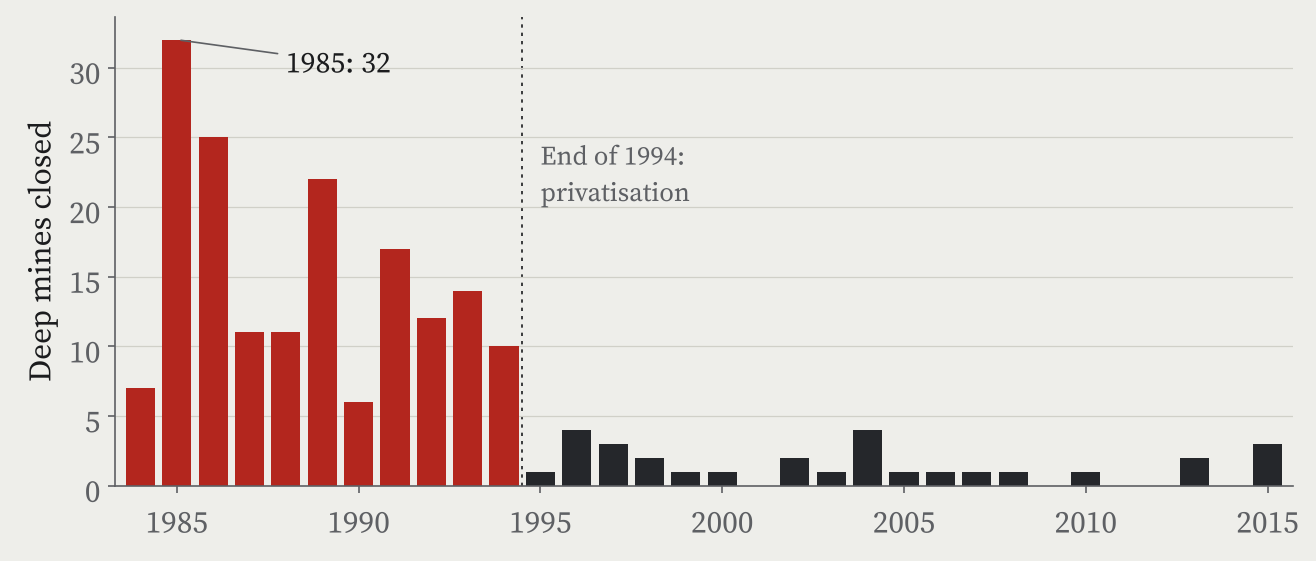
The closures came fast. The worst year was 1985, the year the strike ended, when 32 pits closed. A second wave ran from 1988 to 1994, including the closures announced in October 1992. By the end of 1994, 167 of the 196 had gone. The last three closed in 2015: Hatfield, Thoresby and, on 18 December 2015, Kellingley in North Yorkshire, the last deep coal mine in Britain.
Finding the pit towns
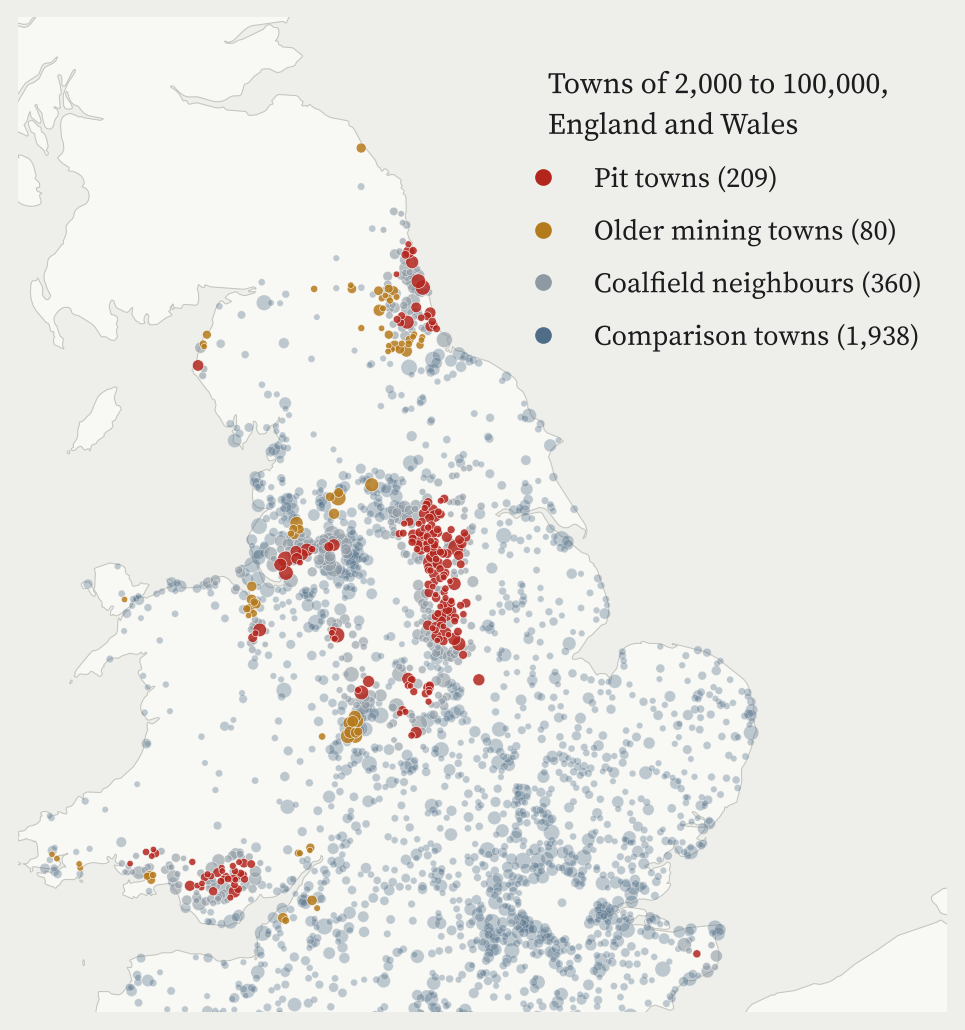
To turn pits into towns I used the ONS built-up areas, which cover every town and village in Britain, and counted a pit as a town’s if it stood within 3 km of the centre, or 2 km of the edge for bigger towns. Pits often sat just outside the village they fed, so the rule is generous on purpose. I kept towns with a pit a little further away (within 10 km) apart as “coalfield neighbours”, and marked towns with an older colliery on the map, mostly pits that closed before 1984, as “older mining towns”. Everything else is a comparison town.
Keeping to England and Wales, where Census 2021 figures are in my data, and to towns of 2,000 to 100,000 people, that gives 209 pit towns, home to 2,850,284 people. In Yorkshire and the Humber 26% of all towns this size were pit towns.
Forty years on
Then I compared each pit town with towns of the same size in the same region that never had a pit, on eight measures from Census 2021 and the ONS income estimates. The biggest gap is in health. In the median comparison town, 2.9% of adults are out of work because they are long-term sick or disabled. Size for size and region for region, the pit towns have 2.0 percentage points more: about 1.7 times as many.
The rest of the picture fits. Pit towns have 6.5 points more adults in routine or semi-routine jobs and 8.0 points fewer in managerial or professional ones, 3.7 points more households without a car, and about ££5,900 a year less household income, 10.7% of a typical comparison town’s. In some places the numbers are stark: in Denaby Main near Doncaster, whose pit closed in 1986, 13.3% of adults are long-term sick.
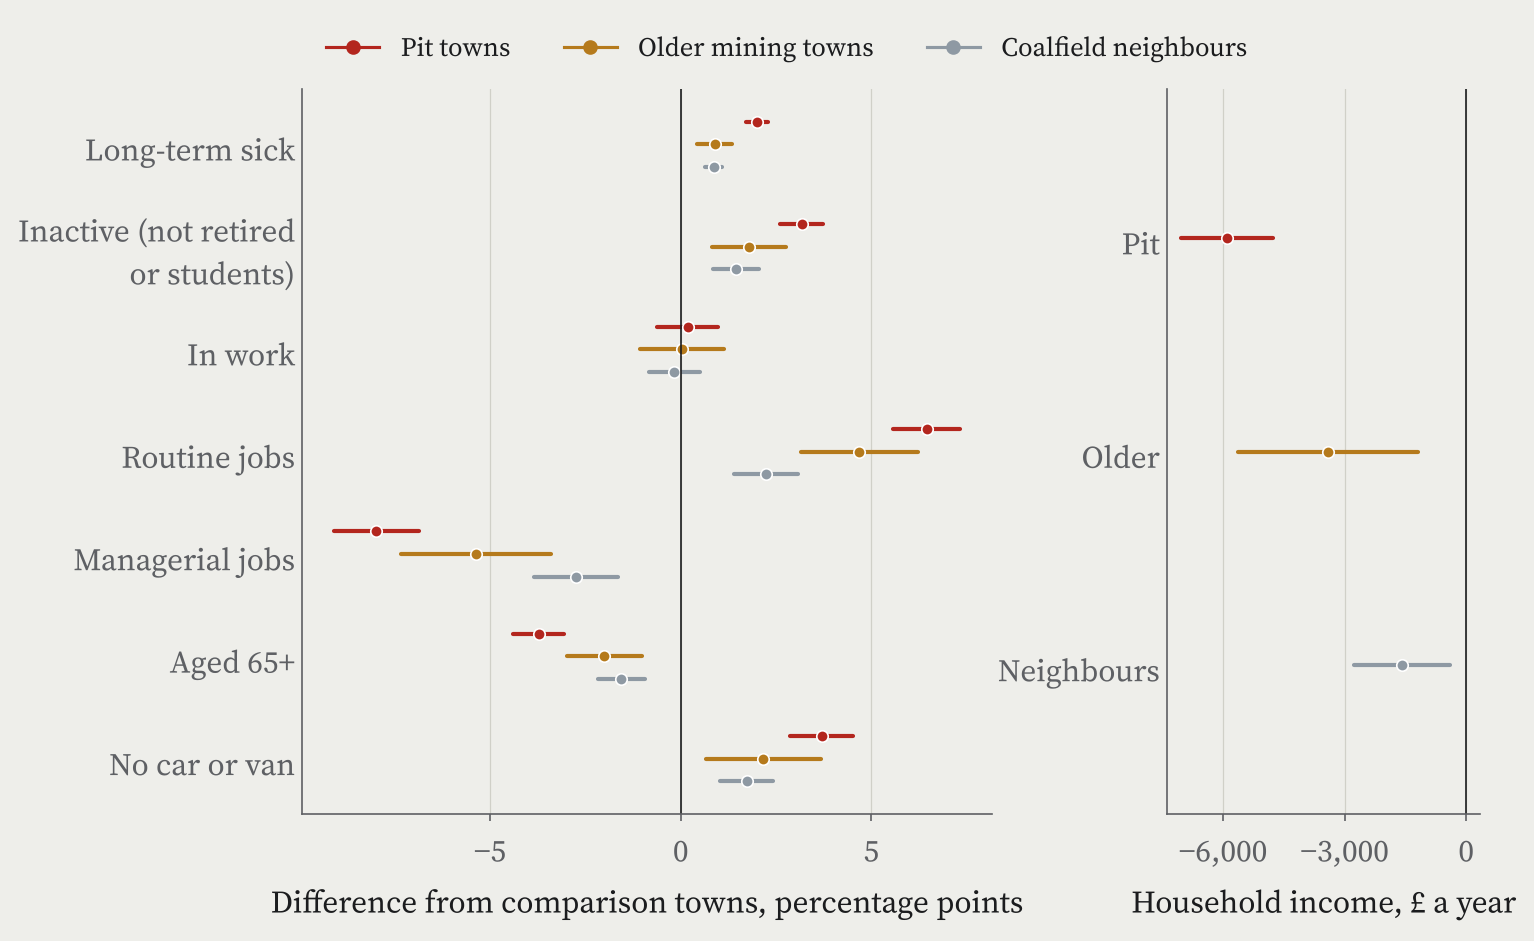
One result surprised me. The pit towns have no lower a share of adults in work than the comparison towns. They are younger, with 3.7 points fewer people aged 65 or over, so fewer of their adults are retired; but among people of working age, more are out of work through sickness or disability.
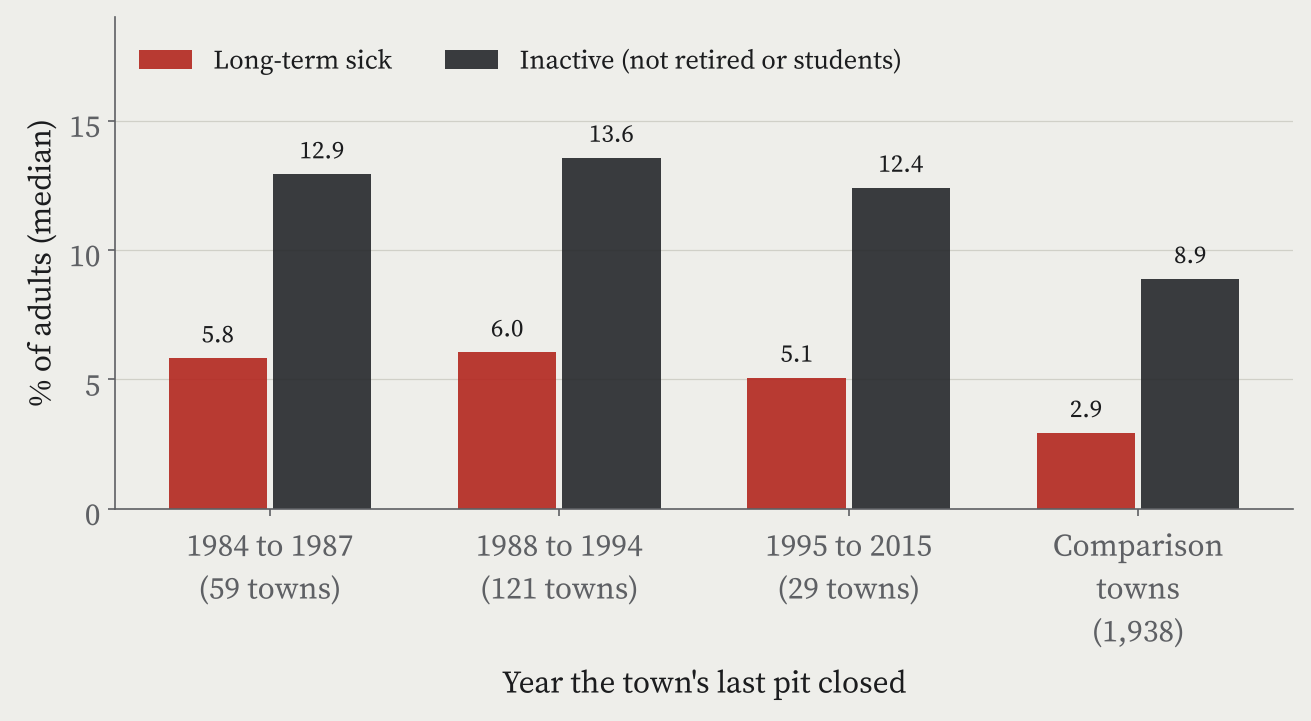
A town whose pit closed in 2015 looks much like a town whose pit closed in 1985.
Does it matter when the pit closed?
If the closures left the scar, I expected towns whose pit shut straight after the strike to look worse than towns whose pit worked on into this century. They do not. I split the pit towns by the year their last pit closed: 1984 to 1987, 1988 to 1994, and 1995 to 2015. The share of adults long-term sick is 5.8%, 6.0% and 5.1%, and once size and region are allowed for, none of the differences is more than chance.
And the older mining towns, whose pits mostly closed decades before 1984, show the same pattern at about half the size: 0.9 points more long-term sickness and ££3,403 less income. The nearer a town was to the 1984 pits, the bigger the gap.
I read this as the long shadow of coal itself: the kind of work, the injuries and illnesses it left, the jobs that came after. The closures of 1984 to 1994 were the last and biggest part of that story, not the whole of it. There is a second reading I cannot rule out: by the time the late pits closed, they employed far fewer local men than in 1984, so their towns had already been through most of the change.
What this cannot tell us
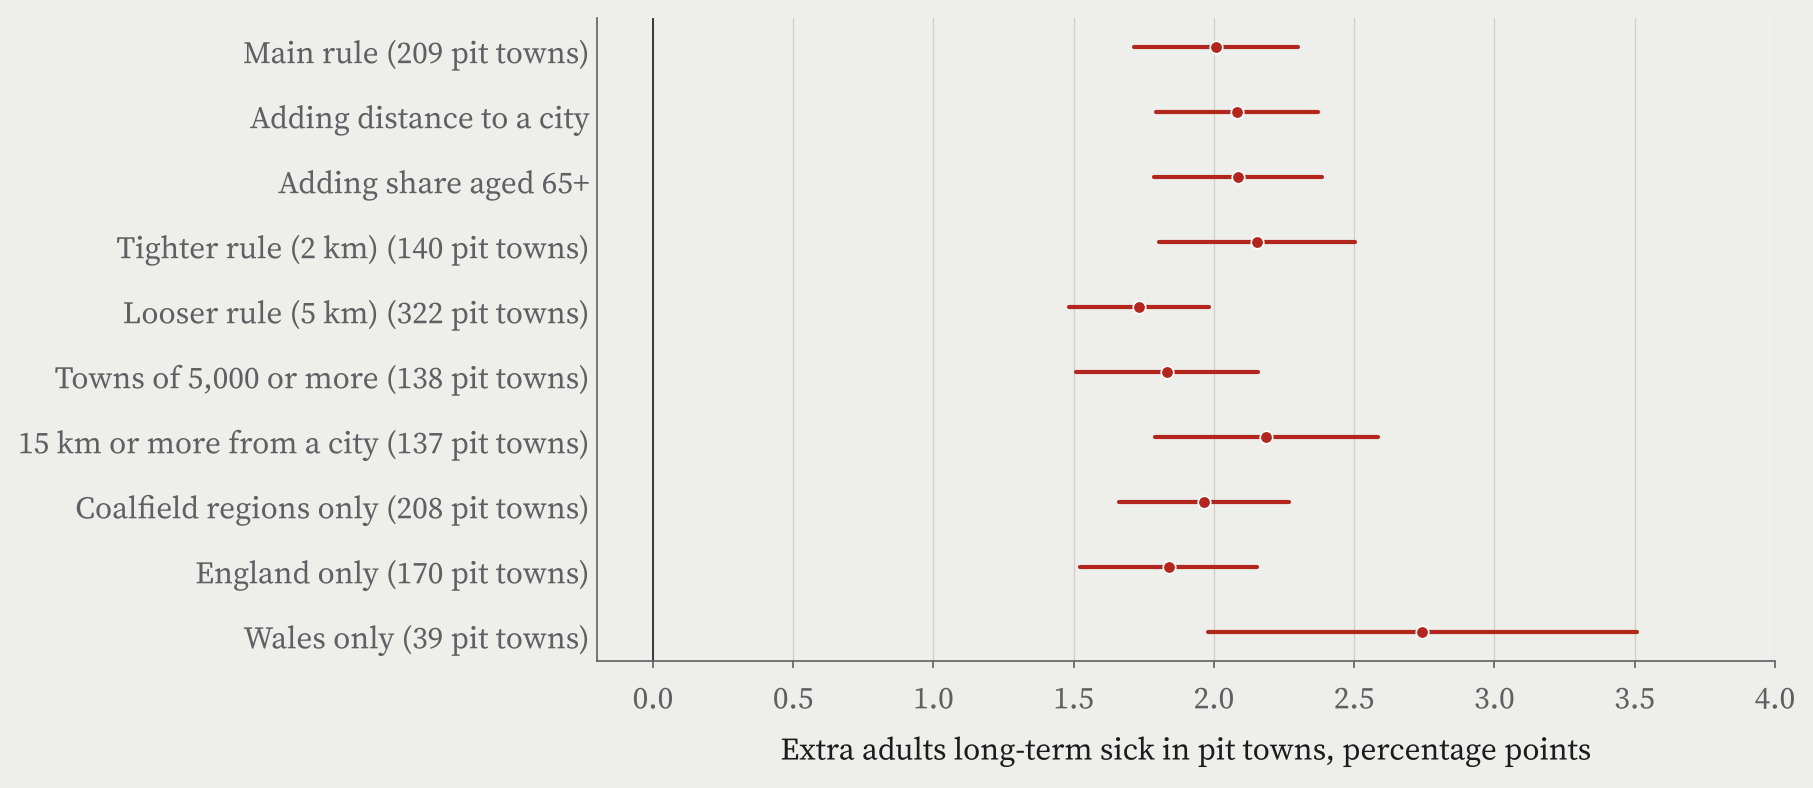
This is association, not cause. The coalfields were different from other places long before 1984, and I have no town figures from 1981 or 1991 to measure the change. Some of today’s gap was surely there already. The comparison towns were not untouched either: many lost mills, steelworks or factories in the same years. The gap survives every check I tried, though: tighter and looser town rules, allowing for age, England or Wales on their own, and only the coalfield regions. The long-term sickness gap stays between 1.7 and 2.7 points.
How I did this
The pit list combines Wikipedia’s List of collieries in Yorkshire (1984 to 2015) with the Northern Mine Research Society’s tables of NCB collieries, checked against Wikipedia’s Derbyshire and UK lists. I placed 37 pits at colliery sites mapped in OpenStreetMap, 64 at their Wikidata entry and 95 at their village. Towns are ONS built-up areas; the outcomes come from Census 2021 and the ONS income estimates for 2022 to 2023, compared with regressions that allow for size and region. The paper sets out every step and check, and the interactive version lets you look up any town.
Notes and sources
- Pits and closure years: Northern Mine Research Society, Britain’s nationalised coal mines from 1947 (NCB collieries in England, Wales and Scotland); Wikipedia, List of collieries in Yorkshire (1984 to 2015), List of collieries in Derbyshire and List of coal mines in the United Kingdom (CC BY-SA 4.0), retrieved 28 October 2026.
- The strike and the last pit: Wikipedia, 1984 to 1985 United Kingdom miners’ strike and Kellingley Colliery (CC BY-SA 4.0).
- Pit locations: OpenStreetMap contributors (ODbL), Wikidata (CC0) and OS Open Names.
- Towns and outcomes: Office for National Statistics, Census 2021 and income estimates for small areas, financial year ending 2023 (Open Government Licence v3.0); built-up areas and lookups from the ONS Open Geography Portal. Contains OS data © Crown copyright and database right 2026.
- For the longer story of the former coalfields, see the work of Christina Beatty, Steve Fothergill and colleagues at Sheffield Hallam University, including The State of the Coalfields 2019.
- A companion study: Did Beeching kill your town?
- Paper, data and code: Zenodo and GitHub.
- I wrote the text, with drafting and editing assistance from Claude (Anthropic), which also helped prepare the analysis code. I reviewed and checked all text and results.

