
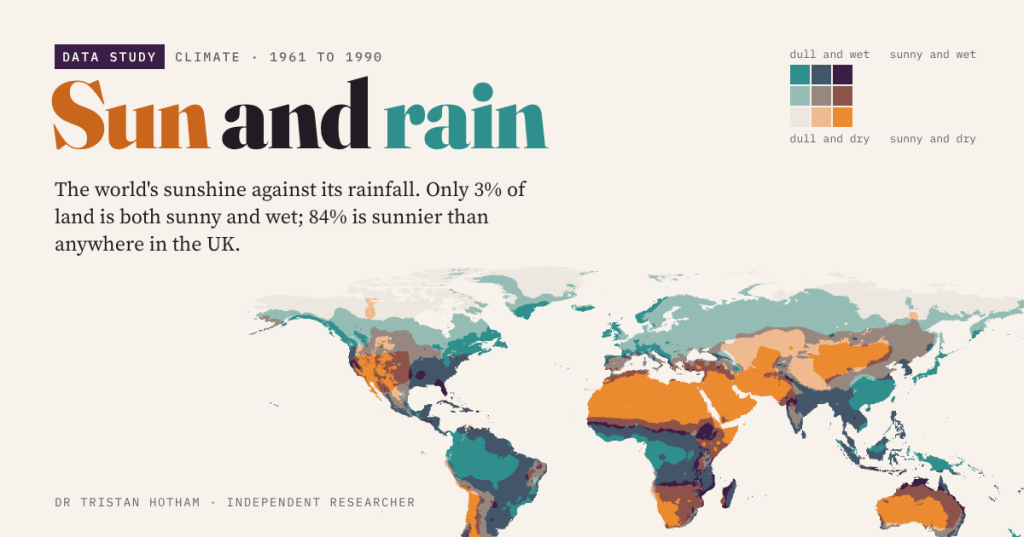
Is your town sunny or rainy? Those are two different questions, and putting them on one map splits the world into four corners: sunny and dry, sunny and wet, dull and dry, dull and wet. Here is where everywhere sits, where Britain sits, and which faraway places share your weather.
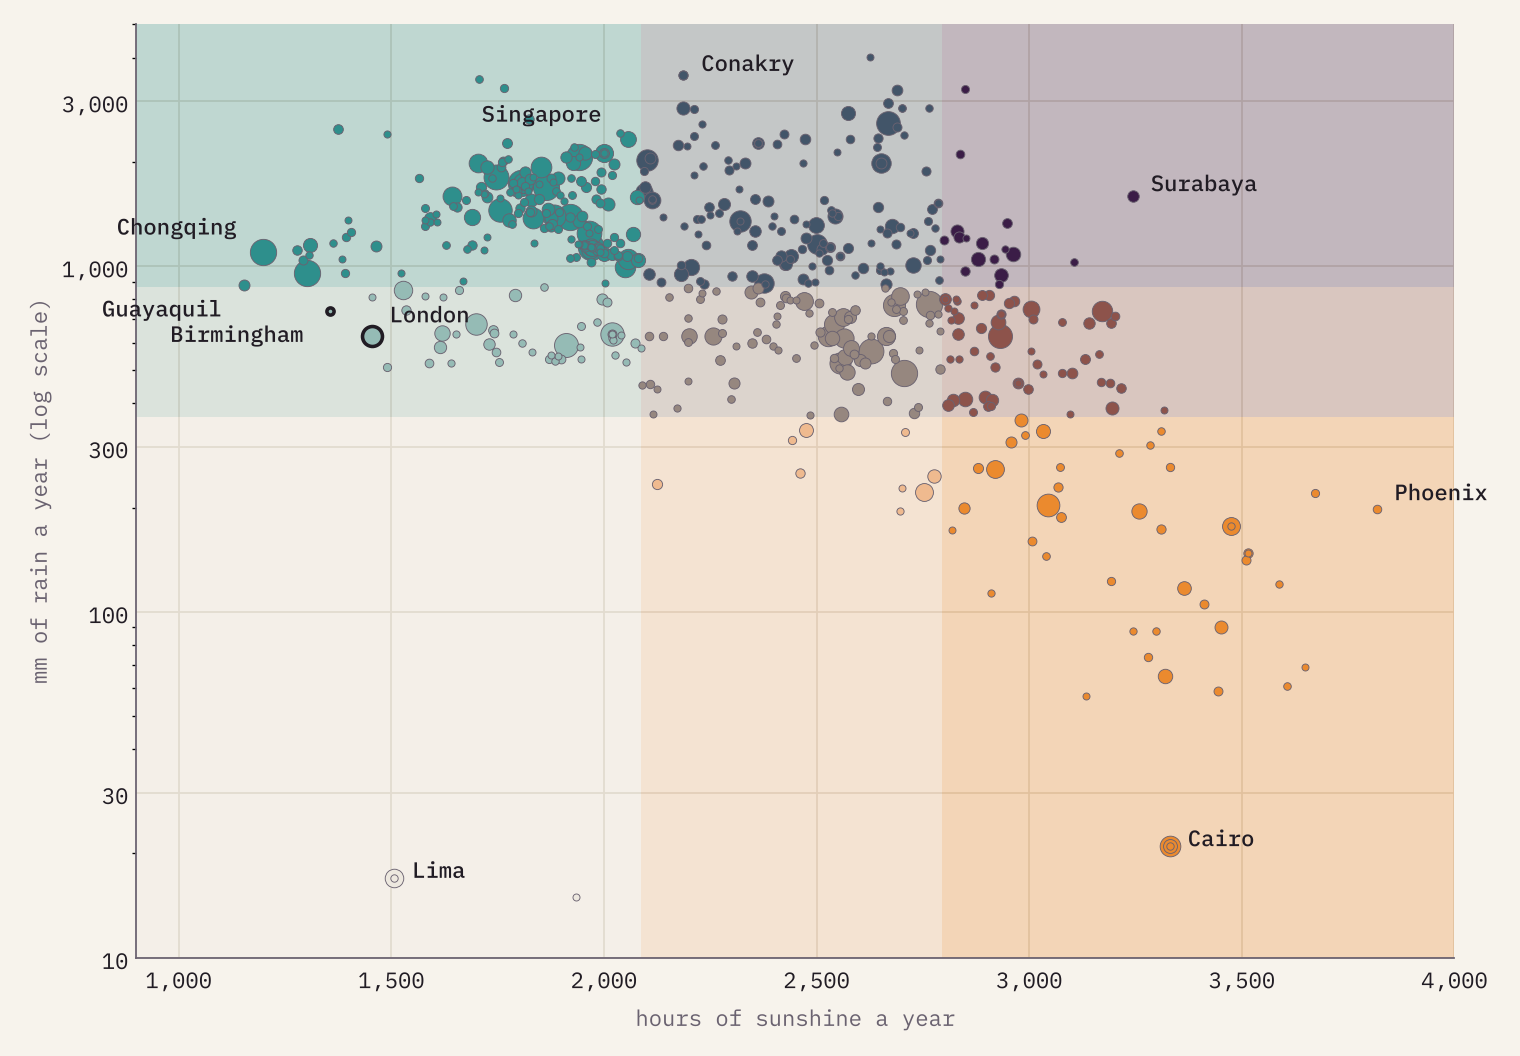
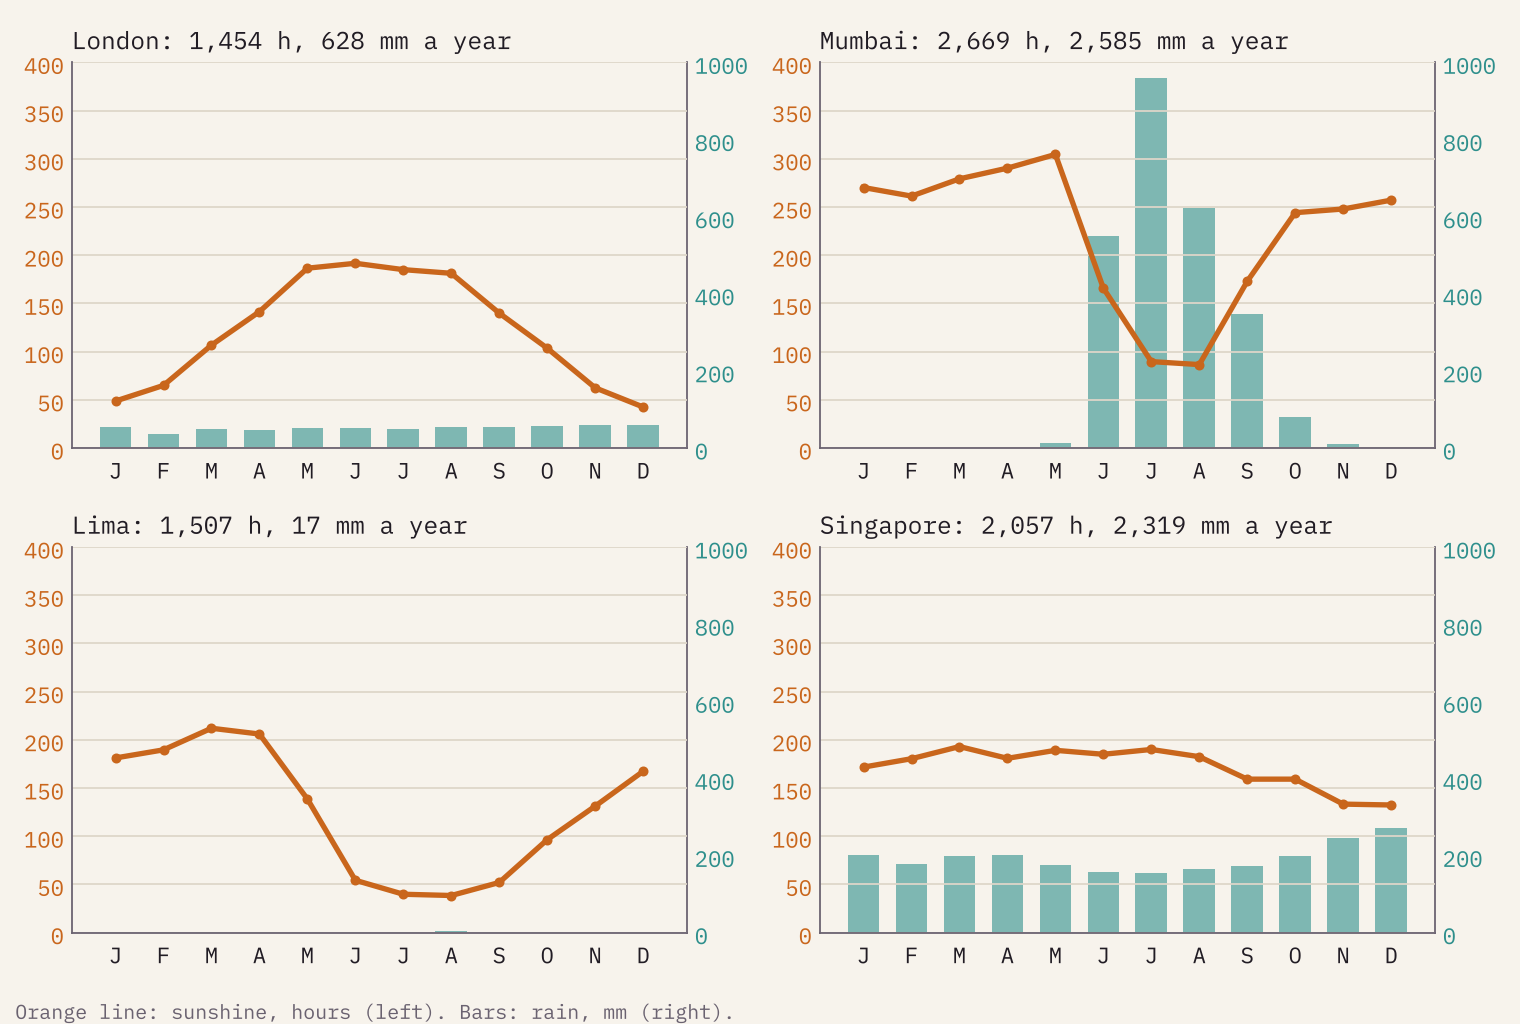
British weather talk runs on two things: did the sun come out, and did it rain? We tend to treat them as one, as if a grey day and a wet day were the same. They are not. Lima, the capital of Peru, gets 17 mm of rain in an average year, less than London gets in a fortnight, and yet it is one of the gloomiest big cities on Earth. Surabaya in Java is drenched by the monsoon, 1,596 mm a year, and still gets 3,244 hours of sunshine, more than Madrid.
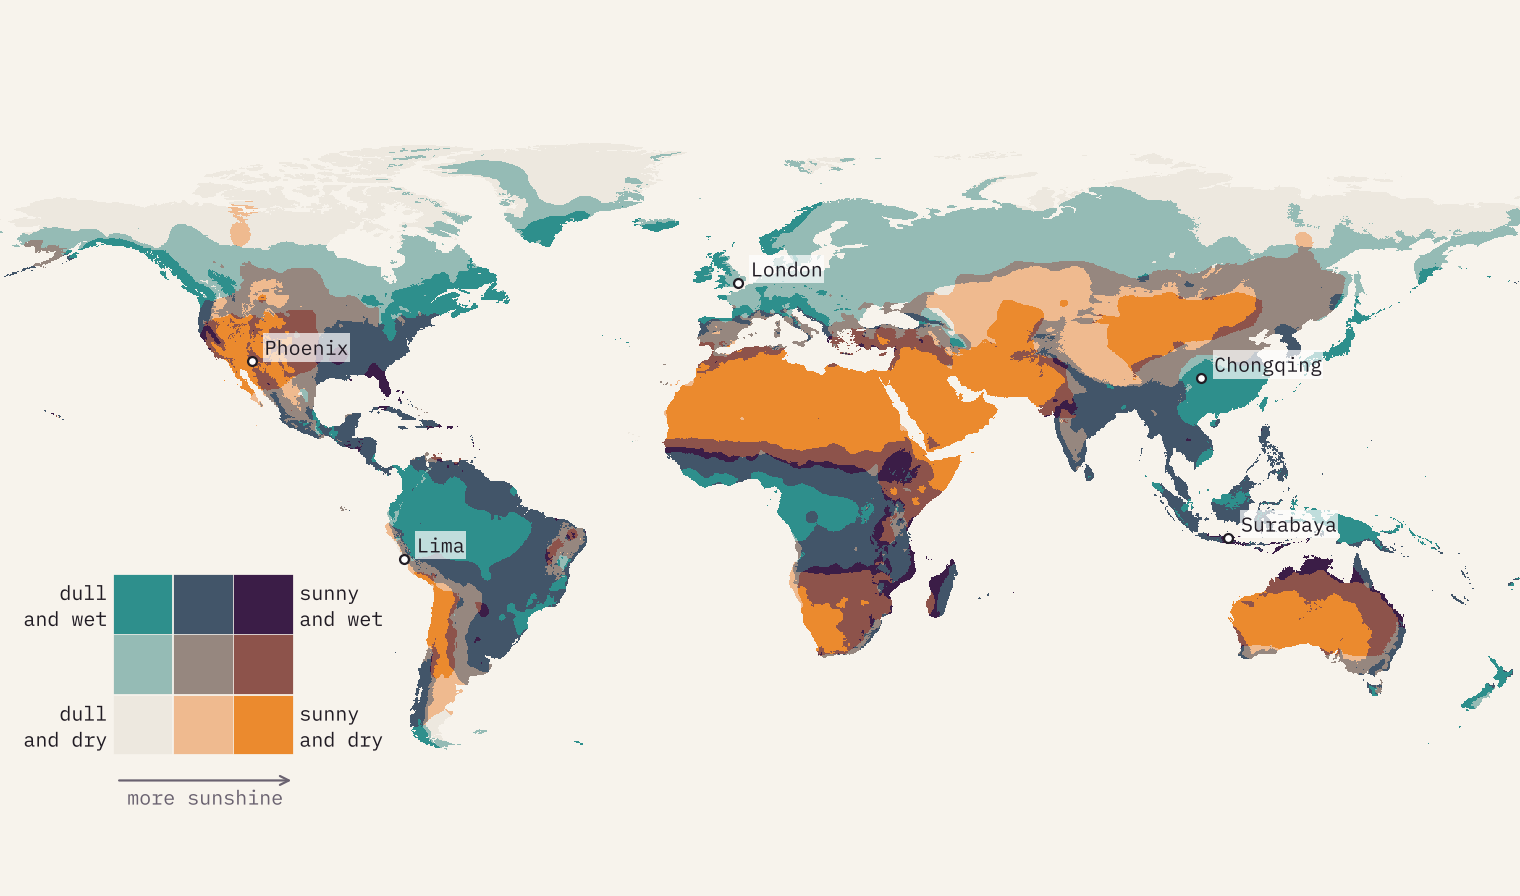
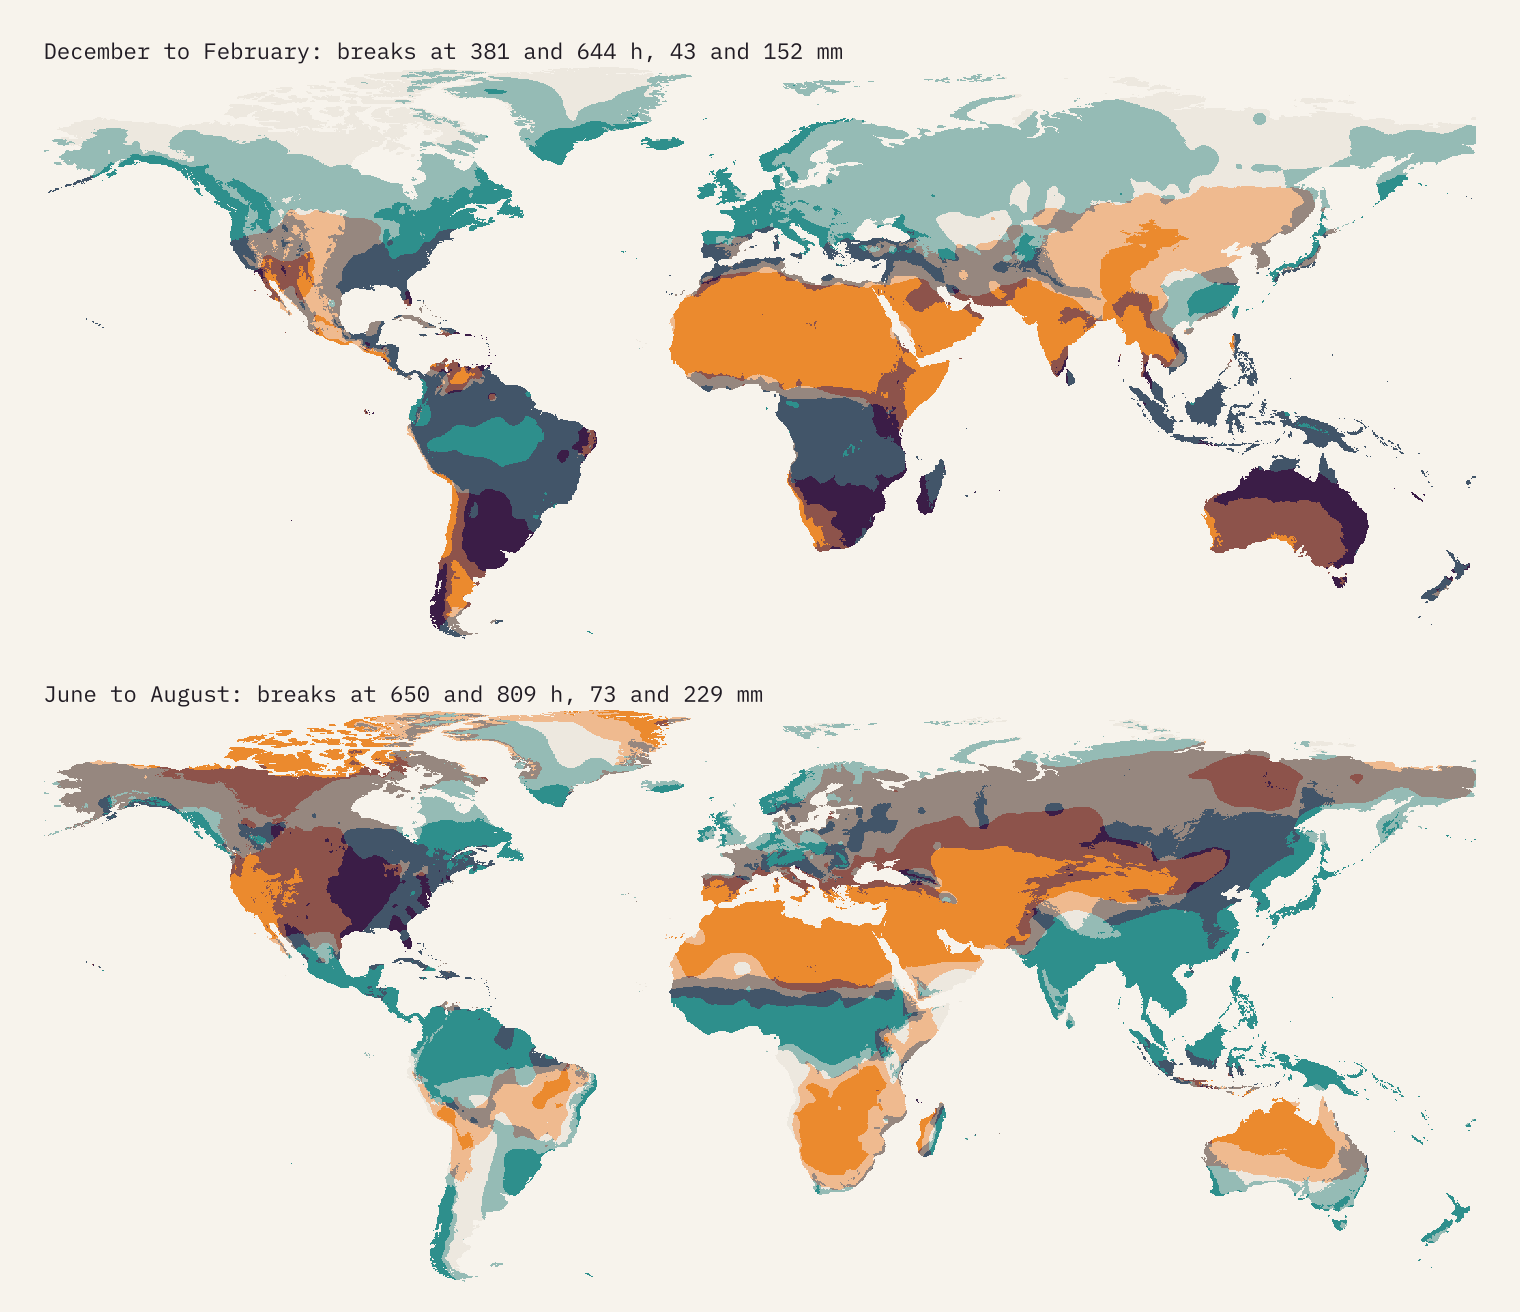
So I put the two on one map. The data is the Climatic Research Unit’s global climatology for 1961 to 1990, which gives every patch of land outside Antarctica, in 566,262 cells about 18 km across, an average month of sunshine and of rain. I turned its sunshine figures into hours, then coloured each cell by which third of the world’s land it falls in for sun and which third for rain. Nine colours; four corners and a middle.
Four corners, not equally full
If sun and rain had nothing to do with each other, each of the nine colours would cover a ninth of the land, about 11%. They do not, because the same thing, cloud, brings rain and blocks sun. The orange sunny and dry corner covers 21% of the world’s land: the great deserts and their edges. The dark sunny and wet corner covers just 3.0%. It turns up where the rain comes all at once in a short season and the rest of the year is bright: the savannas and highlands of Africa, northern Australia, parts of Brazil and India, and among big cities Surabaya, Antalya, Cape Town and Havana.
The dull and dry corner, 7.3% of the land, is the oddest. Most of it is the far north of Canada, Alaska and Siberia, where long winter nights and cold air keep both sun and rain low. Hardly anyone lives there: only 0.4% of the people in the 34,167 towns and cities I matched. Of the 573 places with a million people or more, just three are dull and dry, and all three are on the desert coast of Peru: Lima, Callao and Trujillo, where a cold ocean makes low cloud and fog but almost no rain.
Britain: not that wet, very dull
Now for home. The UK’s land averages 1,319 hours of sunshine a year in this data. Of the 156 countries with at least 20,000 km² of land, only Iceland, Ireland and Norway are duller. The sunniest cell in the whole country, on the Sussex coast near Bognor Regis, gets 1,774 hours, and 84% of the world’s land gets more than that. Every last cell of the UK is in the dullest third of the world.
Rain is another matter. London gets 628 mm a year, which makes it drier than 415 of the 573 big cities. Our rain is frequent, light and grey, not heavy. Only the western hills are truly wet: one cell near Loch Lomond reaches 3,300 mm. The thing that really marks us out is the missing sun. Of the people counted in my towns and cities, 96% live somewhere sunnier than London. And Birmingham, with 1,356 hours, is the dullest big city in the world outside Guayaquil in Ecuador and the fog-bound cities of south-west China.
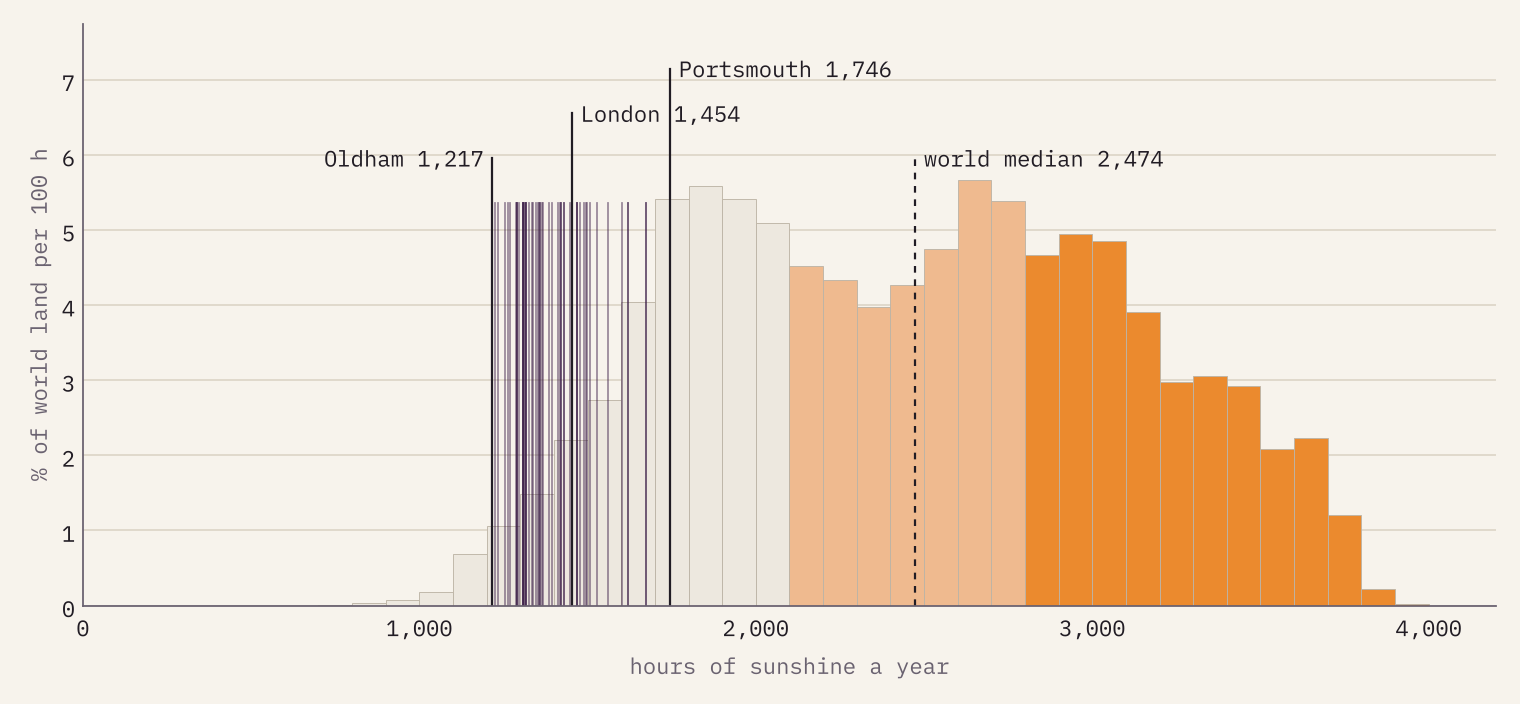
96% of the people in the world’s towns and cities live somewhere sunnier than London.
When the sun and rain arrive
Annual totals hide the calendar, and the calendar is where it gets interesting. London’s sunshine simply follows the length of the day, peaking at 192 hours in June. In Mumbai the monsoon flips it: May has 304 hours of sun, July has 90 hours and 959 mm of rain. Lima is dull from June to September, under its winter fog, and dry all year. Across the tropics the sunniest month falls outside the local summer on 63% of the land.
On the interactive page you can switch the map to any season or month and watch the monsoon march north into south Asia and the Sahel in the northern summer, while the southern continents turn sunny and wet in theirs.
Find your weather twin
The part I have enjoyed most is the twin finder. Pick a town and the page compares its twelve months of sun and rain with every cell on Earth, lights up the places that match, and lists the closest big towns abroad. Among places of 300,000 people or more, London’s nearest twins are Münster, Utrecht and Antwerp, which will surprise no one who has been there. Tick a box and it will also match places whose seasons are six months out, so a southern summer can stand in for a northern one. Some places have no twin at all: Lima’s nearest match outside Peru is a long way off, and so is Mumbai’s.
You can also drag the lines between the classes, switch to round-number breaks, or try a four by four key. Class breaks are a choice, and moving them is the quickest way to see how much a map like this depends on it.
How I did this
The climate data is CRU CL 2.0 (New and colleagues, 2002): average monthly sunshine, as a percentage of the possible daylight, and average monthly rain for 1961 to 1990 on a grid of 10 arc-minutes. I converted sunshine to hours with the astronomical length of the day at each latitude in each month (the FAO-56 formula). The breaks are thirds of land area, weighted by the size of each cell. Places are the GeoNames list of towns and cities with 15,000 people or more, each given the nearest land cell. For rain I checked against a second climatology, WorldClim 2.1 for 1970 to 2000: the two agree closely (correlation 0.977), and the rain third is the same on 94% of the land.
The big caveat is sunshine. It was measured at far fewer stations than rain, and where it was missing the authors converted cloud cover into sunshine. In much of Africa, South America, central Asia and the Arctic the map is interpolating across wide gaps, and I had no second sunshine dataset to check it against. It is also a past climate: sunshine and rain have both shifted since 1990. Read single cells as indicative and the big patterns as the story.
Notes and sources
- Climate: CRU CL 2.0, Climatic Research Unit, University of East Anglia; New, M., Lister, D., Hulme, M. and Makin, I. (2002) A high-resolution data set of surface climate over global land areas, Climate Research 21: 1 to 25. No licence is stated with the files; I share derived grids and summaries with this citation.
- Rain cross-check: WorldClim 2.1; Fick, S.E. and Hijmans, R.J. (2017) WorldClim 2, International Journal of Climatology 37(12): 4302 to 4315. Only summary statistics are published.
- Places: GeoNames cities15000 (CC BY 4.0). Country outlines: Natural Earth (public domain). Day length: FAO Irrigation and Drainage Paper 56 (Allen and colleagues, 1998).
- Text, figures and derived data are CC BY 4.0; the code is MIT. A companion map of the UK at 1 km is on its way.
- I wrote the text, with drafting and editing assistance from Claude (Anthropic), which also helped prepare the analysis code. I reviewed and checked all text and results.

