
Tag: Animated timeline
-
Who was big when? 126 seasons of English league football on one map
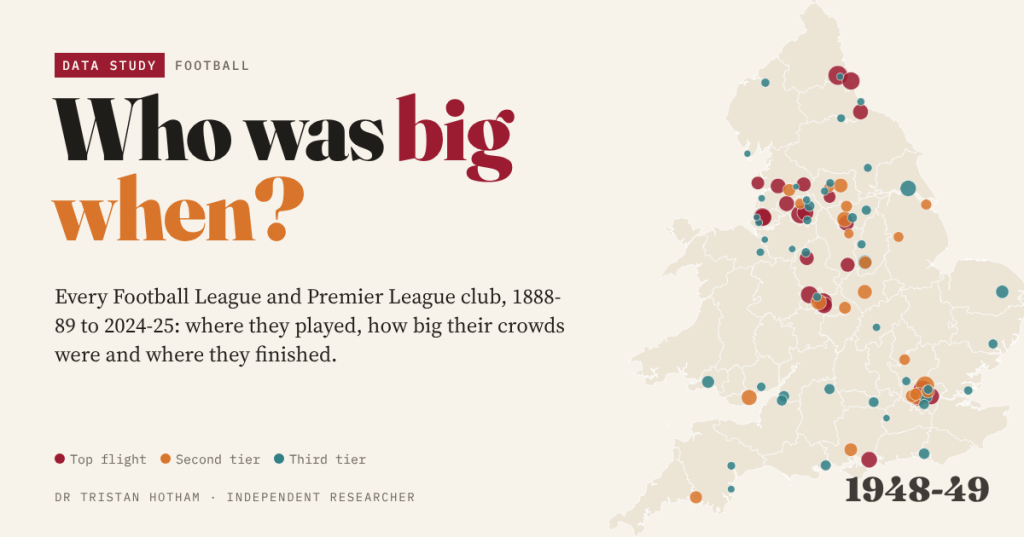
Every English league club since 1888 on one map, sized by its crowd: 41.2 million at league matches in 1948-49, 16.5 million in 1985-86, a game that moved south, and 39 towns that lost their league club.
-
Every Tour de France, mapped: from a lap of France to a race that hops
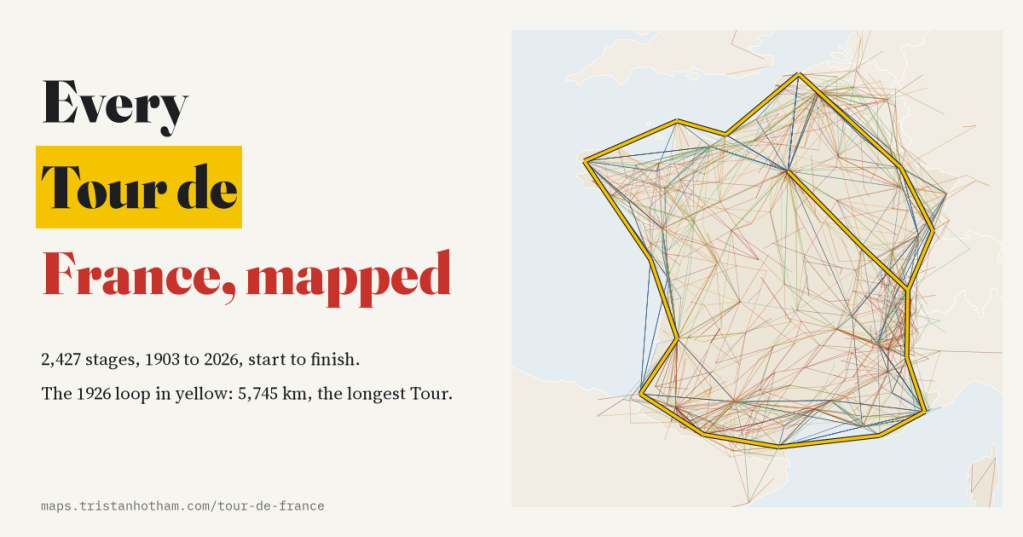
I mapped all 2,427 stages of the Tour de France since 1903, start to finish. For thirty years it was one unbroken loop round the edge of France; now 88% of stages start somewhere new, the race is 42% shorter than in 1926 and faster than ever.
-
Where football clubs come from: from Sheffield in 1857 to every corner of the world
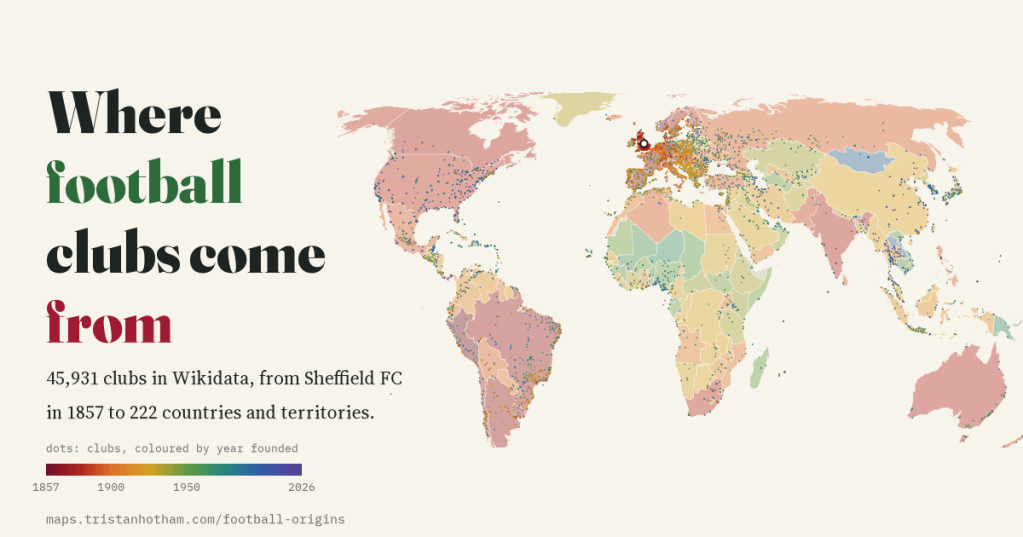
I put 45,931 football clubs from Wikidata on one animated map, in the order they were founded: from Sheffield FC in 1857 to 222 countries and territories, with the oldest club in each and the clubs that folded.
-
When did your country lose 11 days? Four great switches, mapped
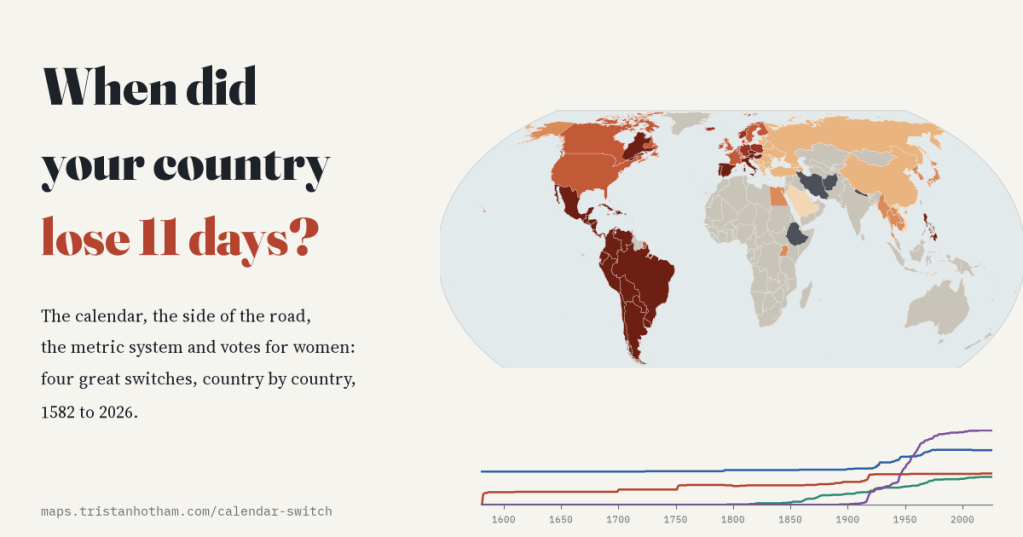
Britain lost eleven days in 1752, Russia thirteen in 1918, and Saudi Arabia switched its civil calendar only in 2016. I mapped when every country the sources date changed calendar, side of the road, units and votes for women.
-
The Earth at night: where the world lit up and where it went dark
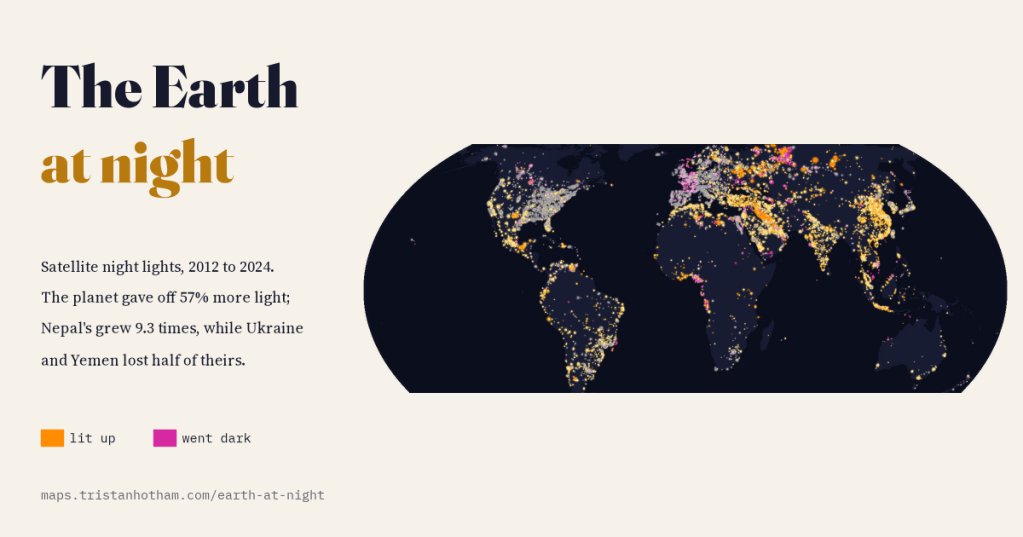
Seen from space, the planet gave off 57% more light in 2024 than in 2012. Nepal’s light grew 9.3 times and Africa’s cities blazed up, while war halved the light of Ukraine and Yemen, and new LED street lamps made France look 40% darker than it is.

