
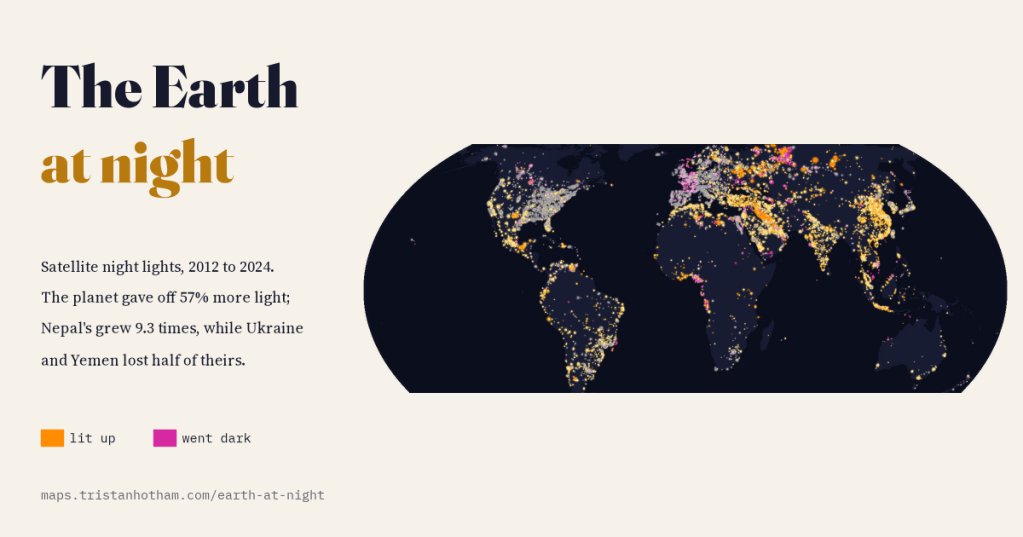
Seen from space, the planet gave off 57% more light in 2024 than in 2012. I mapped every year of satellite night lights to see where the new light came from, where the lights went out, and why some of the darkest-looking changes are not darkness at all.
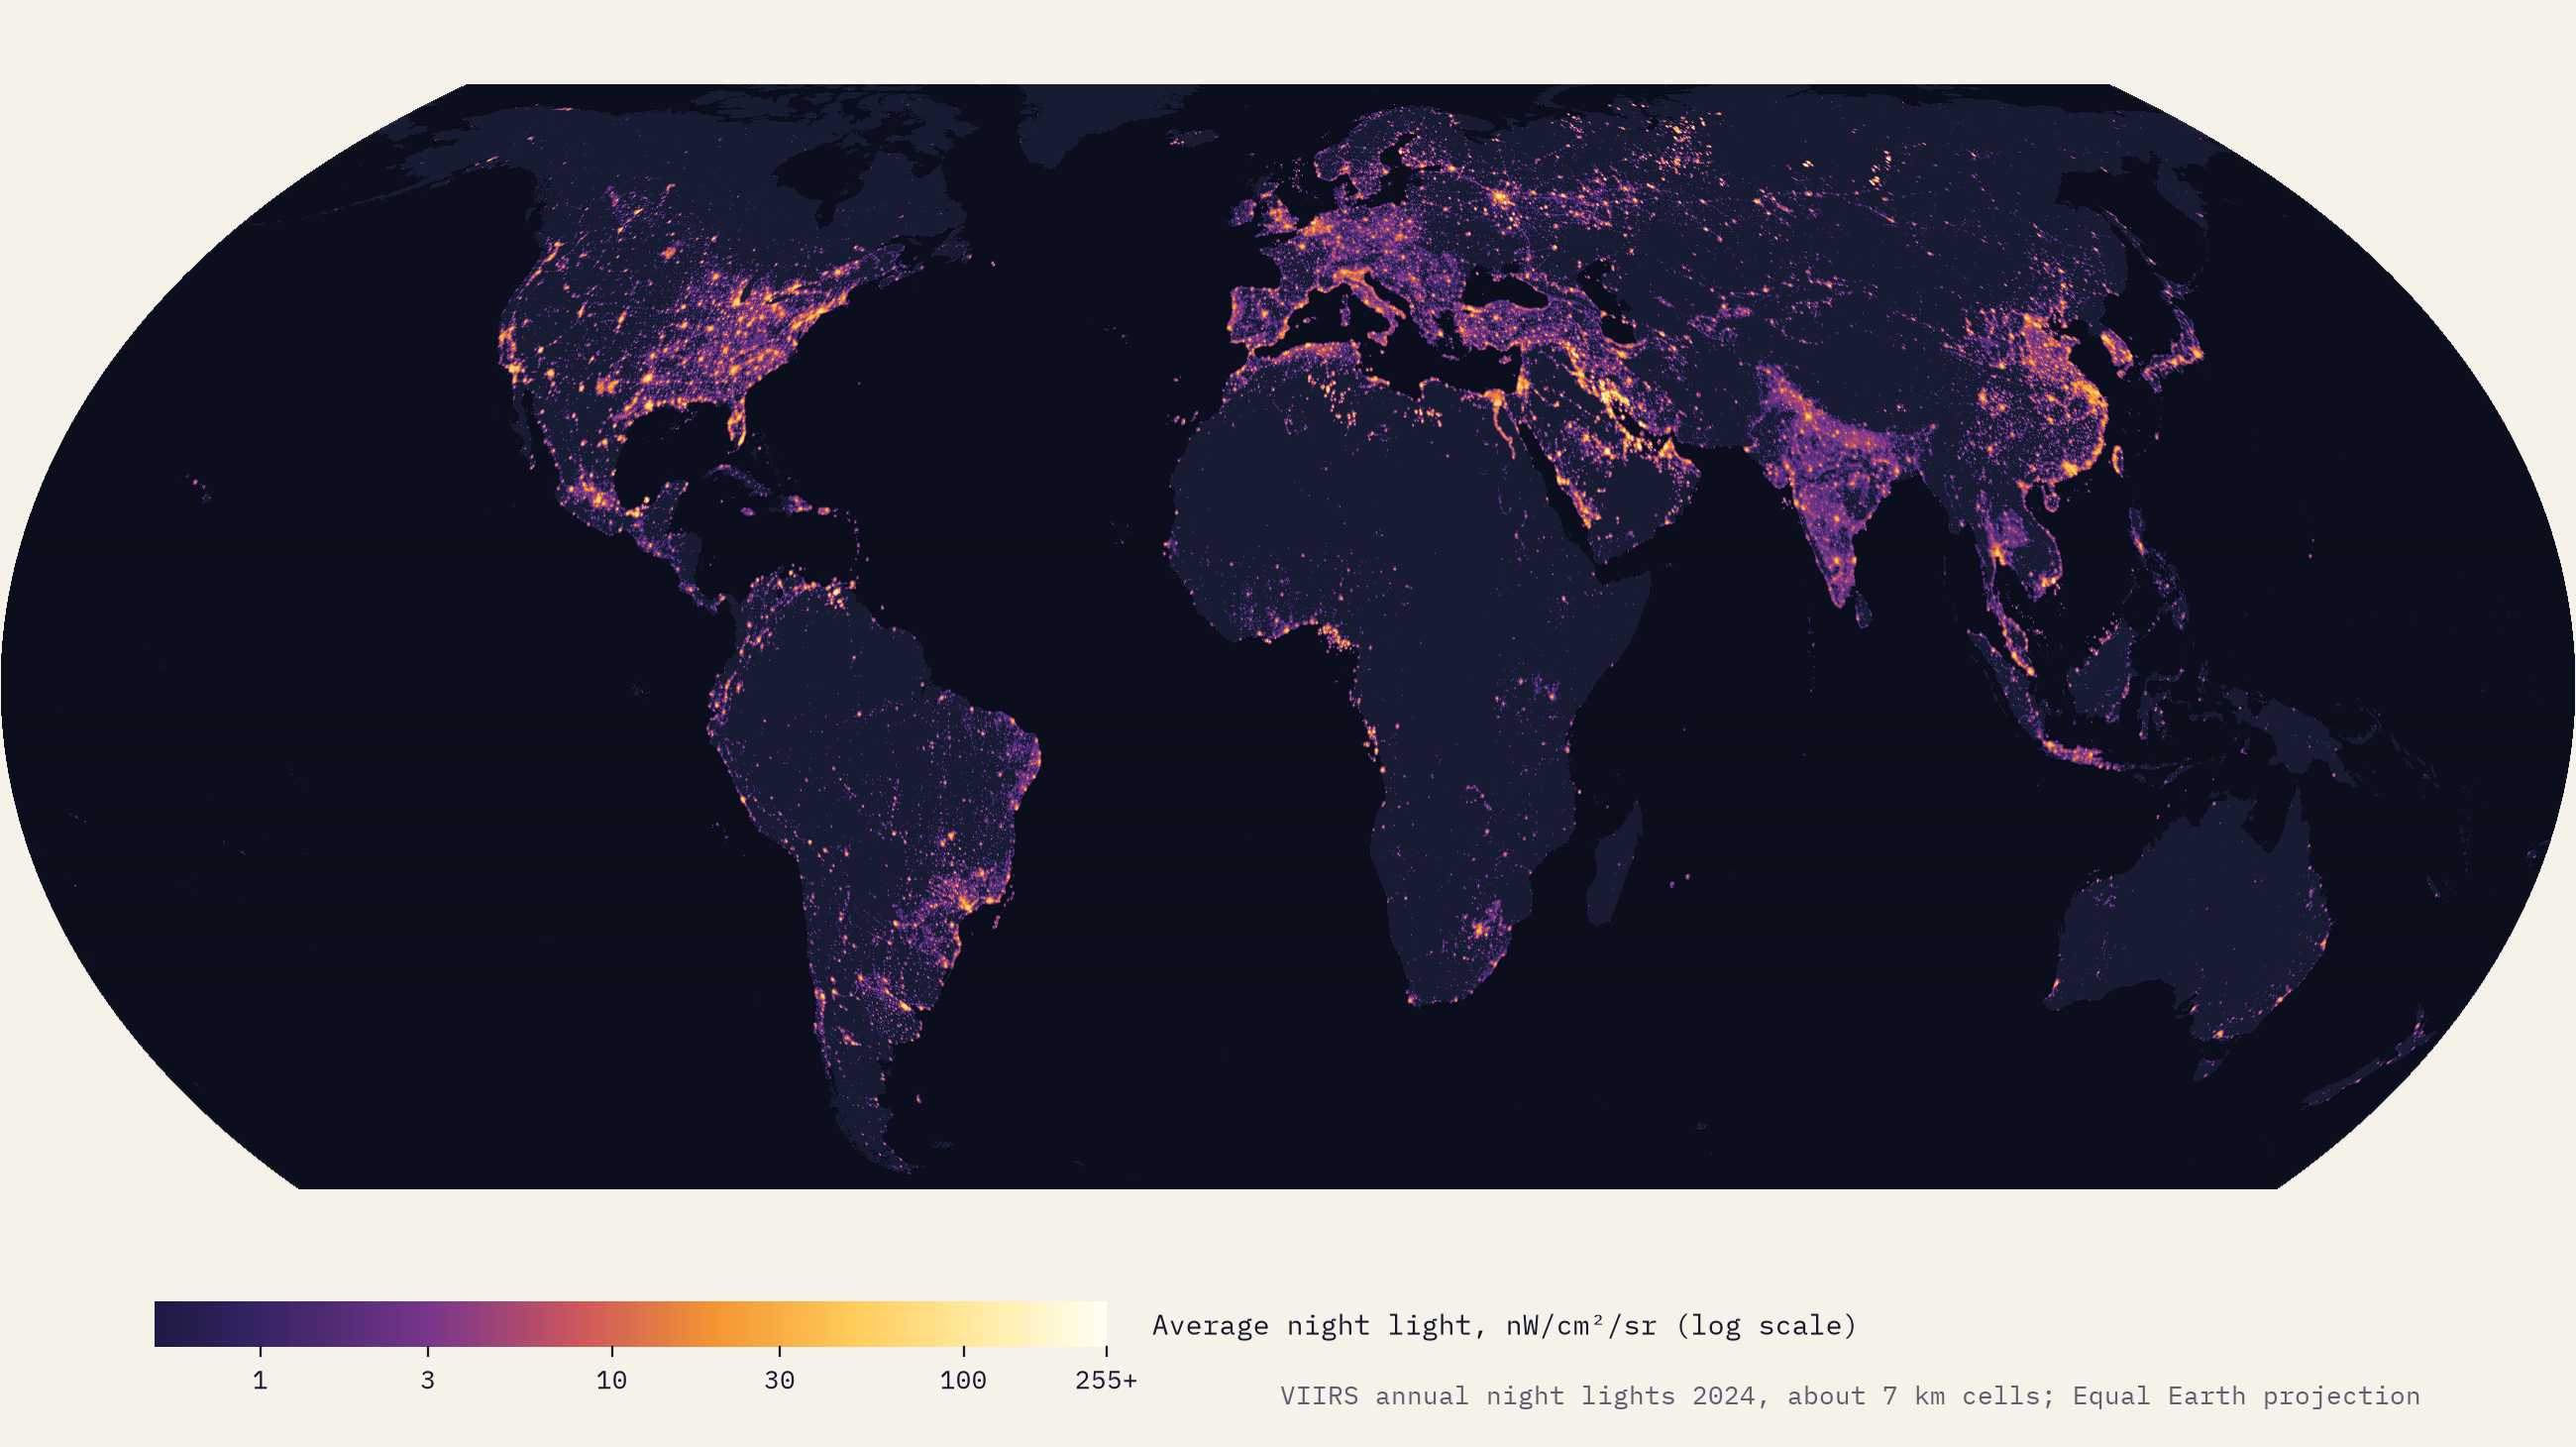
The picture of the Earth at night is one of the great images of our age: coastlines traced in light, roads stringing cities together like beads, and great dark gaps where few people live or where there is no power to spare. Since 2012 a weather satellite has taken that picture every night at about half past one in the morning, with an instrument careful enough to compare one year with the next. I wanted to use those measurements to answer some plain questions. How much brighter has the world become? Where did the new light come from? And where did the lights go out?
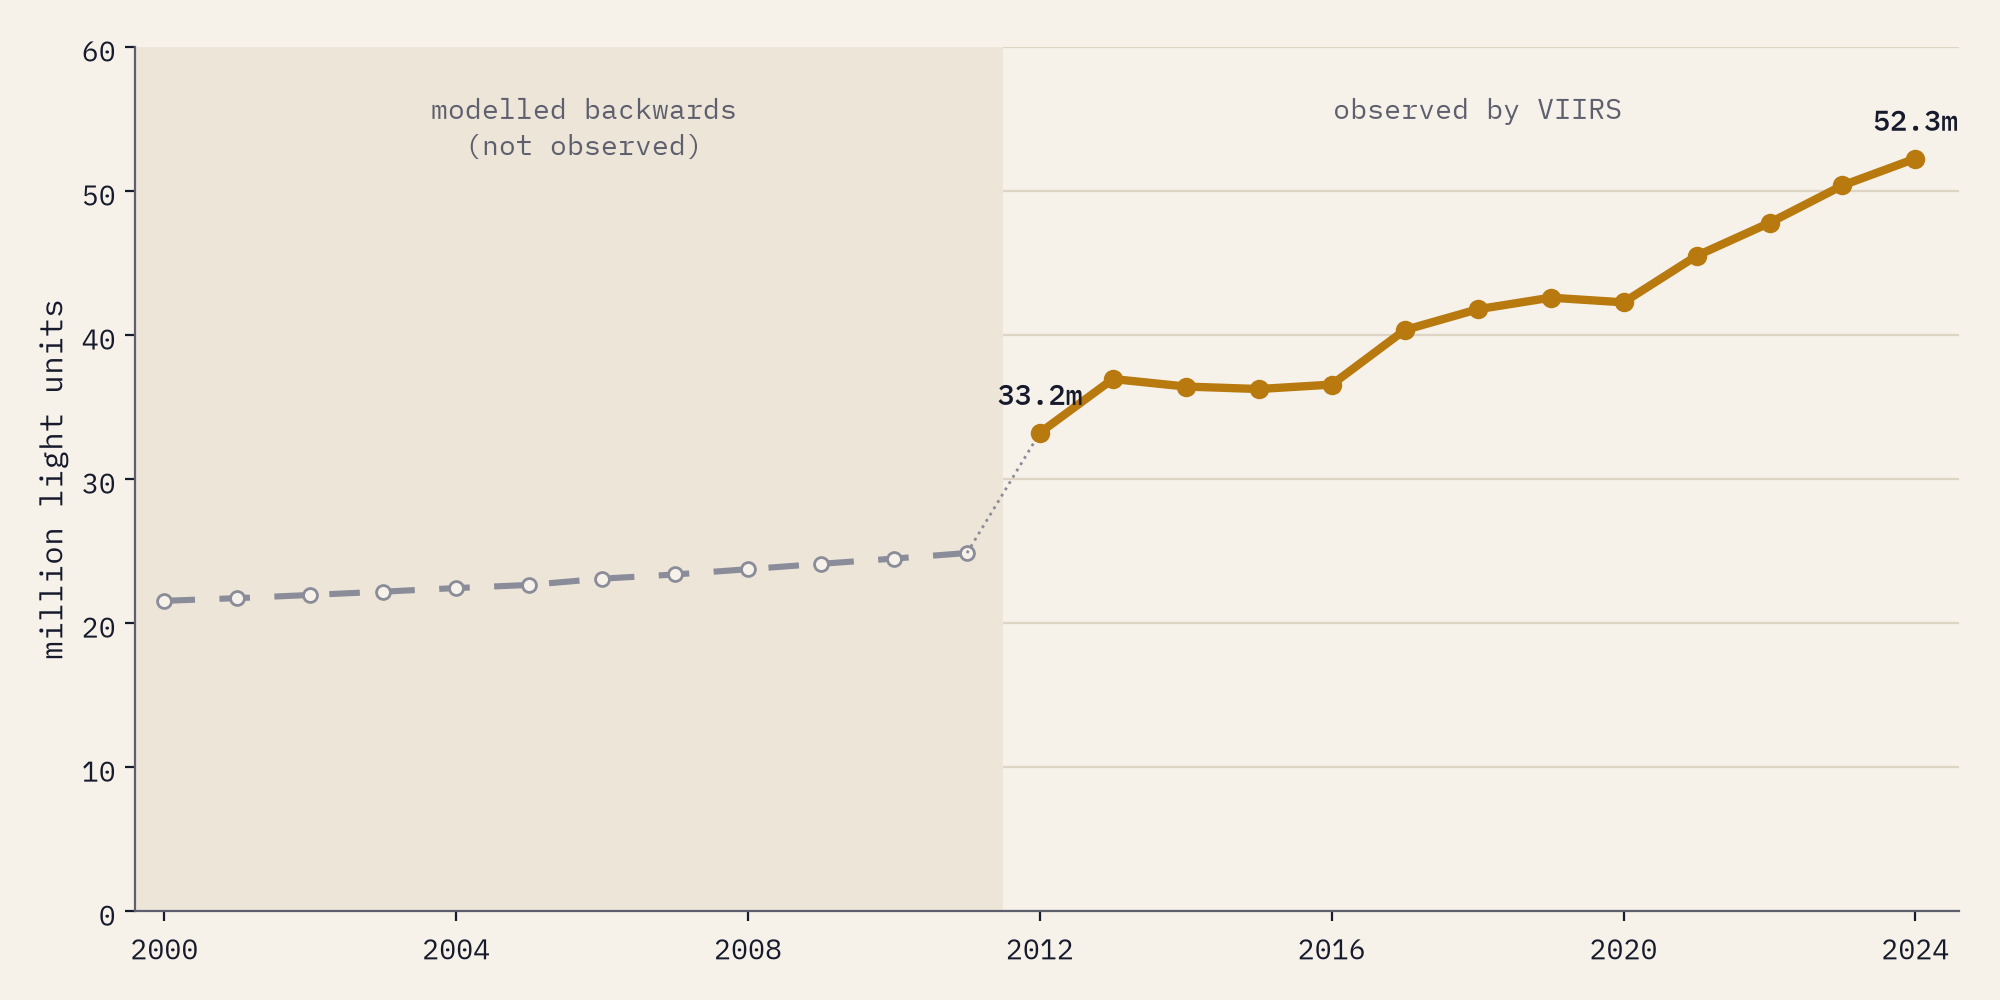
The yearly pictures are the Annual VIIRS Night Lights made by the Earth Observation Group at the Colorado School of Mines, prepared as one consistent stack of world maps by Tomislav Hengl of OpenGeoHub. I added up the light over every country and around every big city, counting a square kilometre shining at one nanowatt per square centimetre per steradian (the satellite’s unit) as one “light unit”. Only 2012 to 2024 are real observations. Hengl also ran a statistical model backwards to 2000; the interactive map shows those years, clearly marked, but none of the numbers here rests on them.
A brighter planet
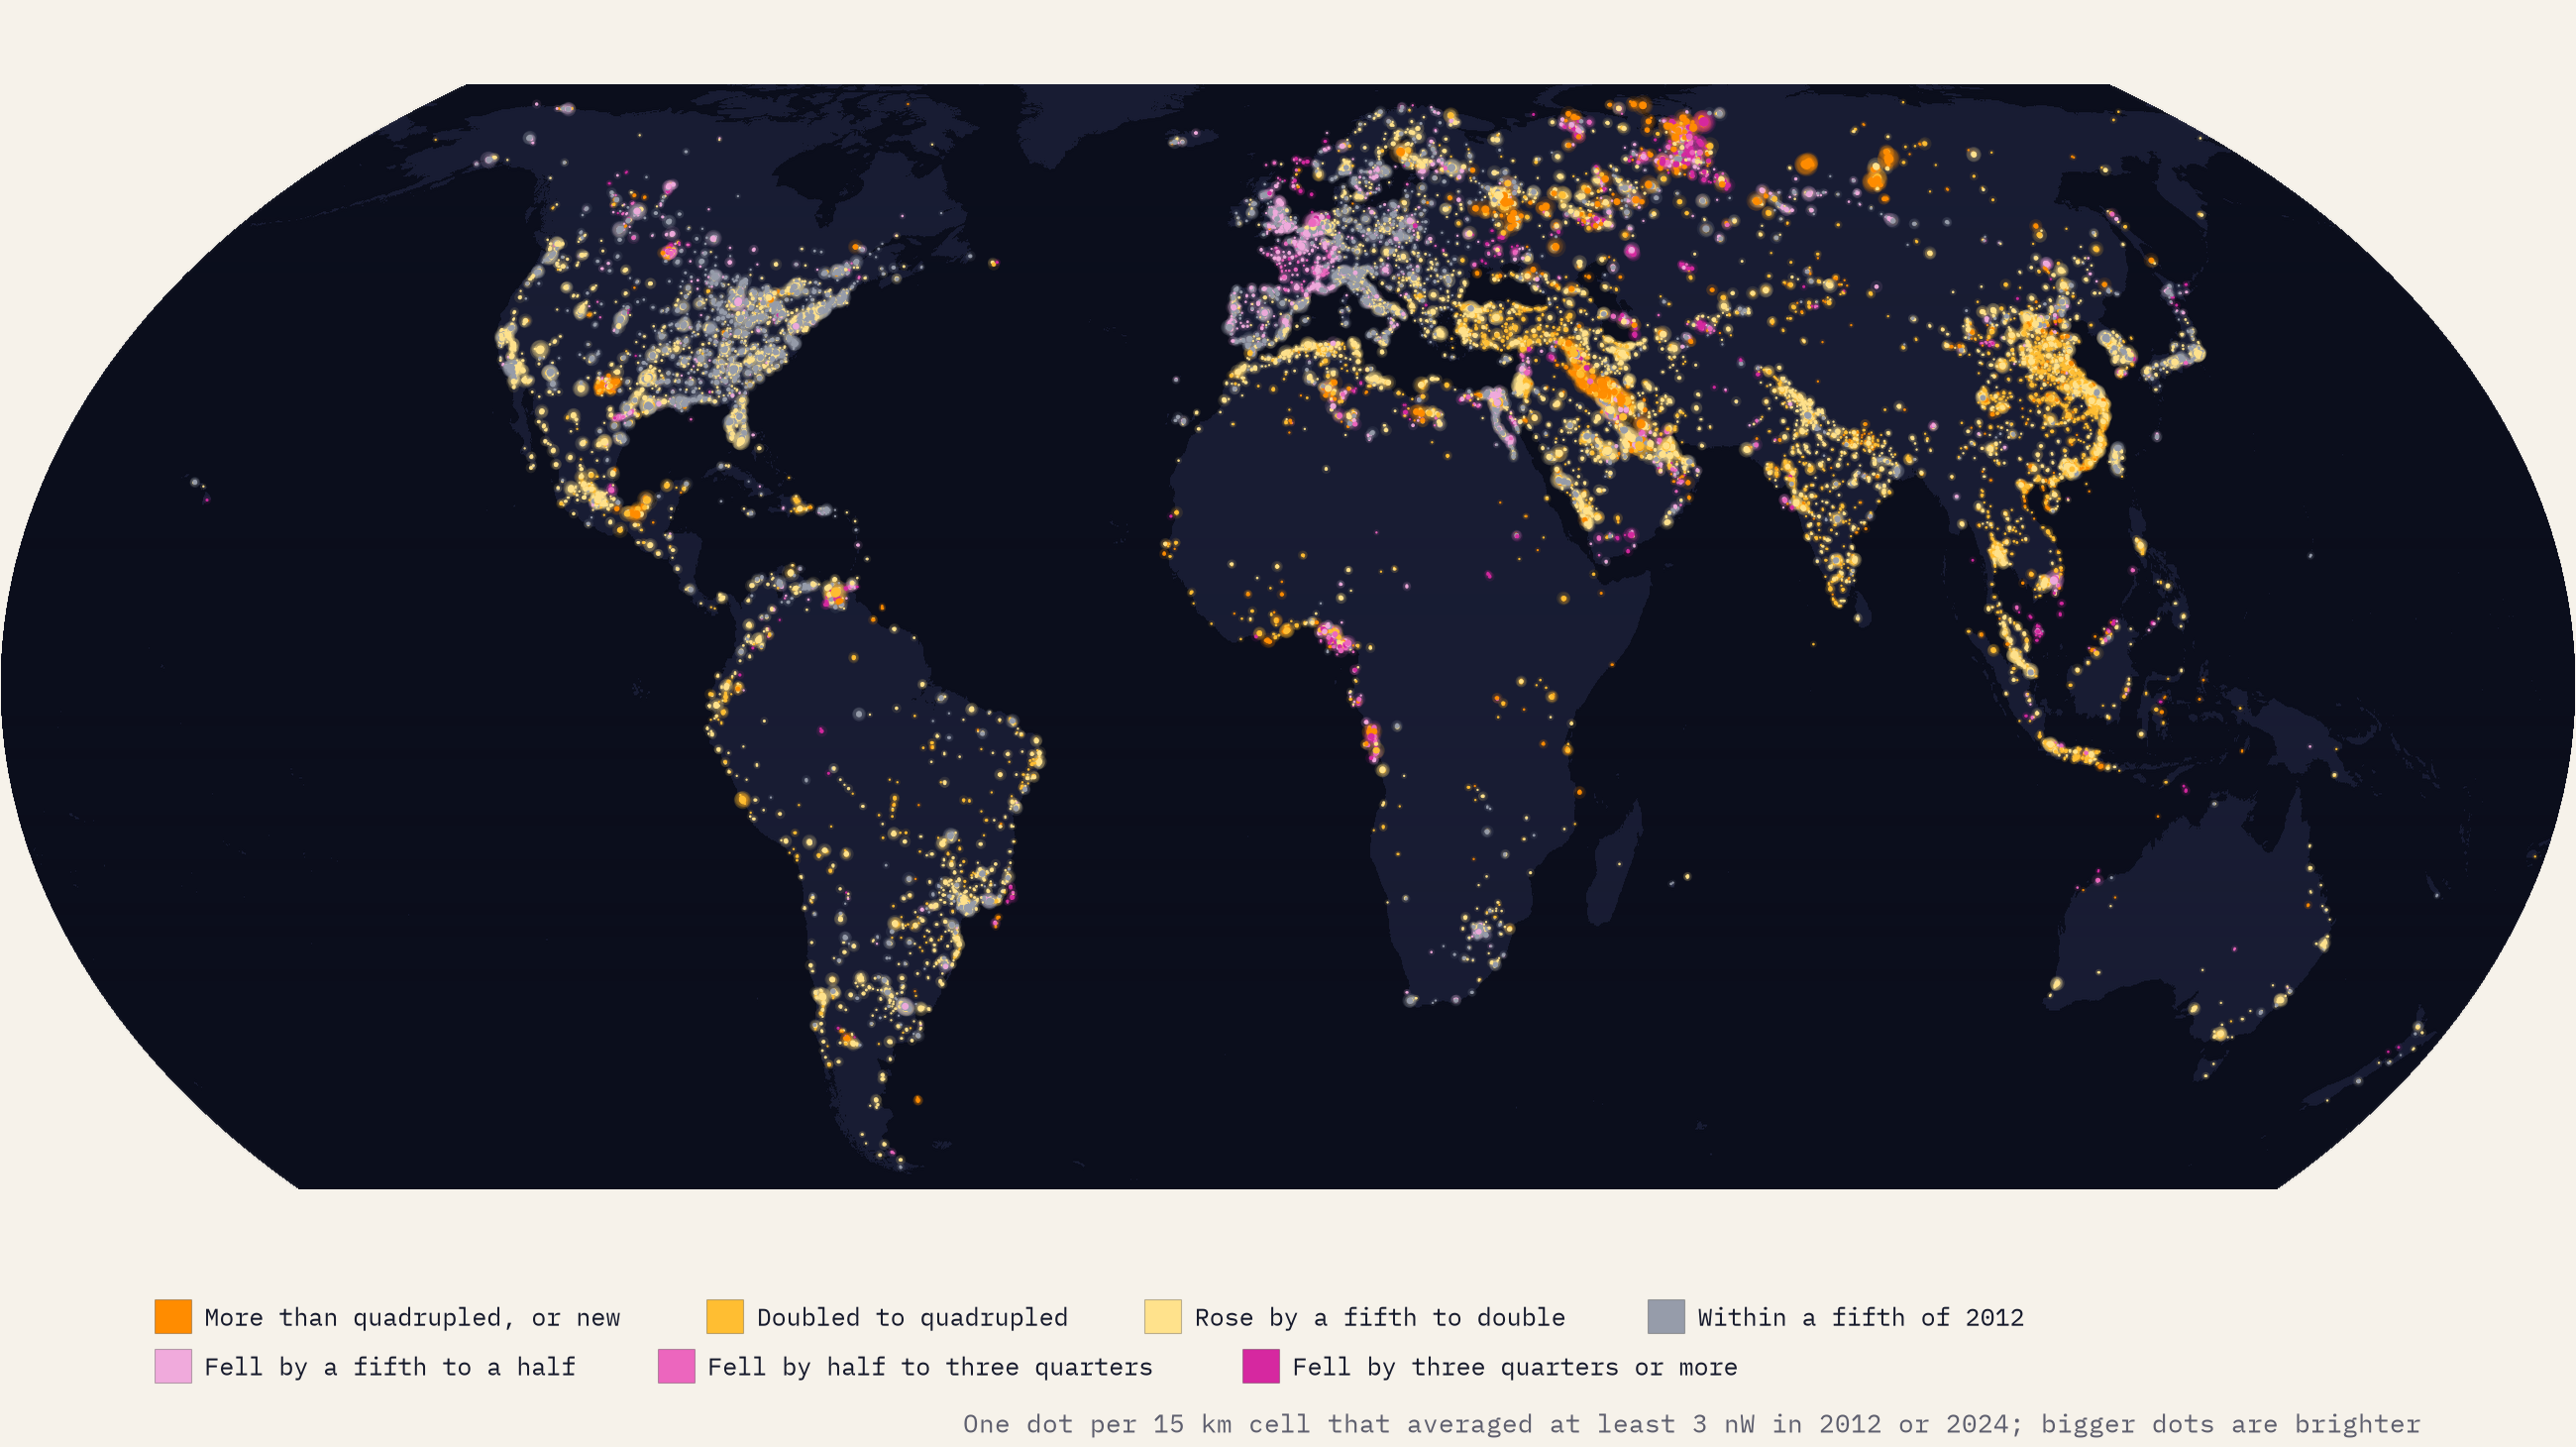
Add up all the light and the Earth gave off 52.3 million light units in 2024 against 33.2 million in 2012, a rise of 57%. Single years are noisy, so I also compared the average of the first three years with the last three: that gives 41%. The total fell from one year to the next only three times, in 2014, 2015 and 2020. The lit area grew even faster, from 9.3 million to 15.1 million km² of land averaging at least one unit, up 61%.
The light is moving east and south. North America’s share of the world’s light fell from 24.2% to 18.7% and Europe and Central Asia’s from 26.6% to 22.7%, while East Asia’s rose from 14.7% to 18.1% and South Asia’s from 4.5% to 7.4%. China’s light more than doubled and India’s grew 2.7 times; between them they gave 26% of all the extra light on the planet.
Where the world lit up
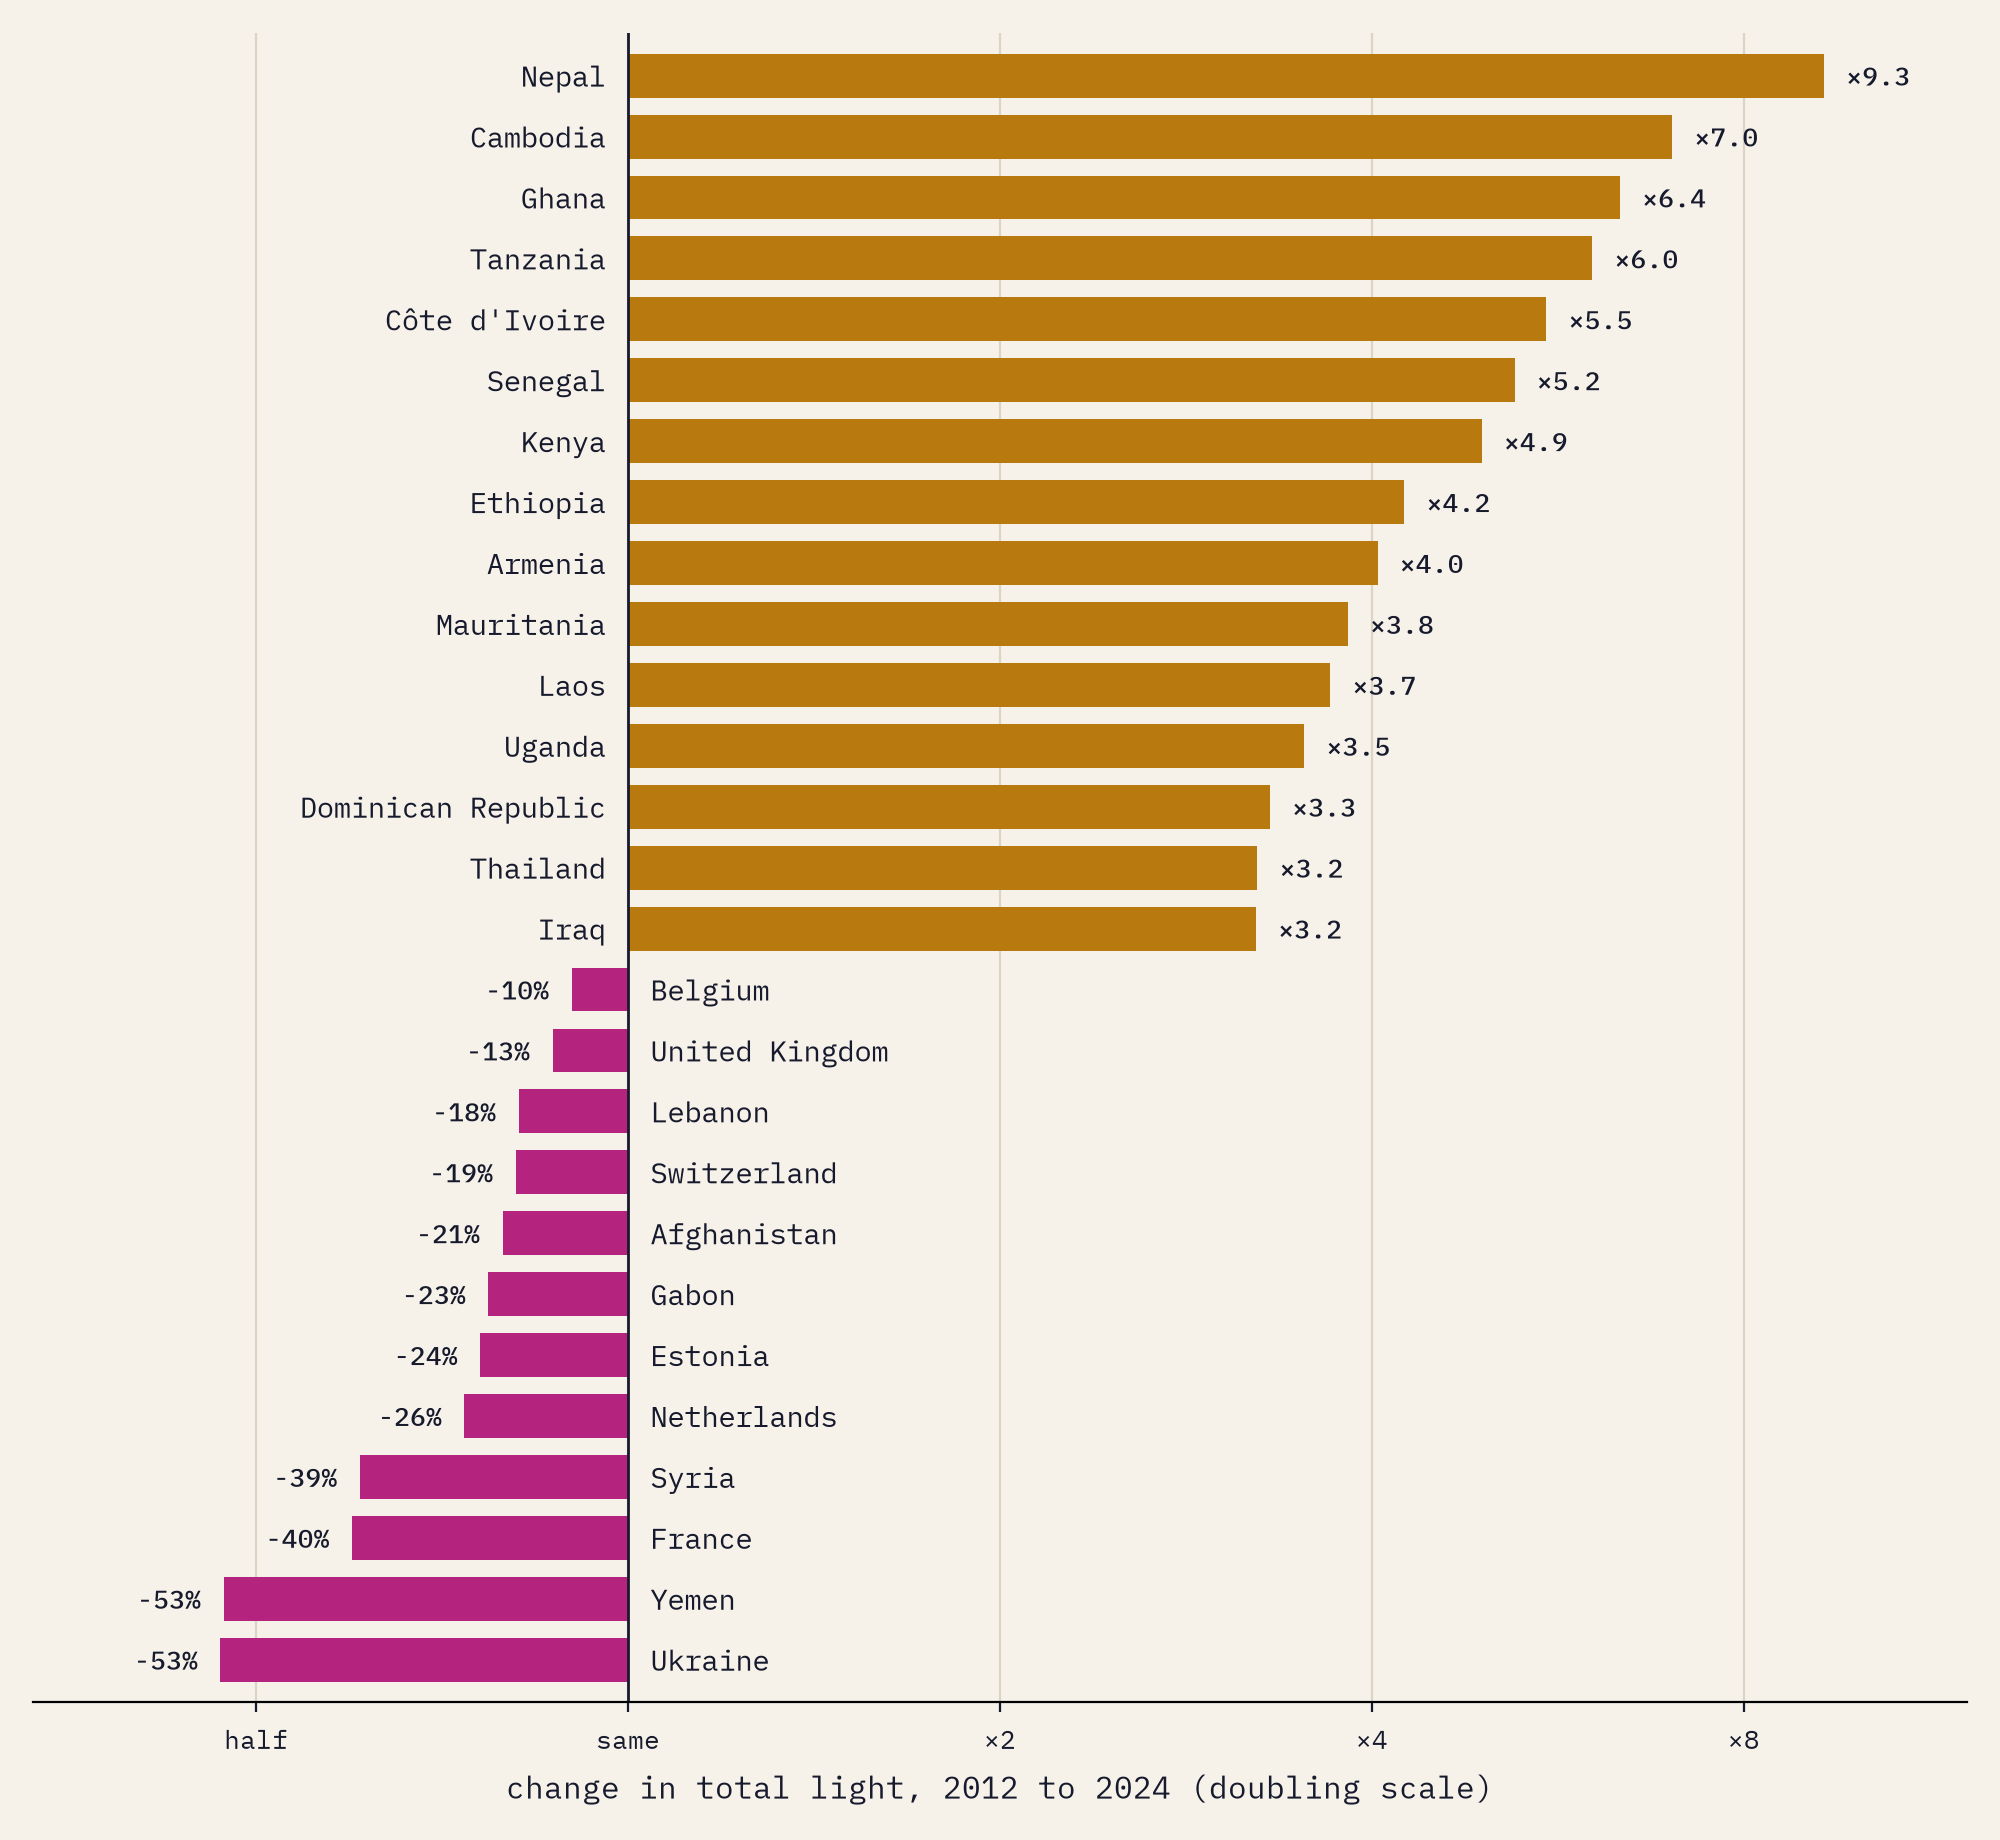
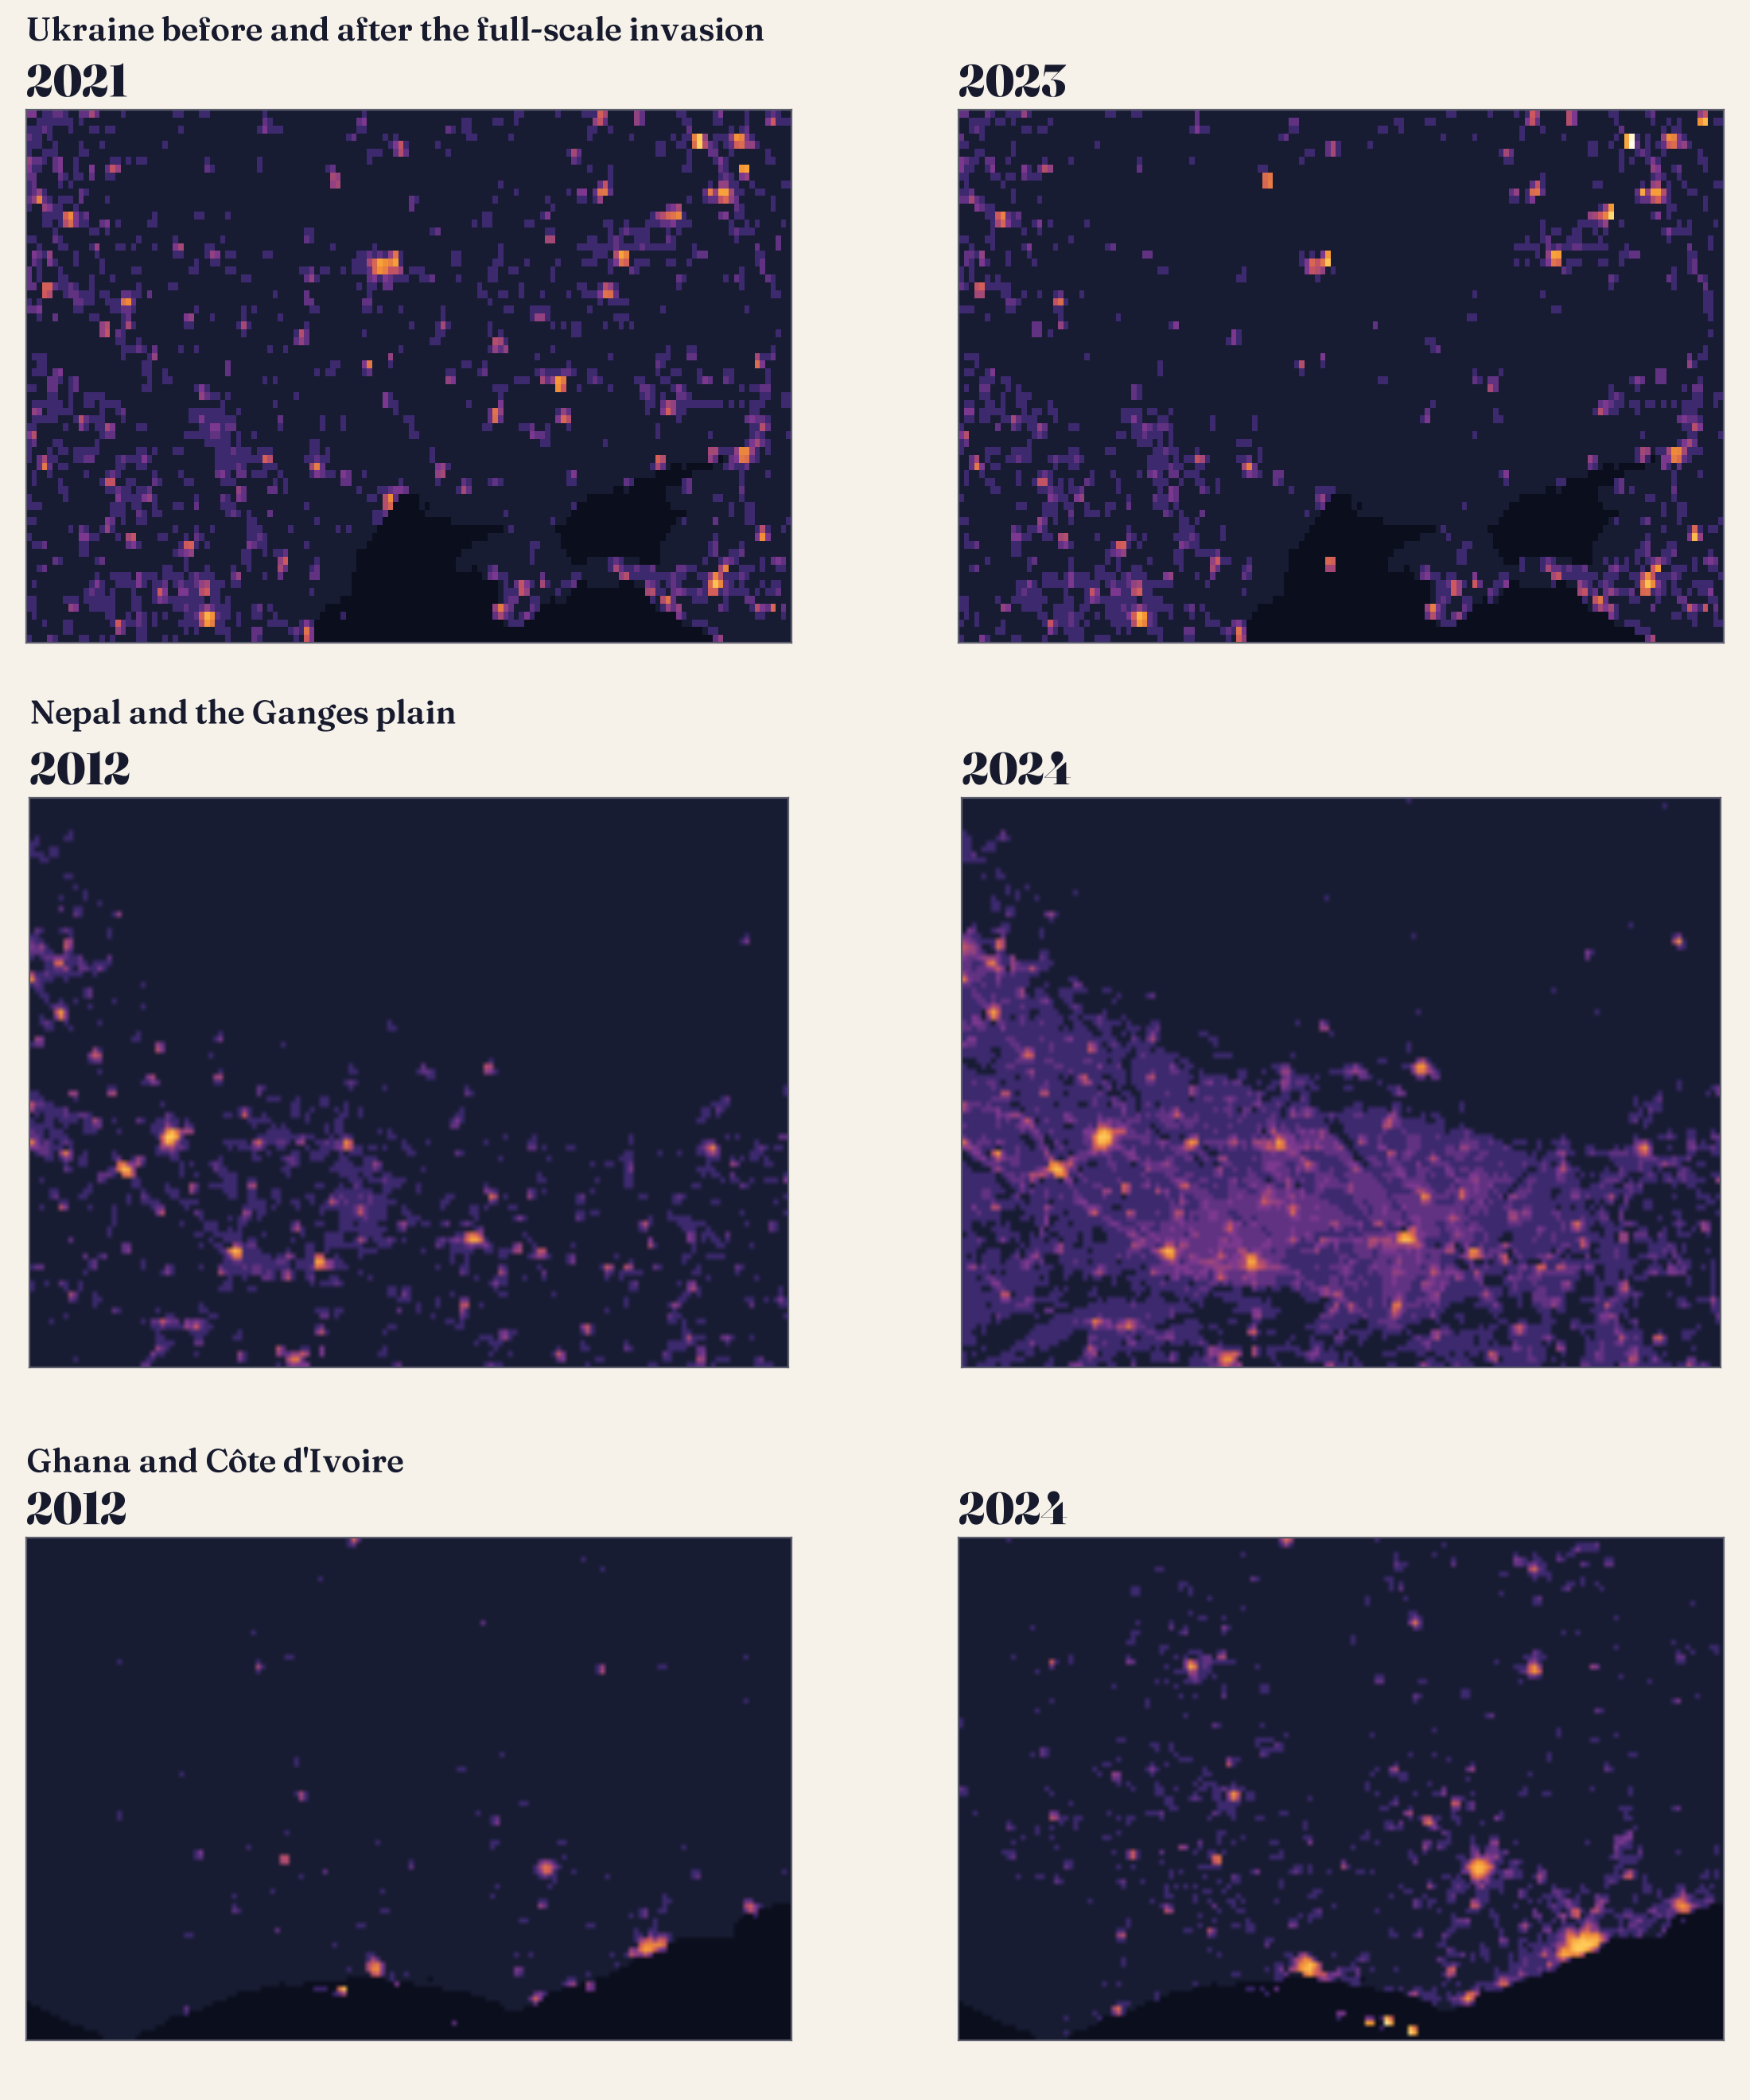
The fastest risers started from very little. Nepal’s light grew 9.3 times: in 2012 the country lived with power cuts of many hours a day, which came to an end between 2016 and 2018, and Kathmandu’s light grew 4.9 times. Then come Cambodia (7.0 times), Ghana (6.4), Tanzania (6.0), Côte d’Ivoire (5.5), Senegal (5.2), Kenya (4.9) and Ethiopia (4.2). Of the 141 countries with at least a million people, 47 at least doubled their light.
Africa’s cities stand out. Kumasi’s light grew 4.4 times, Addis Ababa’s 3.6, Accra’s 3.3, Dar es Salaam’s 3.0 and Abidjan’s 3.0. Night light follows electricity and economic life loosely, so this is a sign of new grids, roads, homes and businesses, not a measure of any one of them. And the continent still has a long way to go: sub-Saharan Africa is home to 14% of the world’s people but gives off only 2.6% of its light.
Where it went dark
Only 17 of those 141 countries gave off less light in 2024 than in 2012, and the satellite cannot tell you why. Three very different things lie behind the falls.
The steepest are wars. Ukraine’s light fell by 73% between 2021 and 2022, the year of the full-scale invasion and the attacks on its power grid, and Kharkiv lost 98% of its light. Aleppo lost 97% between 2012 and 2015, Sanaa 95% between 2013 and 2016, and Khartoum 77% between 2022 and 2024, after fighting broke out in the city. Mosul’s light fell by 70% after it was taken by the Islamic State group in 2014, and has since grown to 4.1 times its 2012 level.
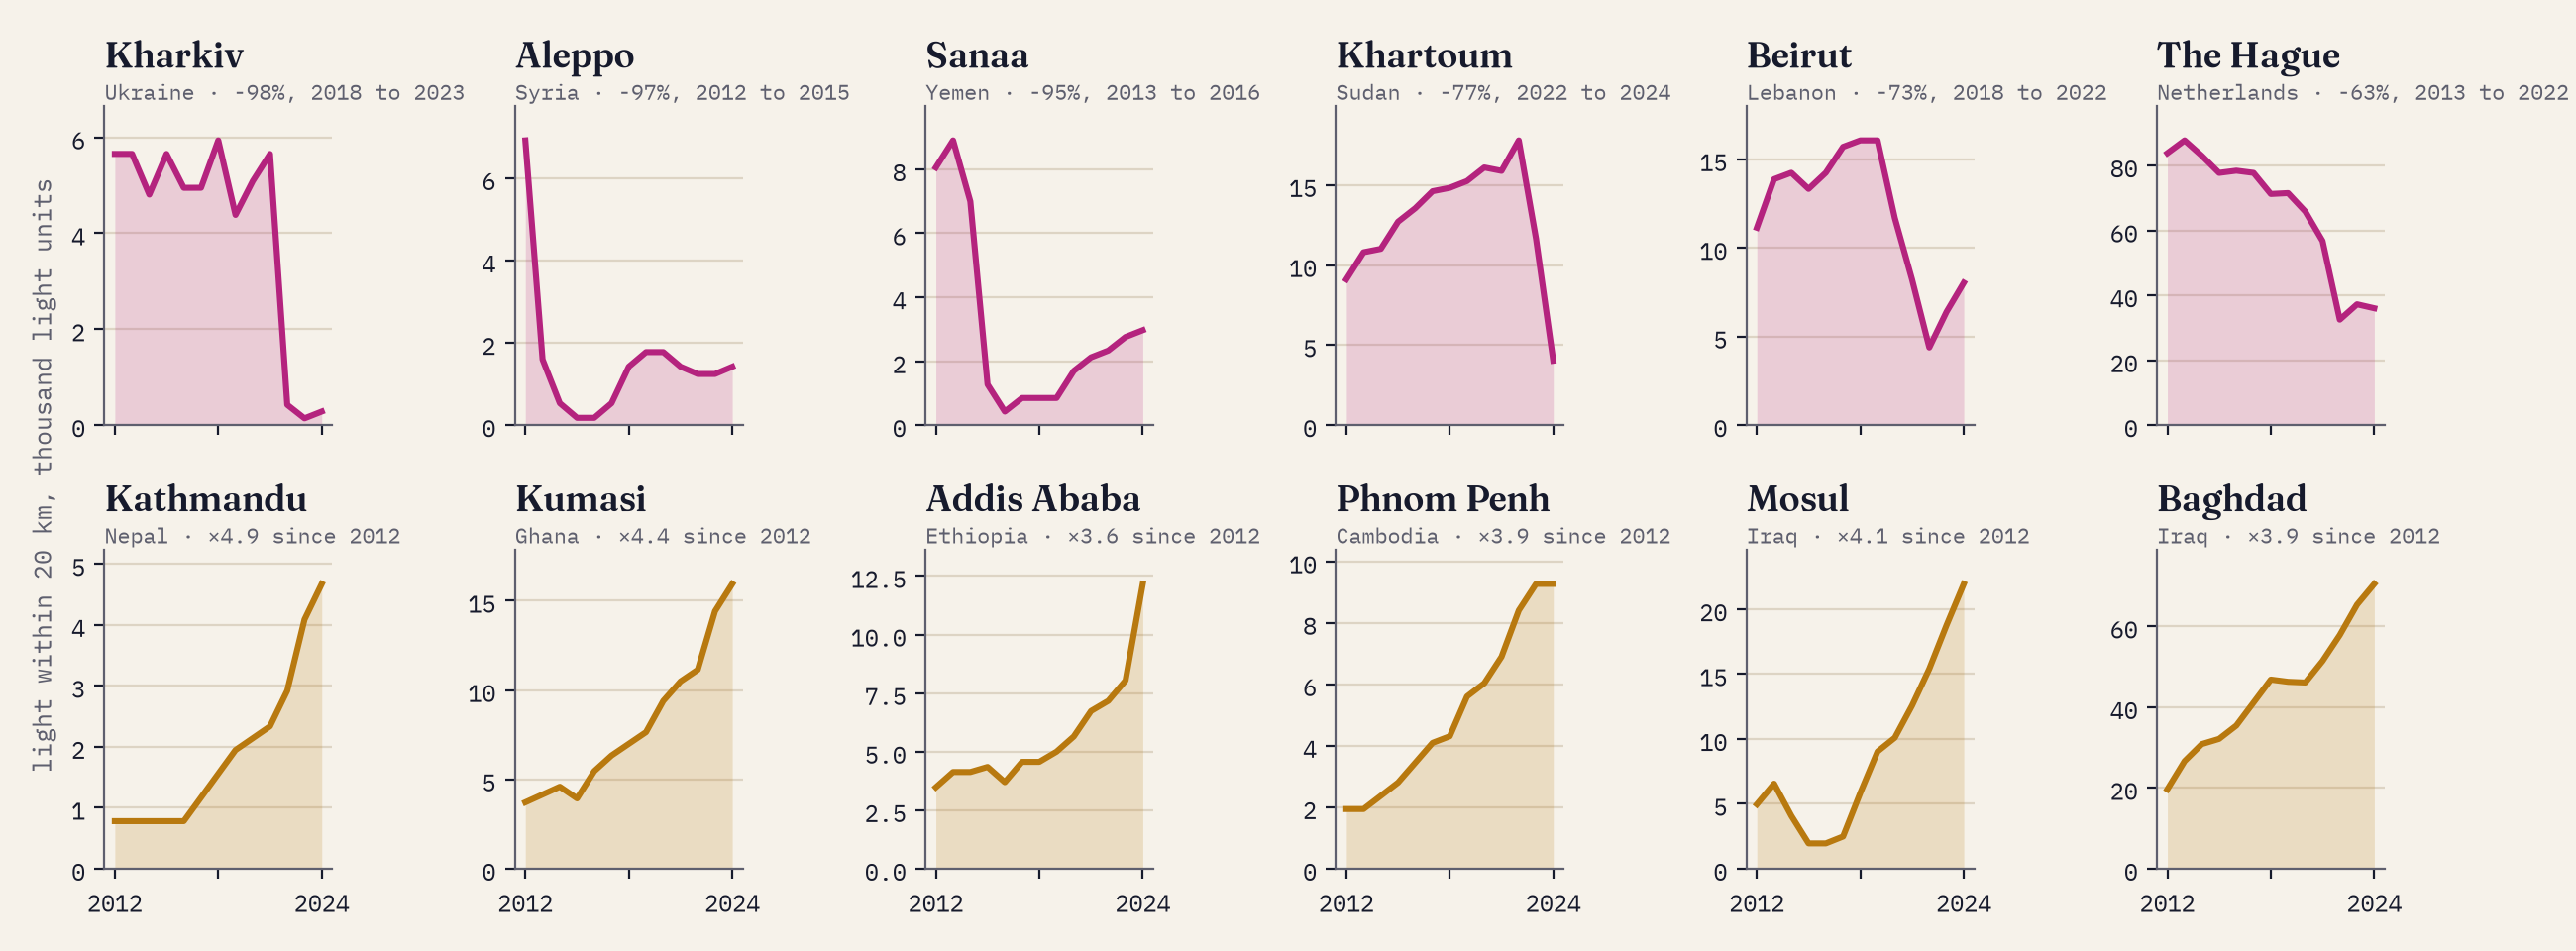
Some countries dimmed without a war. Lebanon lost 71% of its light between 2019 and 2022, as an economic collapse left its power company short of fuel. Venezuela lost 41% between 2014 and 2020, through an economic crisis and the great blackouts of 2019, and then recovered, though about half of its measured light in 2024 came from gas flares at the oil fields of Monagas.
Darker from space does not always mean darker on the ground.
The third kind of dimming surprised me most. France gave off 40% less light in 2024 than in 2012, the Netherlands 26% less and the United Kingdom 13% less; Paris and London each lost about a quarter. Nothing like that happened on their streets. Towns have been swapping orange sodium lamps for white LEDs, and the satellite cannot see blue light, so an LED street looks dimmer from space even when it is as bright or brighter to the eye. And the satellite passes at half past one in the morning, when more and more towns now switch their lights off; France’s energy-saving rules of 2022 also put out lit advertising after one. Around The Hague and Rotterdam the fall is mostly the vast greenhouses of the Westland, which cut their lighting when gas prices soared in 2022. People who count the stars from the ground report that the night sky has been getting brighter, not darker.
Light per person
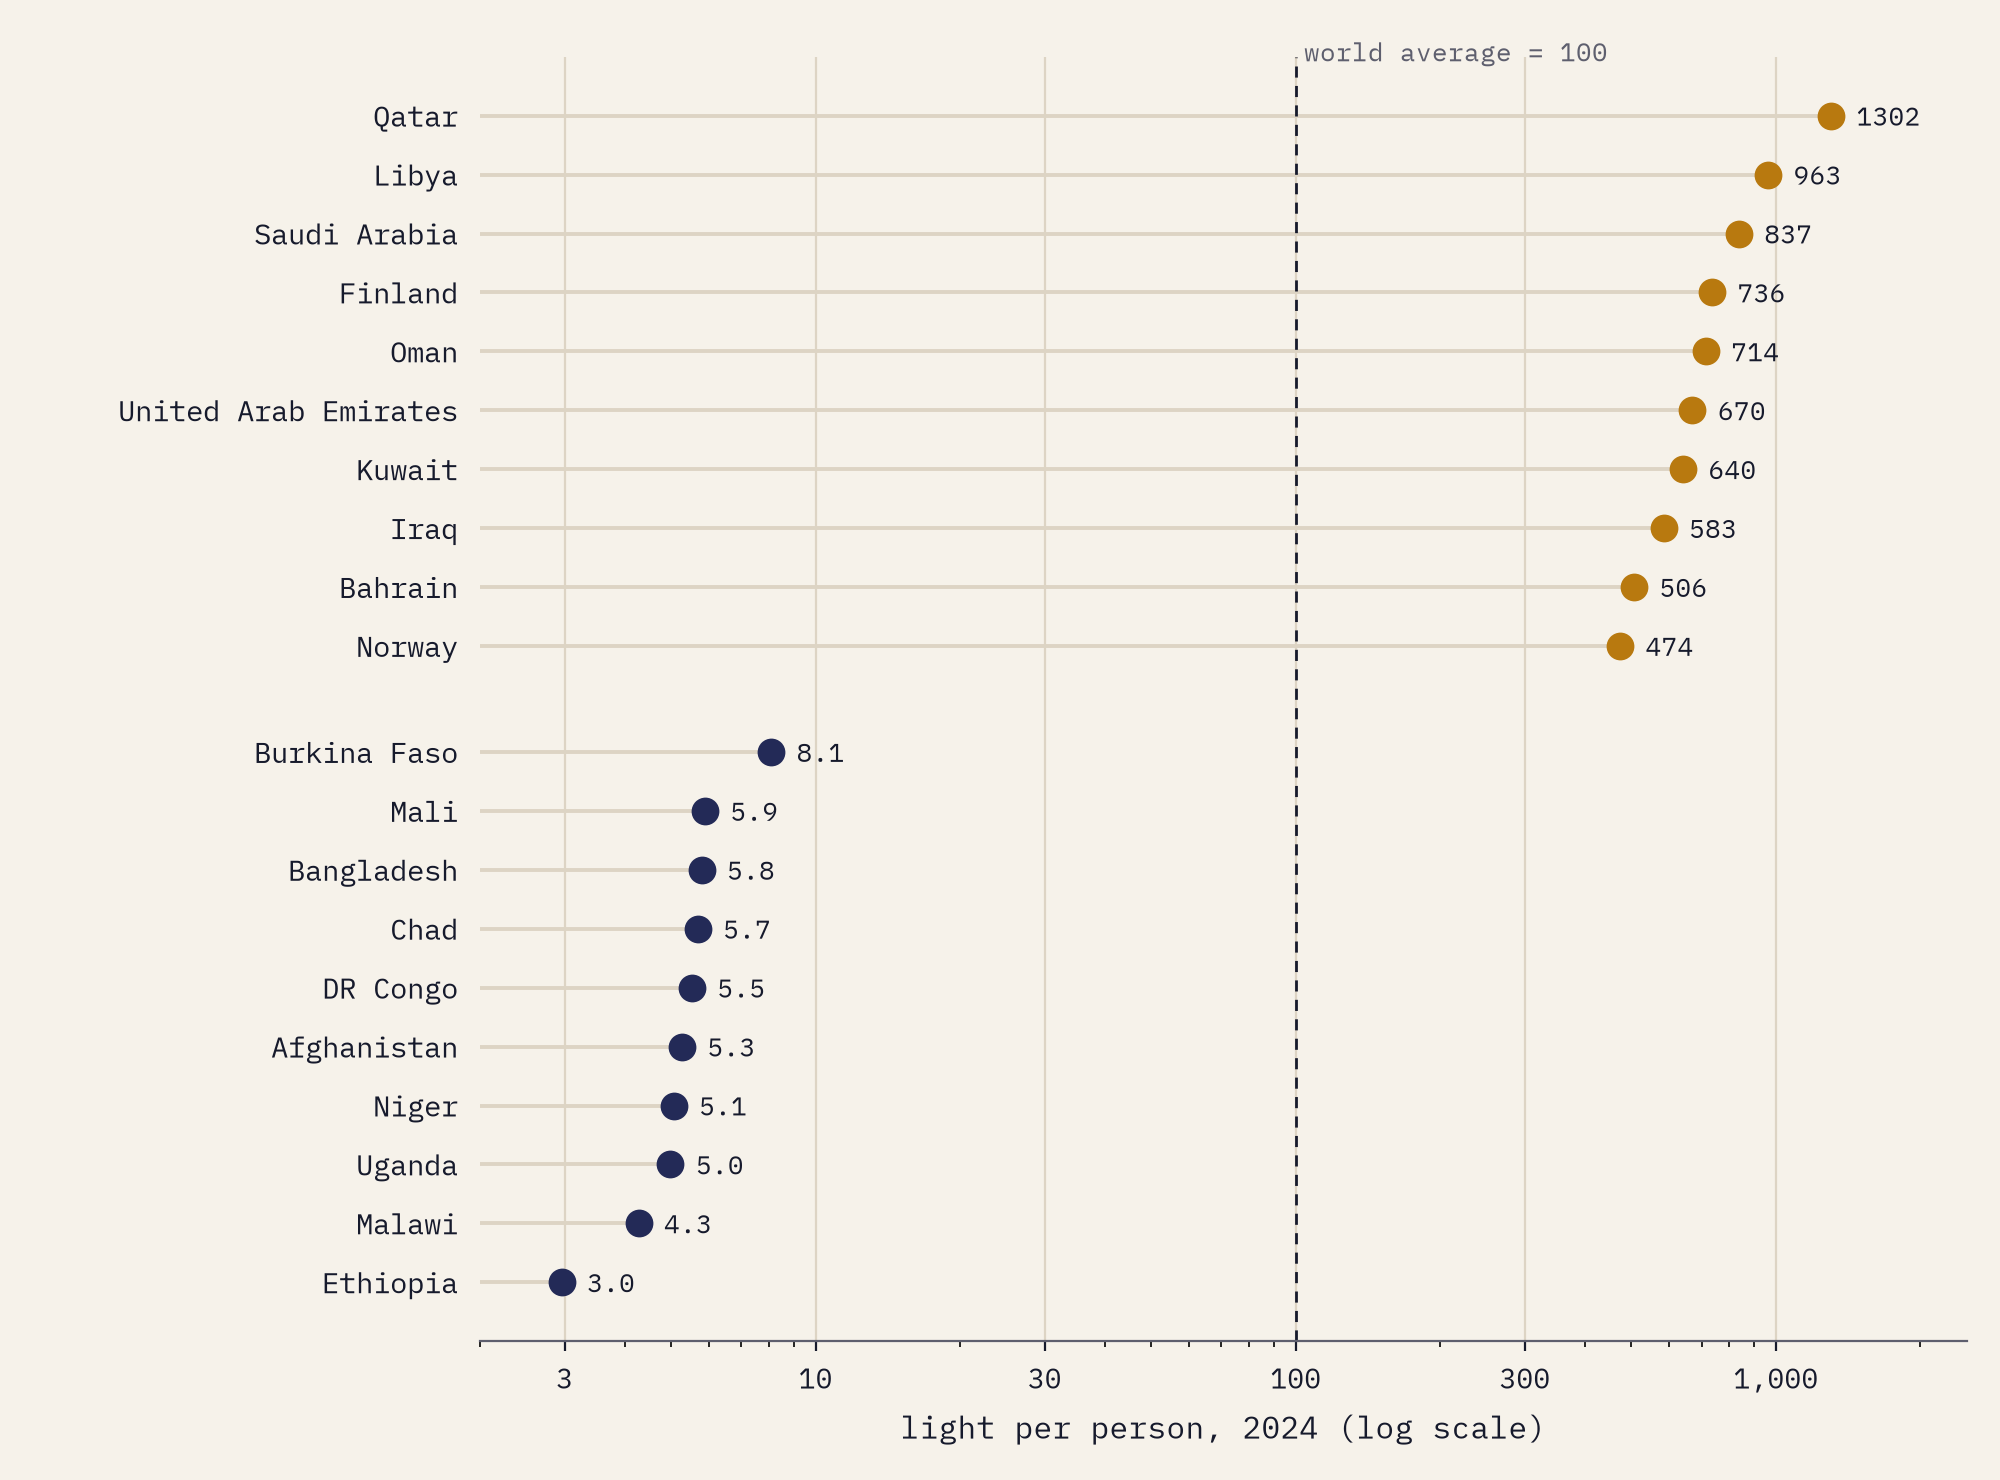
Divide each country’s light by its people and set the world average to 100. Qatar scores 1,302, the United States 396, China 58, India 37 and Ethiopia 3.0. The average North American has more than 21 times as much light seen from space as the average person in sub-Saharan Africa.
How I did this
I used the overview levels built into Hengl’s files: about 15 km for every year and 7.4 km for 2012 and 2024. One quirk had to be fixed first: in this release the layers for 2022 to 2024 are stored in whole nanowatts but the earlier ones in tenths, so I put every year on the same footing and rounded them alike. Each cell belongs to the Natural Earth country holding most of its land; city light is the sum within 20 km of the city’s point; populations are Natural Earth’s estimates for about 2019. Gas flares count as light, LEDs are under-counted, and part-night lighting hides light from the 1.30 am pass, so these are measurements of what the satellite sees, not of how lit anyone’s street is. The paper sets out every step and caveat.
Notes and sources
- Annual VIIRS Night Lights (VNL) V2, Earth Observation Group, Payne Institute for Public Policy, Colorado School of Mines: Elvidge, Zhizhin, Ghosh, Hsu and Taneja (2021), Remote Sensing 13(5), 922.
- Hengl, T. (2025) Annual time series of global VIIRS nighttime lights for 2000 to 2024 at 500 m, Zenodo, CC BY 4.0. The years before 2012 are extrapolated by logistic regression. The long-term DMSP-style layer follows Li, Zhou, Zhao and Zhao (2020), Scientific Data 7, 168.
- Natural Earth countries, populations and populated places. Public domain.
- Further reading: Henderson, Storeygard and Weil (2012), American Economic Review, on night lights and economic growth; Kyba and others (2017), Science Advances, on the growth of lit area; Kyba and others (2023), Science, on the brightening sky seen by citizen scientists; Li and Li (2014), International Journal of Remote Sensing, on night lights and the Syrian war.
- I wrote the text, with drafting and editing assistance from Claude (Anthropic), which also helped prepare the analysis code. I reviewed and checked all text and results.

