
Tag: Animated timeline
-
Shipwrecks of the world, and how many over time
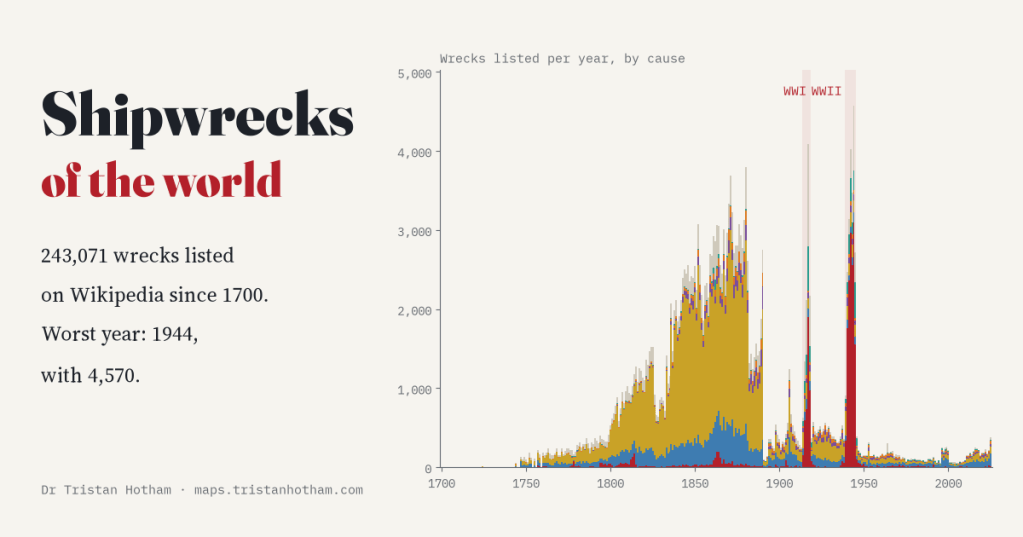
Wikipedia lists 243,071 shipwrecks since 1700. I counted them year by year: three of the five worst years are war years, with 1944 the worst. The huge 1800s plateau owes a lot to British newspapers.
-
Who held the map? Twelve centuries of the world in flags
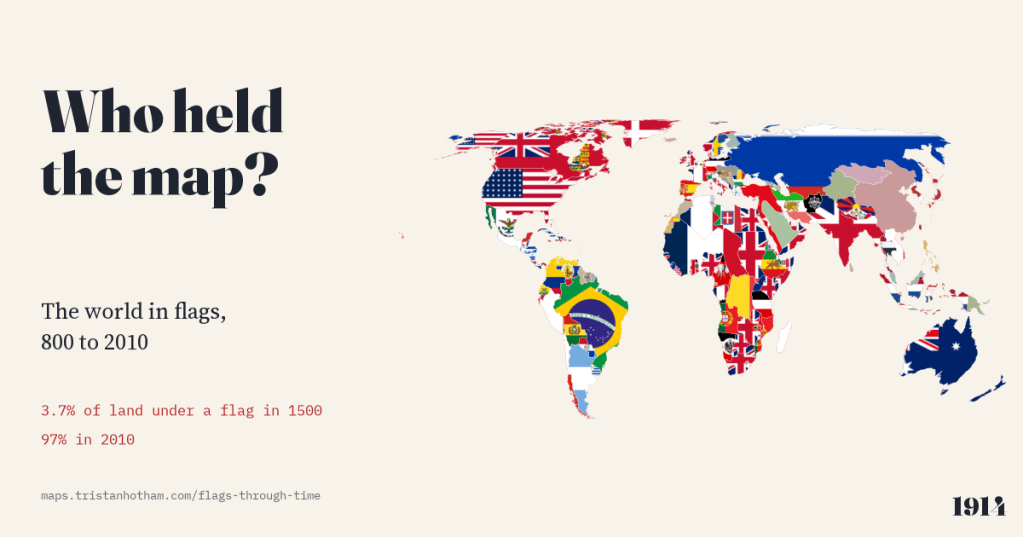
The world map from 800 to 2010, each piece of land filled with the flag of whoever held it. In 1000 no land can honestly be shown with a flag; in 1500, 3.7%; by 2010, 97%.
-
The plague years: five centuries of plague, mapped year by year
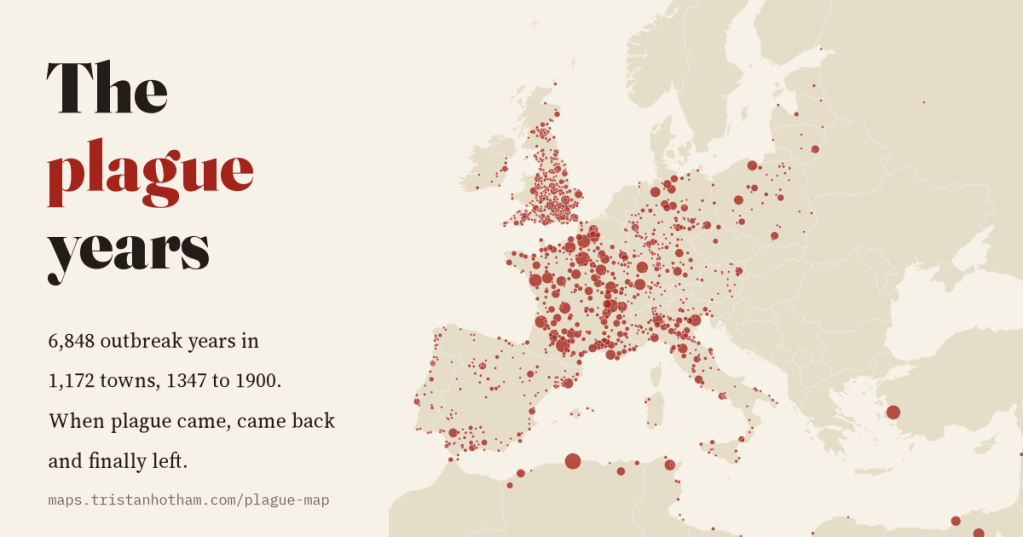
6,848 recorded outbreak years in 1,172 towns, from the Black Death in 1347 to Porto in 1900: how plague spread, kept coming back about every 13 years, and left Europe a century before the Ottoman Mediterranean.
-
Styles in stone: the world’s architectural styles on a map, century by century
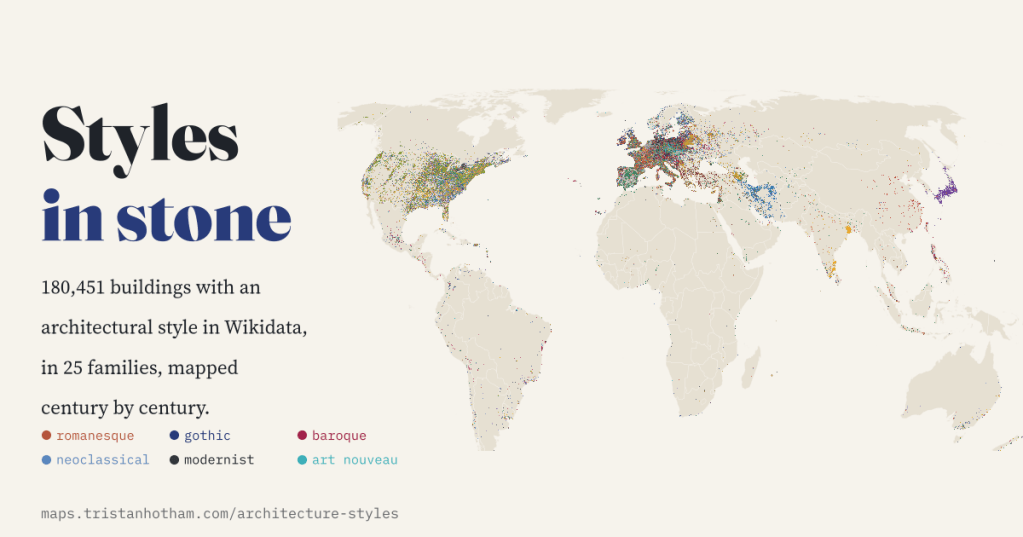
180,451 buildings with an architectural style in Wikidata, sorted into 25 families and mapped through time. Romanesque gives way to Gothic, Baroque and the revivals, Gothic Revival sails to Toronto and Melbourne, and the gaps show who keeps the records.
-
The Wealth of Nations, Mapped
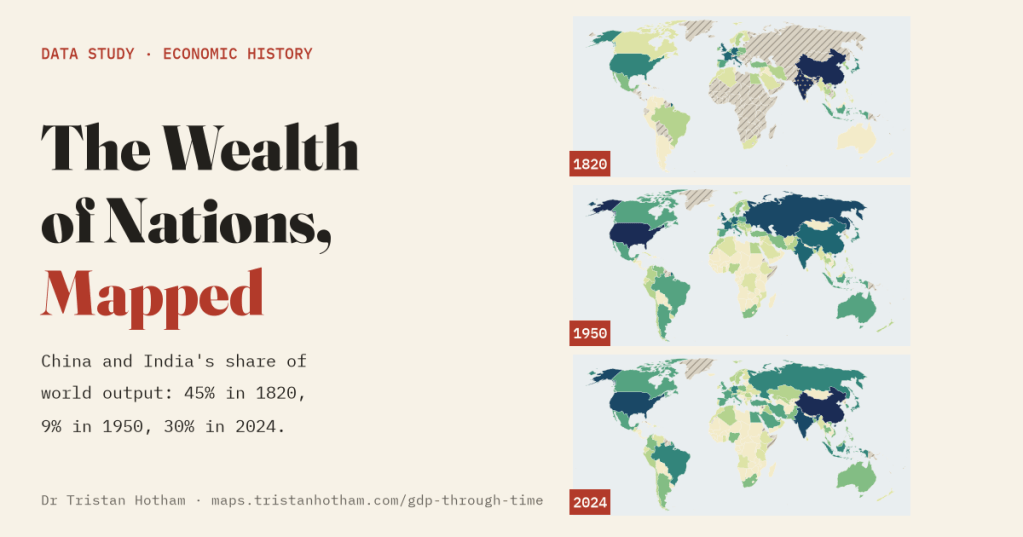
The world economy on one map you can play, from 10,000 BC to 2024. China and India made 45% of the world’s output in 1820, 9% in 1950 and 30% in 2024, and the further back you go the more of the map is guesswork.

