
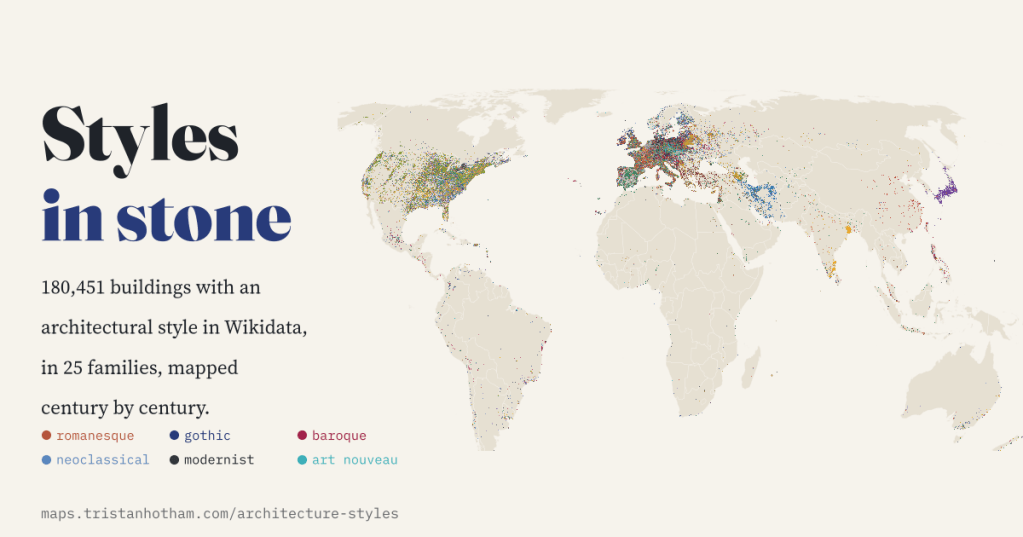
Romanesque, Gothic, Baroque, the great revivals, Art Deco and concrete: I put 180,451 buildings from Wikidata on one map, sorted by style and century. The architecture textbook falls out of the data on its own, and so does a map of who keeps the records.
Walk through almost any old town in Europe and you can read its history in its buildings: a round-arched Romanesque church, a Gothic cathedral, a Baroque palace, a Neoclassical bank with columns, a row of Victorian shops, a concrete car park. Each style belonged to a time and a place, and then travelled. I wanted to see that on a map.
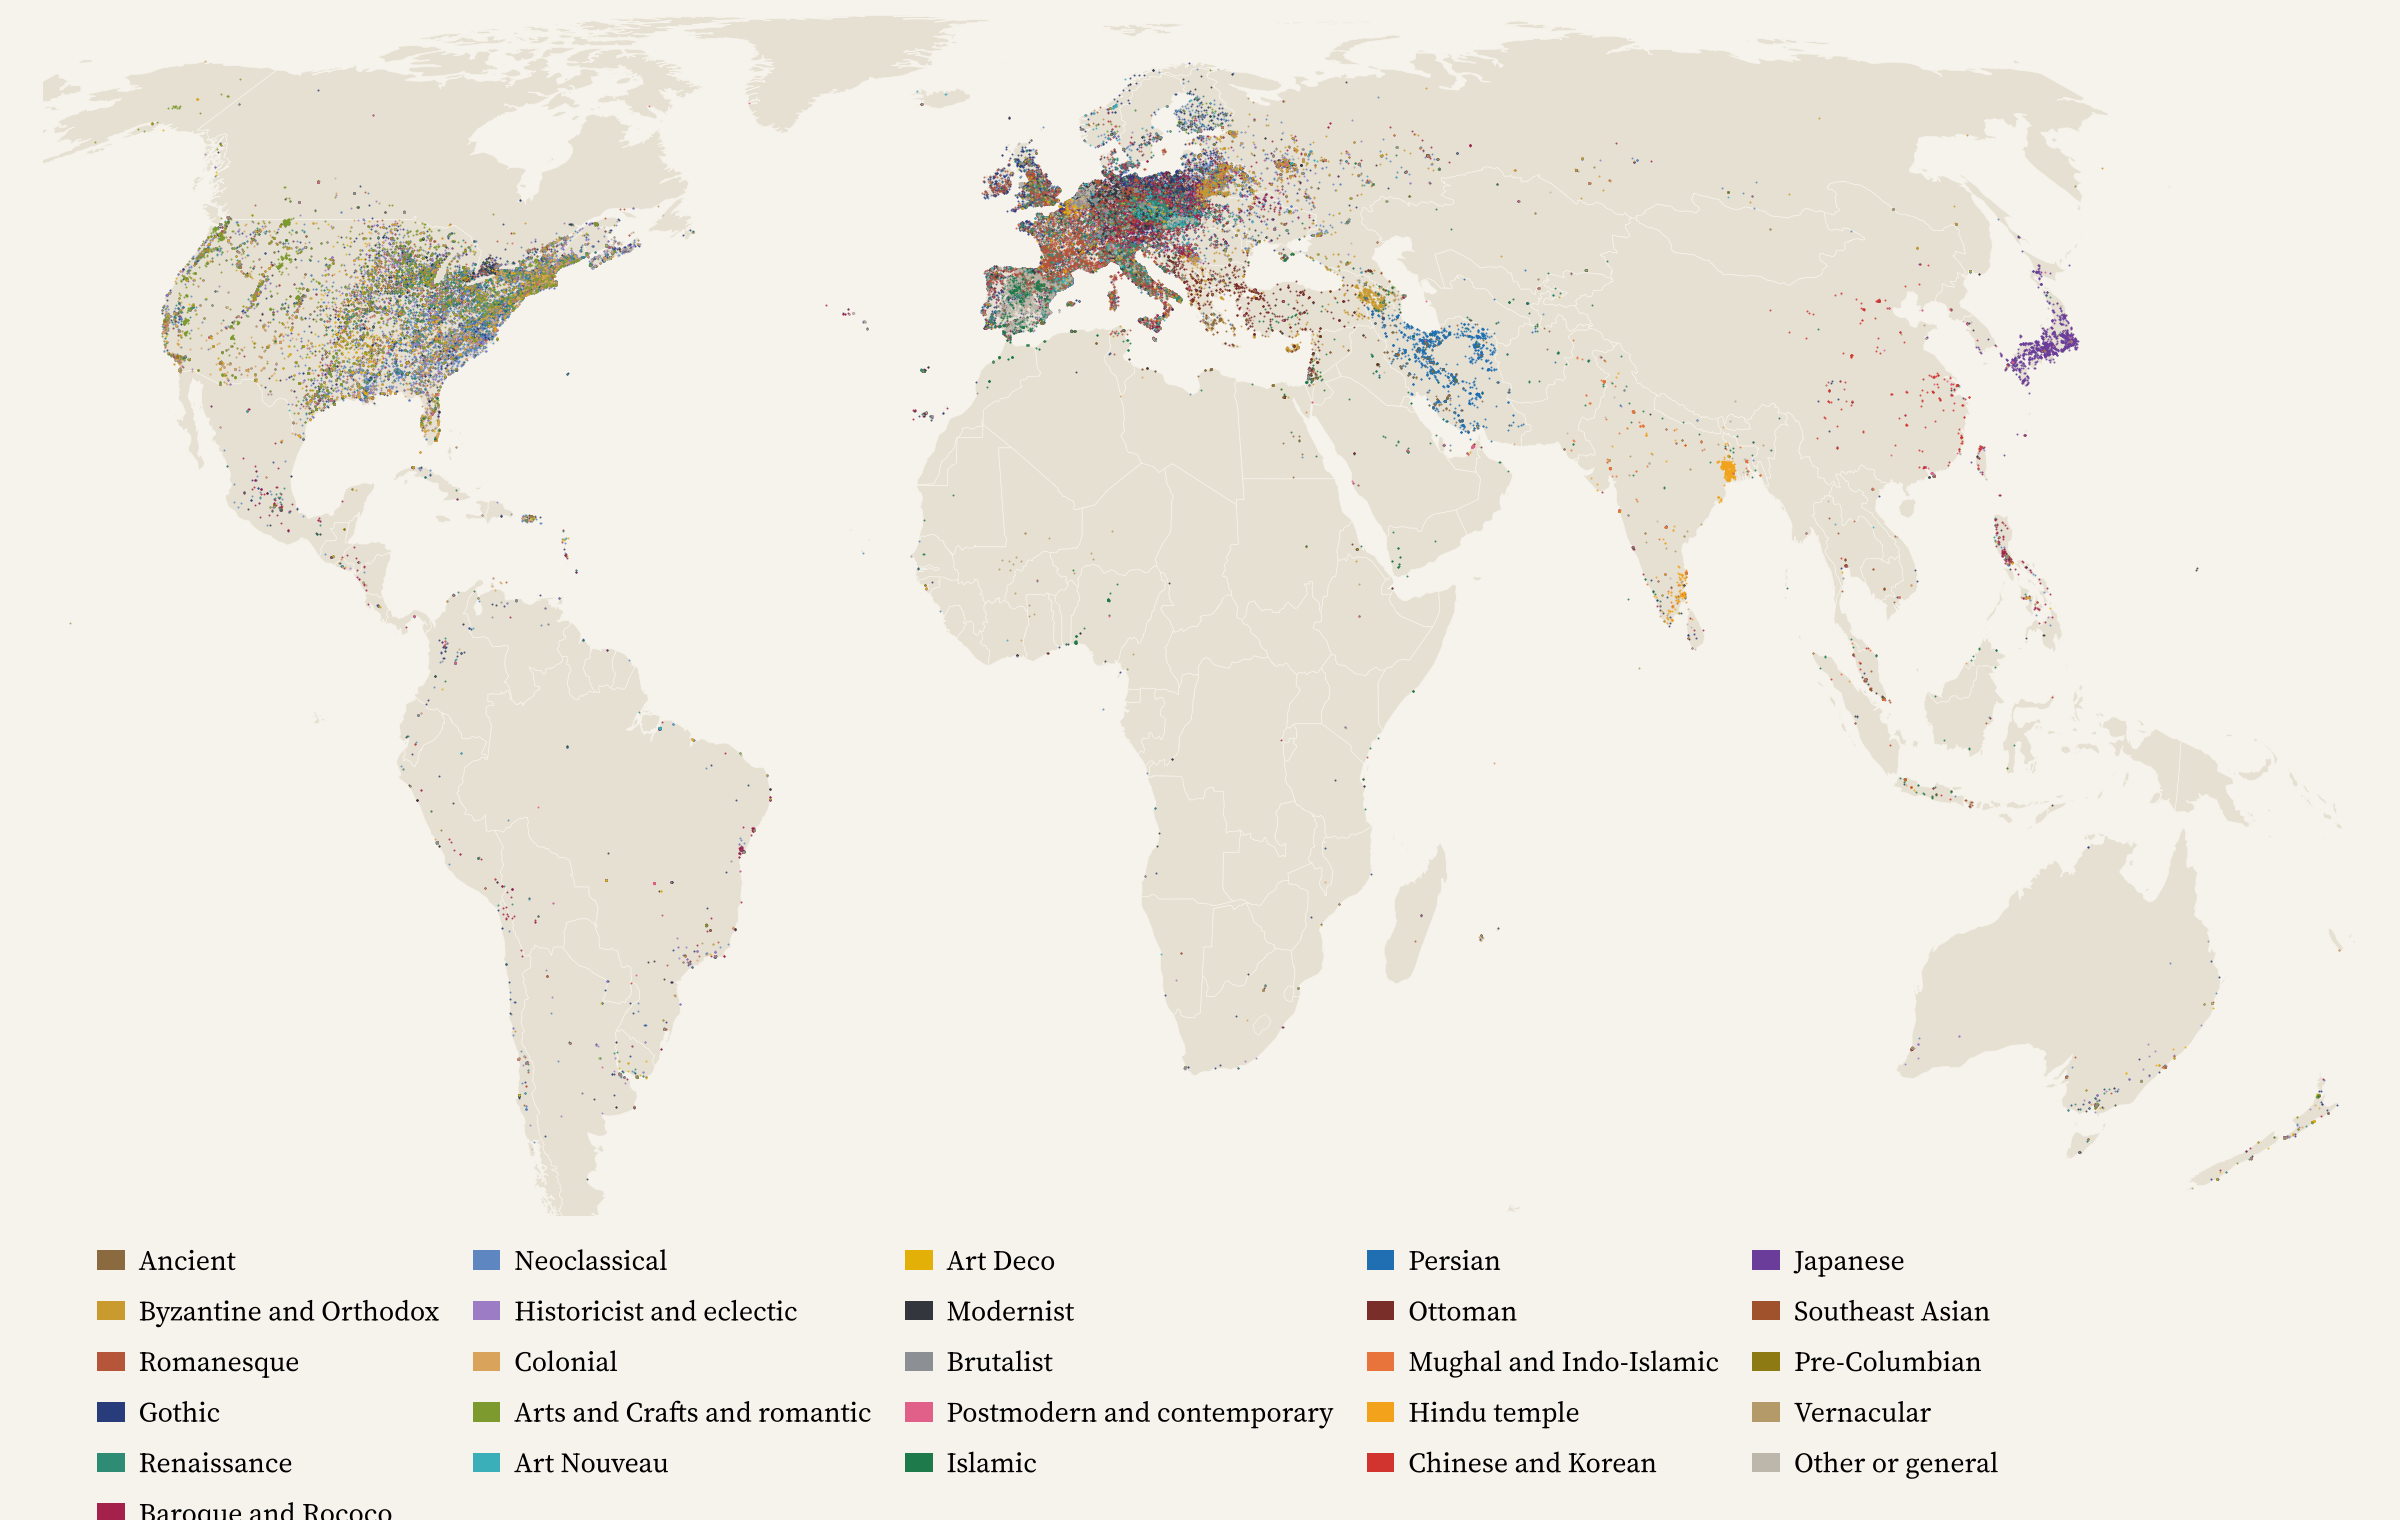
Wikidata, the open database behind Wikipedia, records an architectural style for 180,451 buildings and structures that also have coordinates. Between them they use 1,314 different style labels, from ‘Romanesque architecture’ to ‘zenpō-kōen-fun’, a keyhole-shaped Japanese burial mound. That is far too many to colour a map with, so I sorted them into 25 families by hand, from Romanesque and Gothic to Art Deco, Brutalist, Ottoman, Persian and Japanese, and marked the revivals, where a later age borrowed an older style.
The textbook writes itself
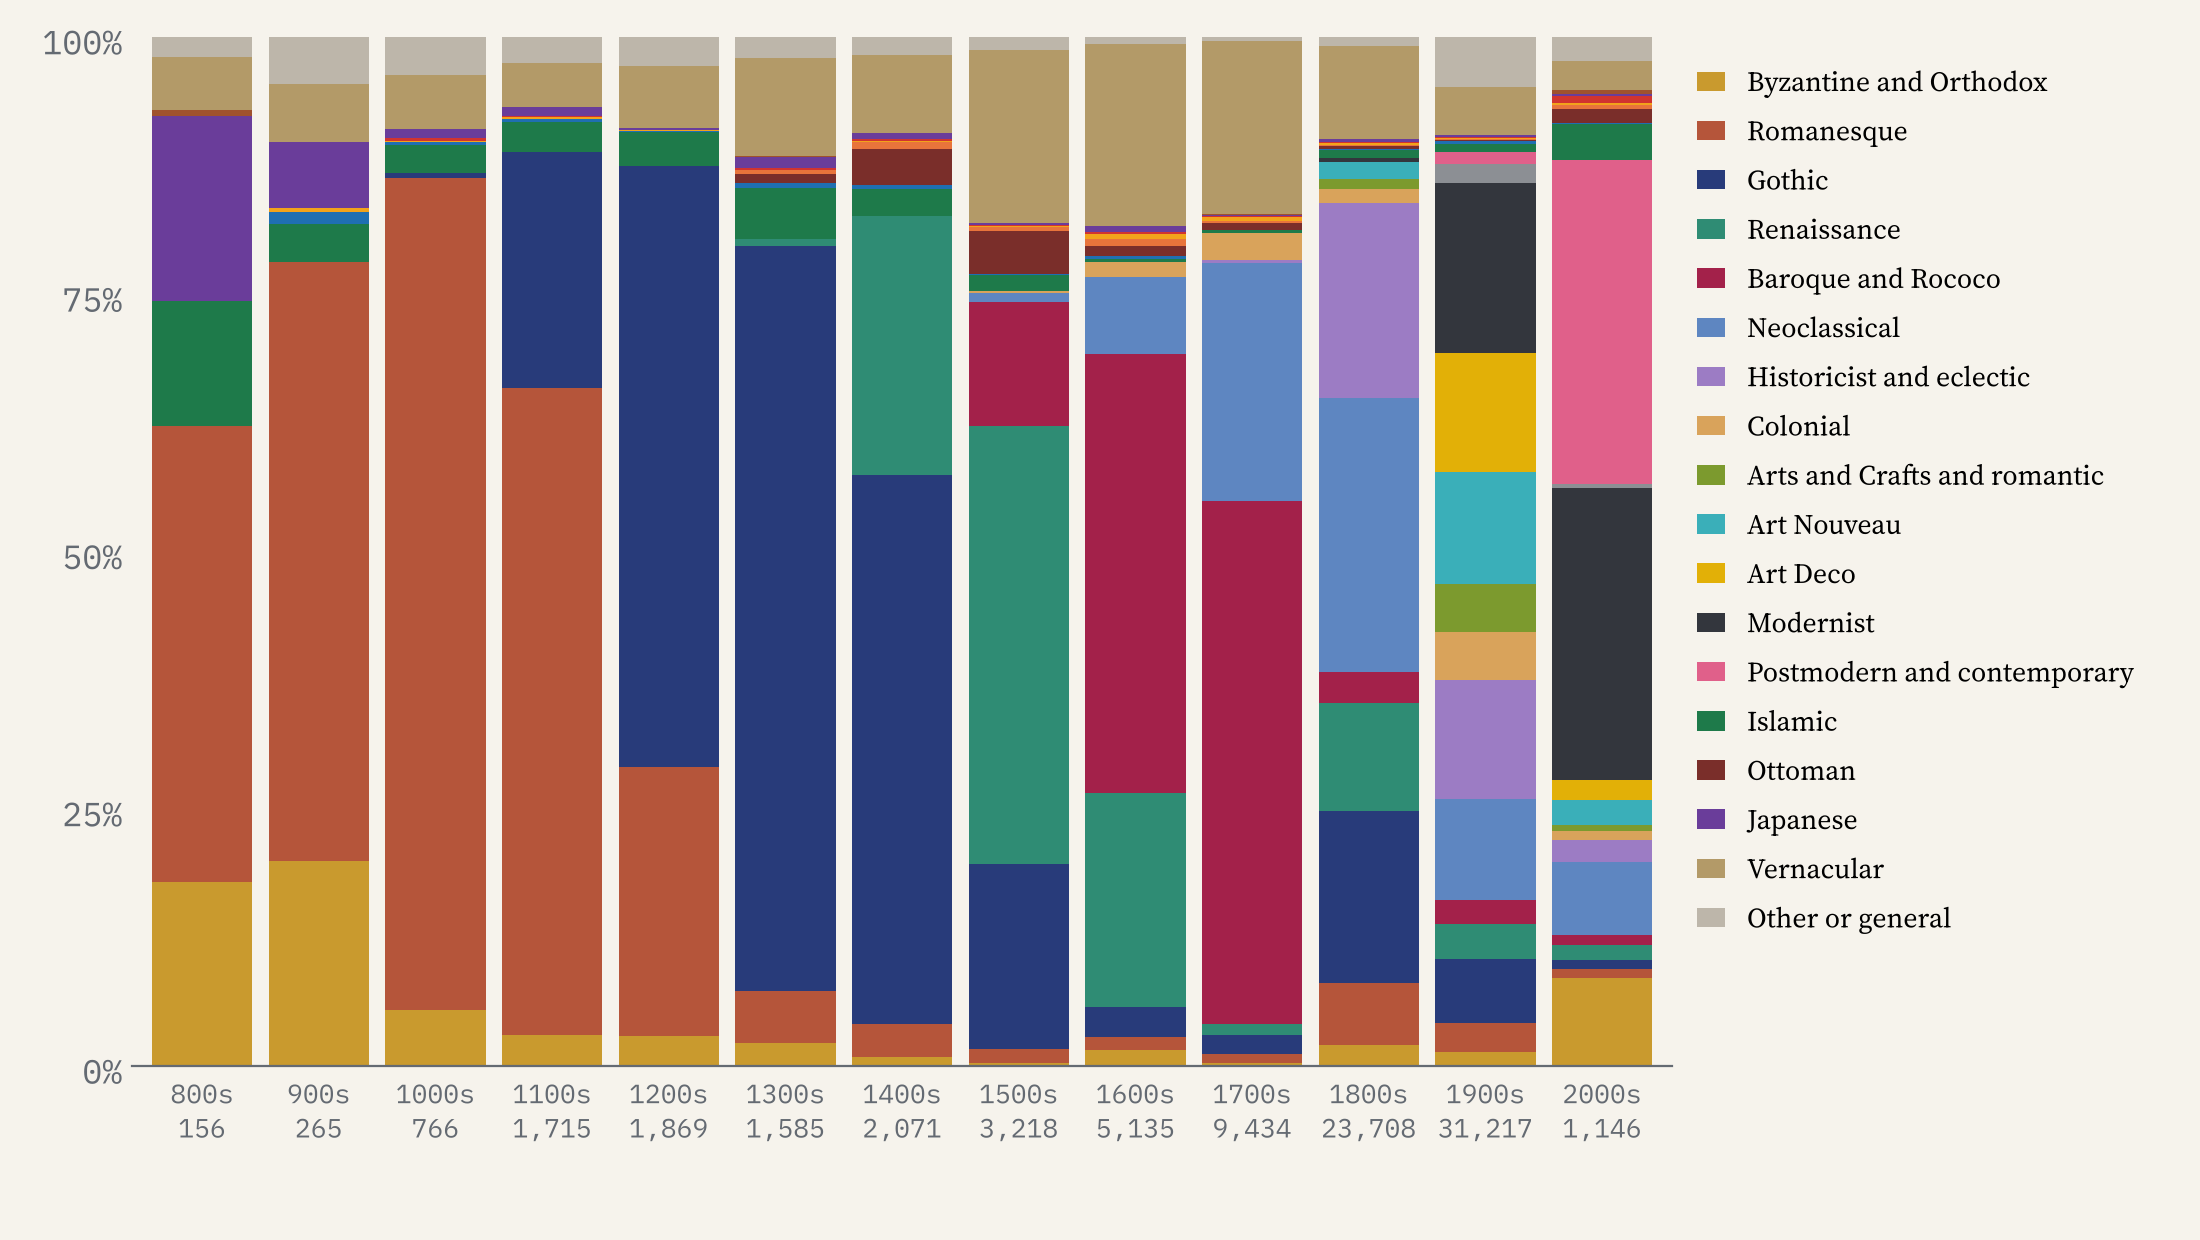
Just under half the buildings (48%) have a date of construction or foundation. Put them in centuries and the sequence every architecture student learns appears without any help. Romanesque is 63% of the dated buildings from the 1100s. Gothic is 72% of those from the 1300s. Renaissance leads the 1500s, Baroque and Rococo the 1600s and 1700s, Neoclassical the 1800s, and modernism, only just, the 1900s.
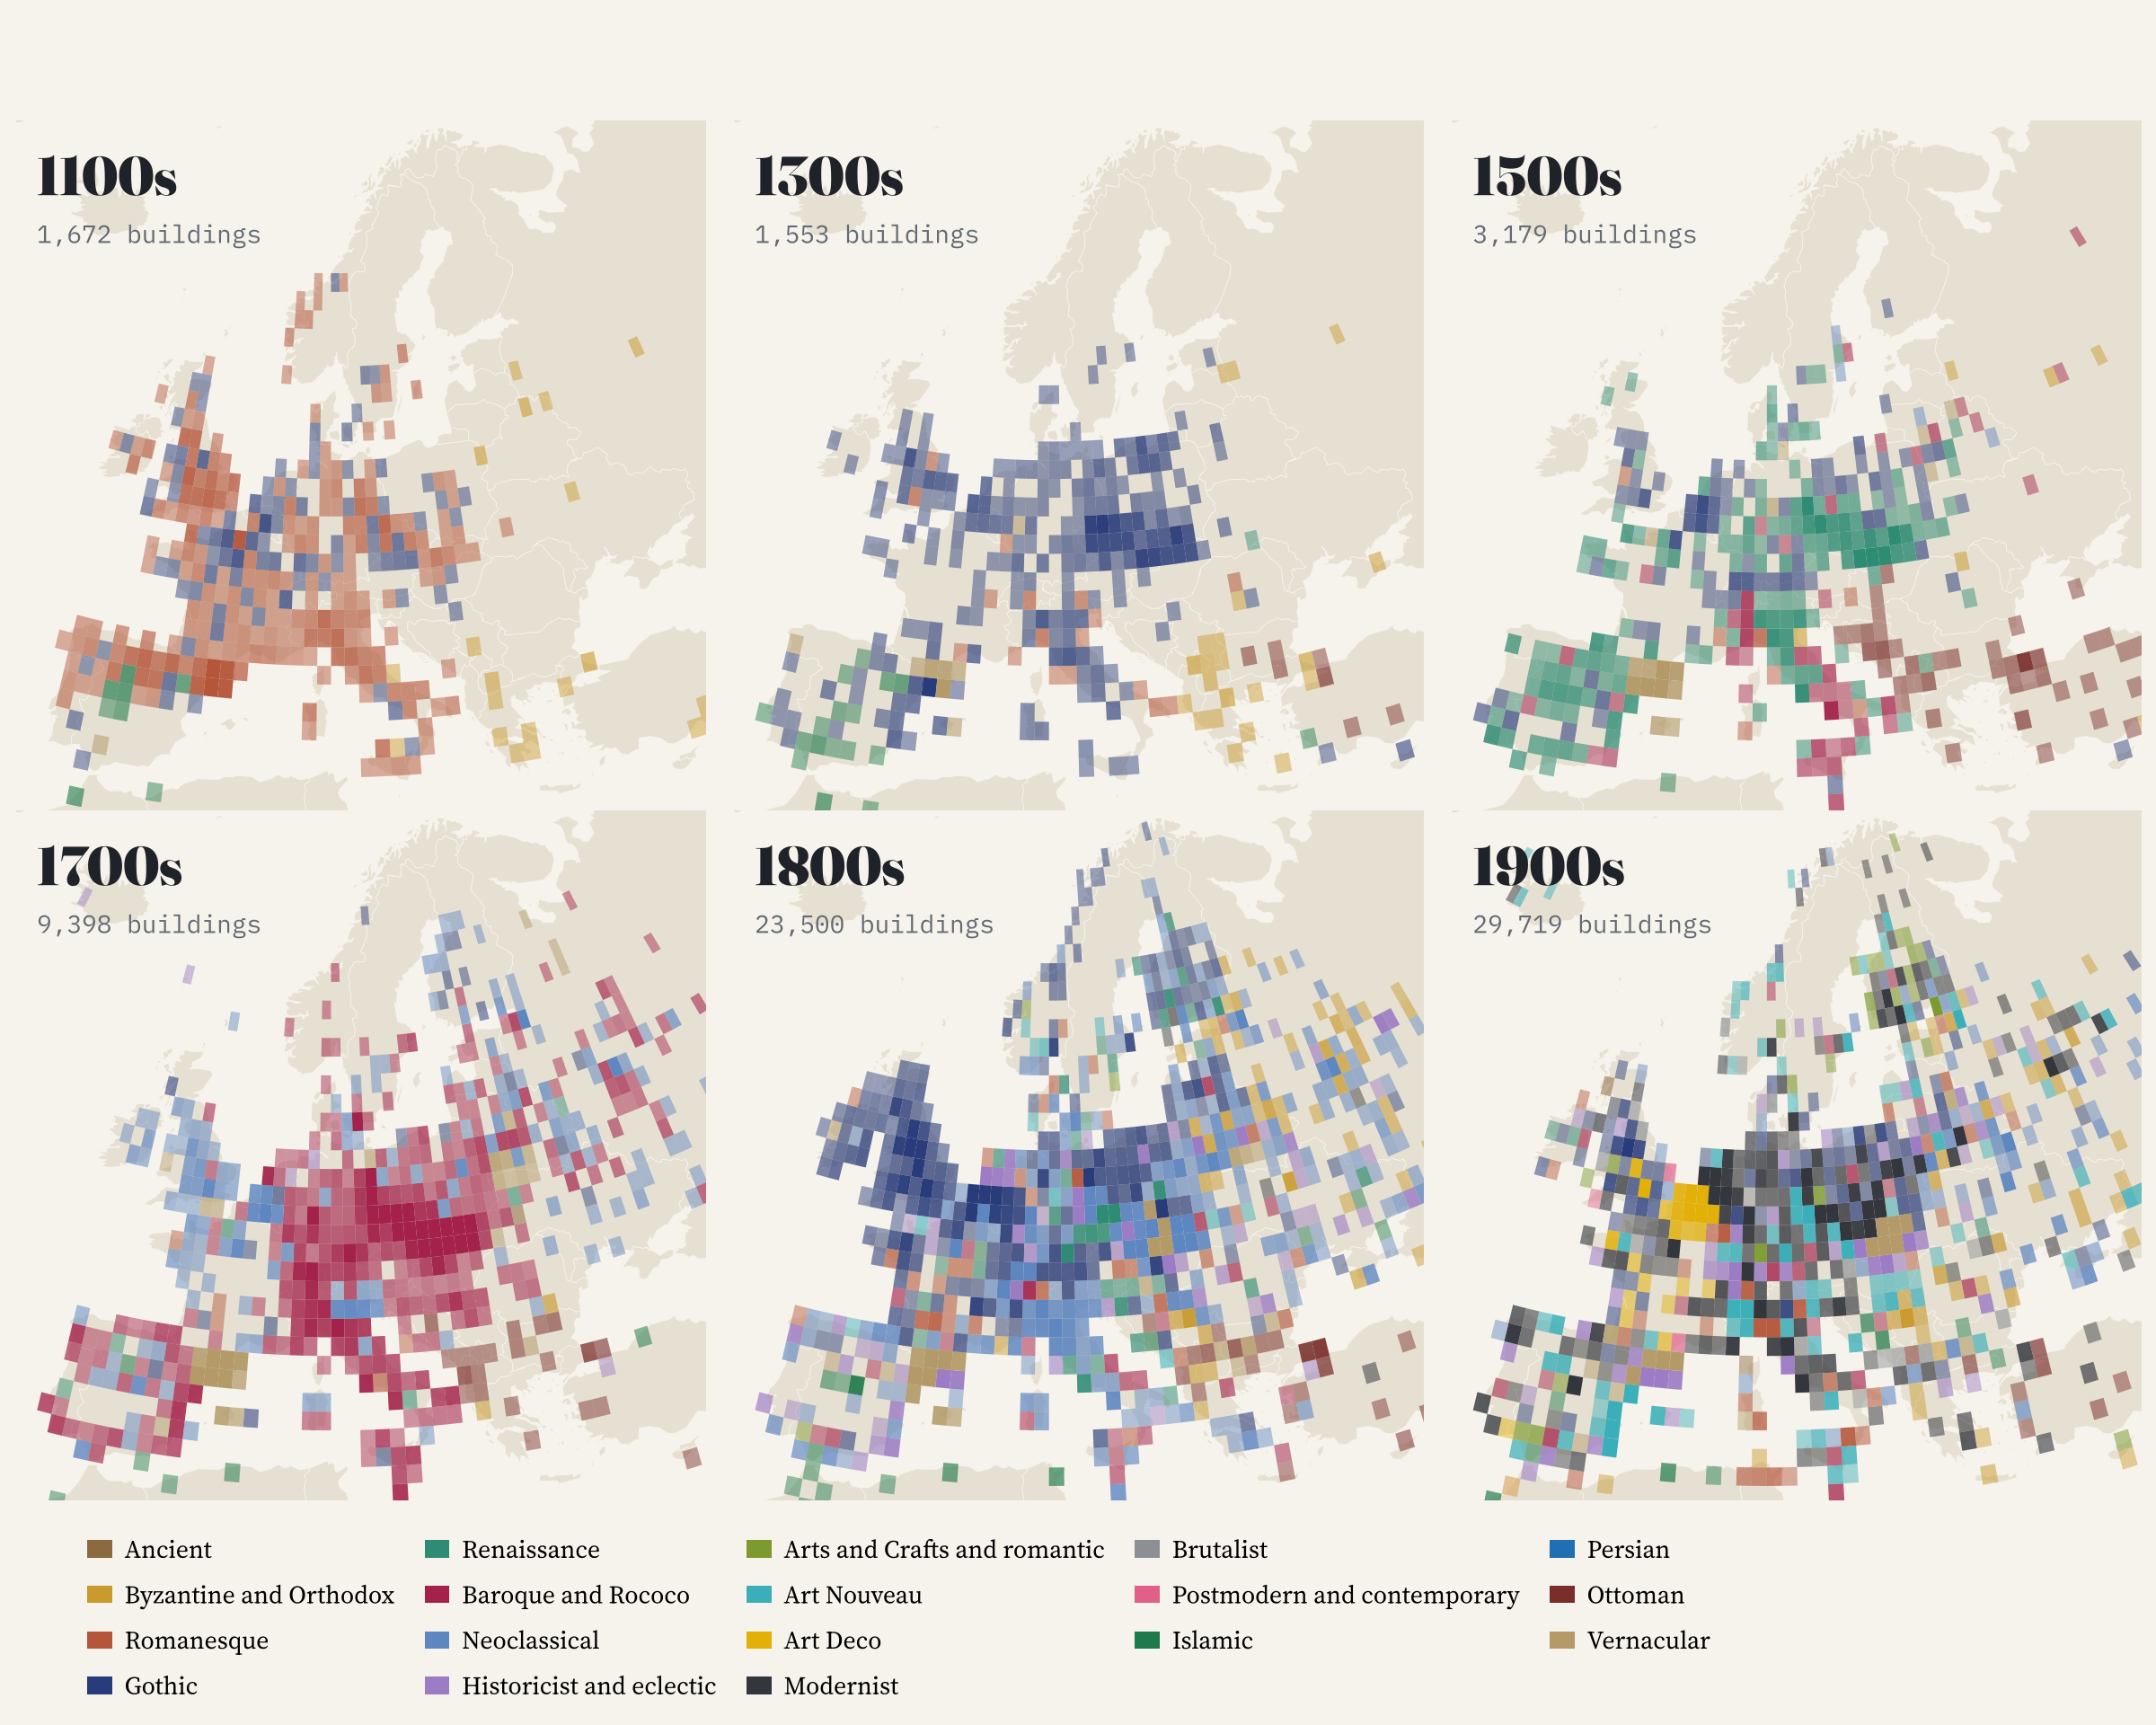
It works on the map too. Colour each square of Europe by its most common style and the centuries roll across the continent: Romanesque in the 1100s, Gothic from England to the Baltic in the 1300s, Renaissance in Spain, Bohemia and Poland in the 1500s, a Baroque heart to Europe in the 1700s with Britain and Scandinavia already Neoclassical, and then the patchwork of the 1800s and 1900s.
One snag with dates. 2,374 buildings are dated exactly 2000, but only 51 are dated 1999. That is Wikidata storing ’20th century’ as the last year of the century, and about a fifth of all dates are round centuries like this. I read them as the middle of the century they end, and left out 3,166 buildings dated before their style existed, usually a medieval parish whose church was rebuilt in the 1800s.
Gothic goes abroad
The 1800s were the century of revivals: 42% of buildings dated to that century are in a revival style. The biggest by far is Gothic Revival, with 10,776 buildings in 97 countries, and the United States has more of them (3,426) than Germany, Poland or Britain.
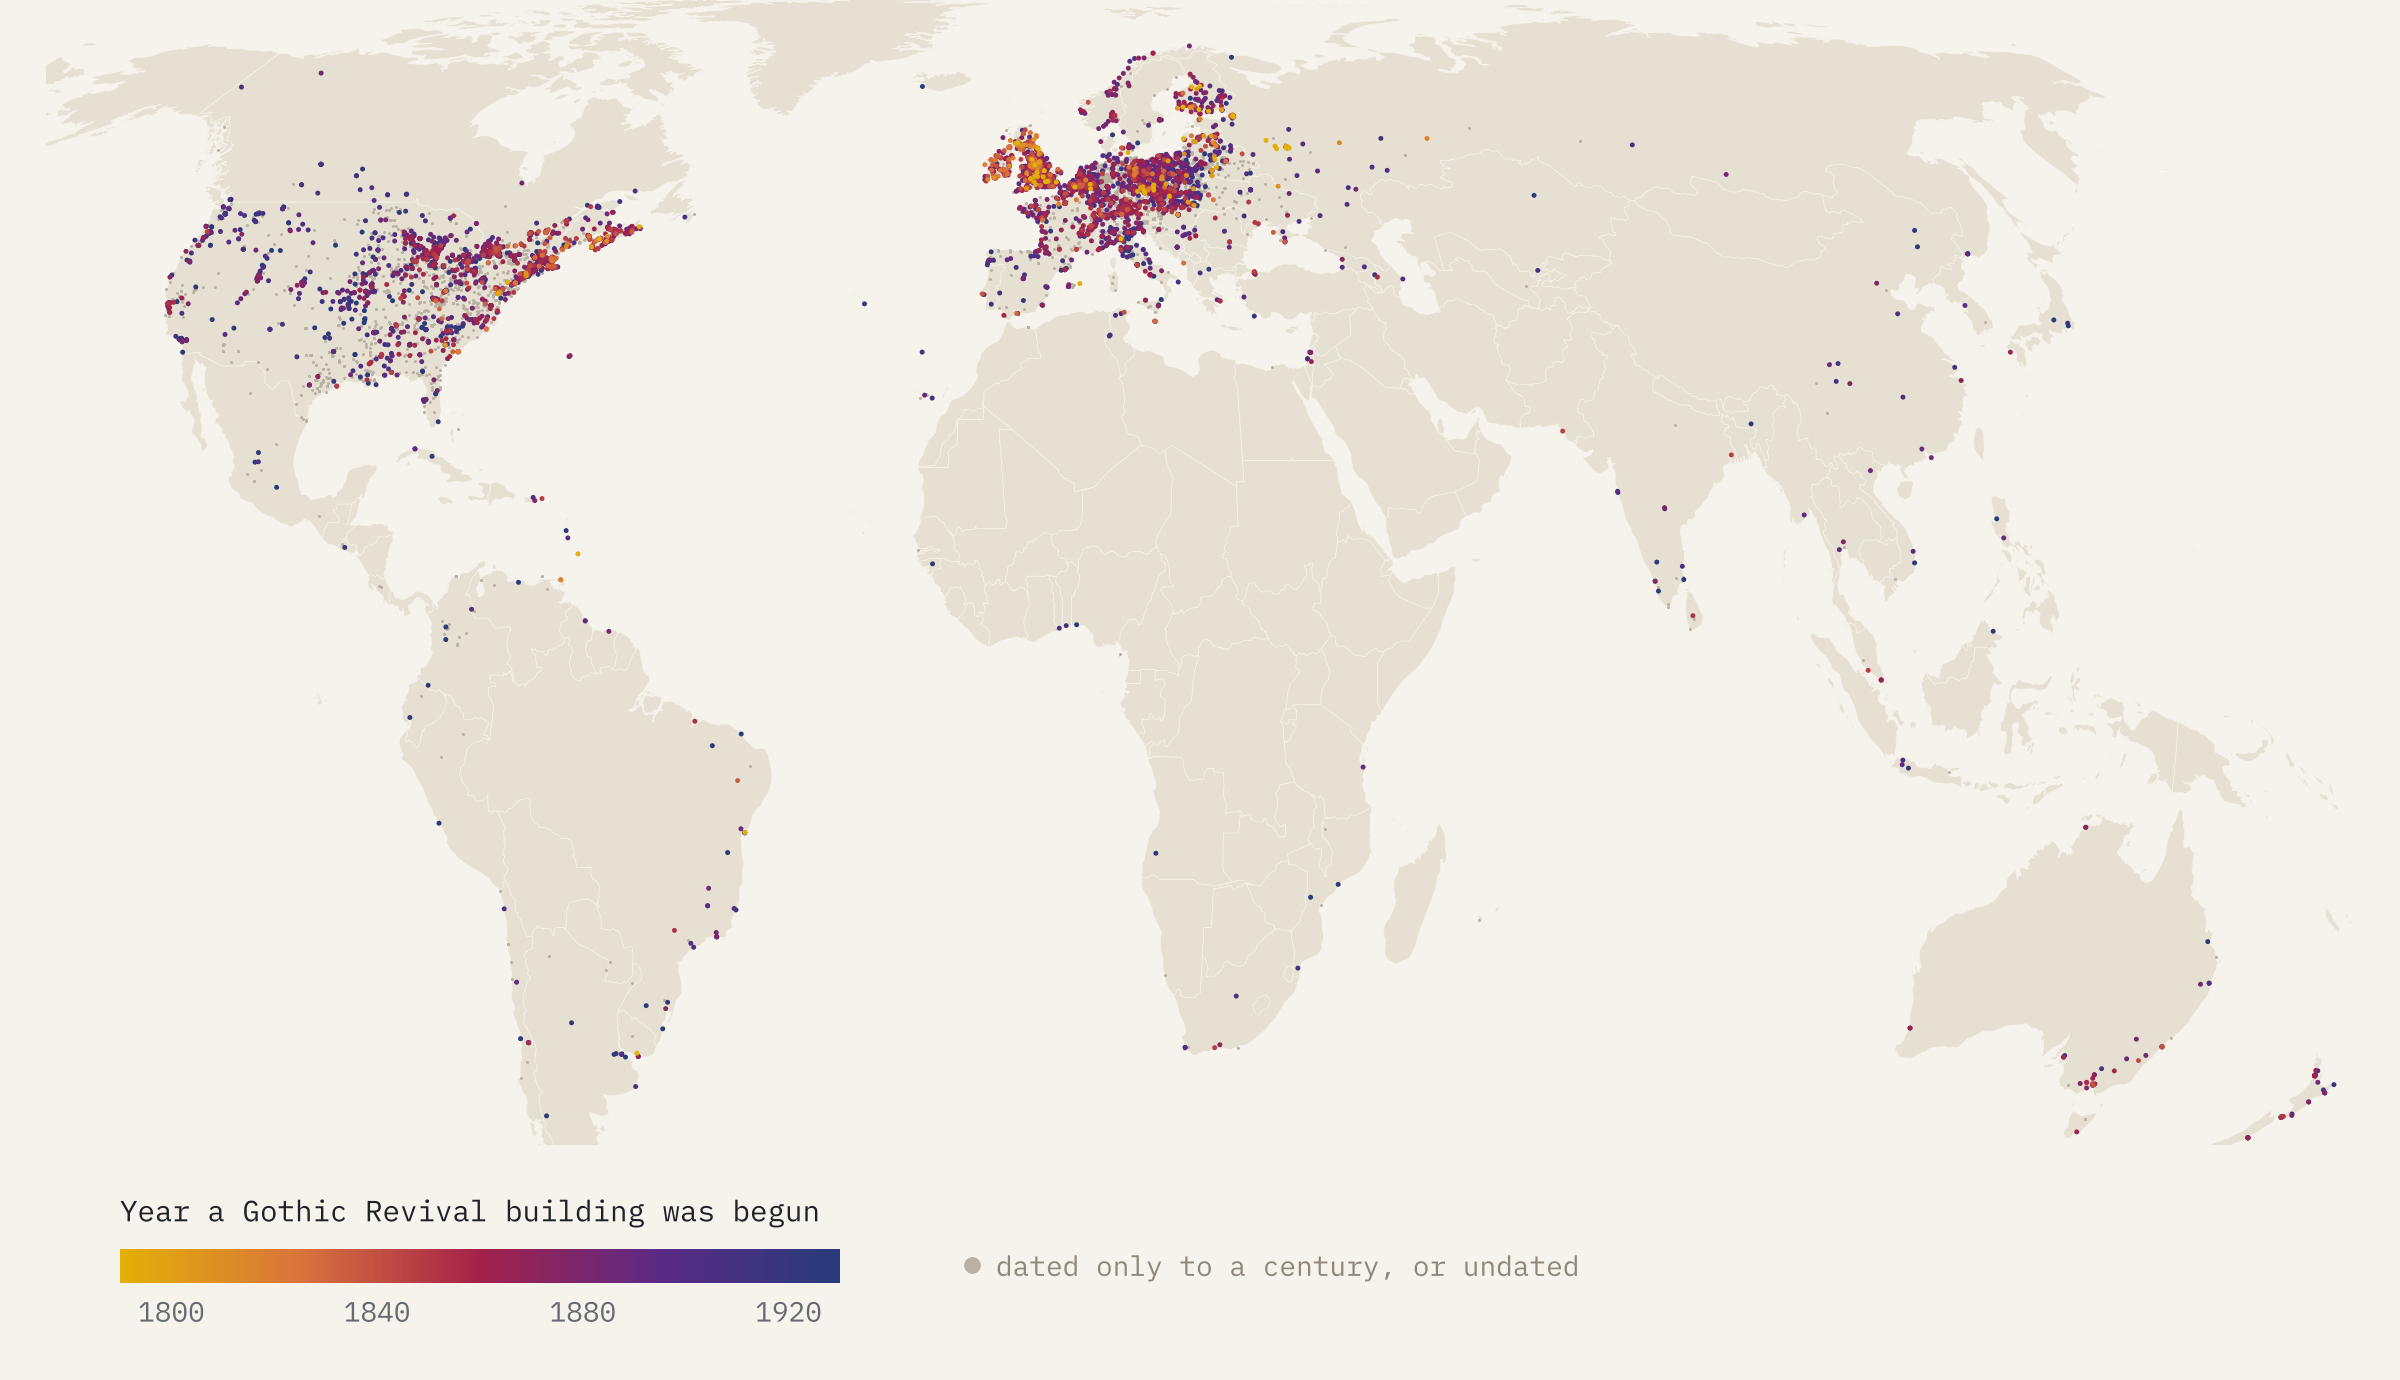
You can follow it outwards. In Britain, the first tenth of precisely dated Gothic Revival buildings were begun by 1832. Canada followed by 1848, Australia by 1849, the United States by 1854 and New Zealand by 1864, and the Americans kept building it long after the British had moved on. The surprise early adopter is Russia, where Catherine the Great built ‘pseudo-Gothic’ palaces at Chesme and Tsaritsyno in the 1770s.
Other revivals hardly left home. 96% of the 5,518 Greek Revival buildings are in the United States, the courthouses, banks and plantation houses of a republic that saw itself in Athens. Colonial and Mission Revival are 81% American.
The columns of power
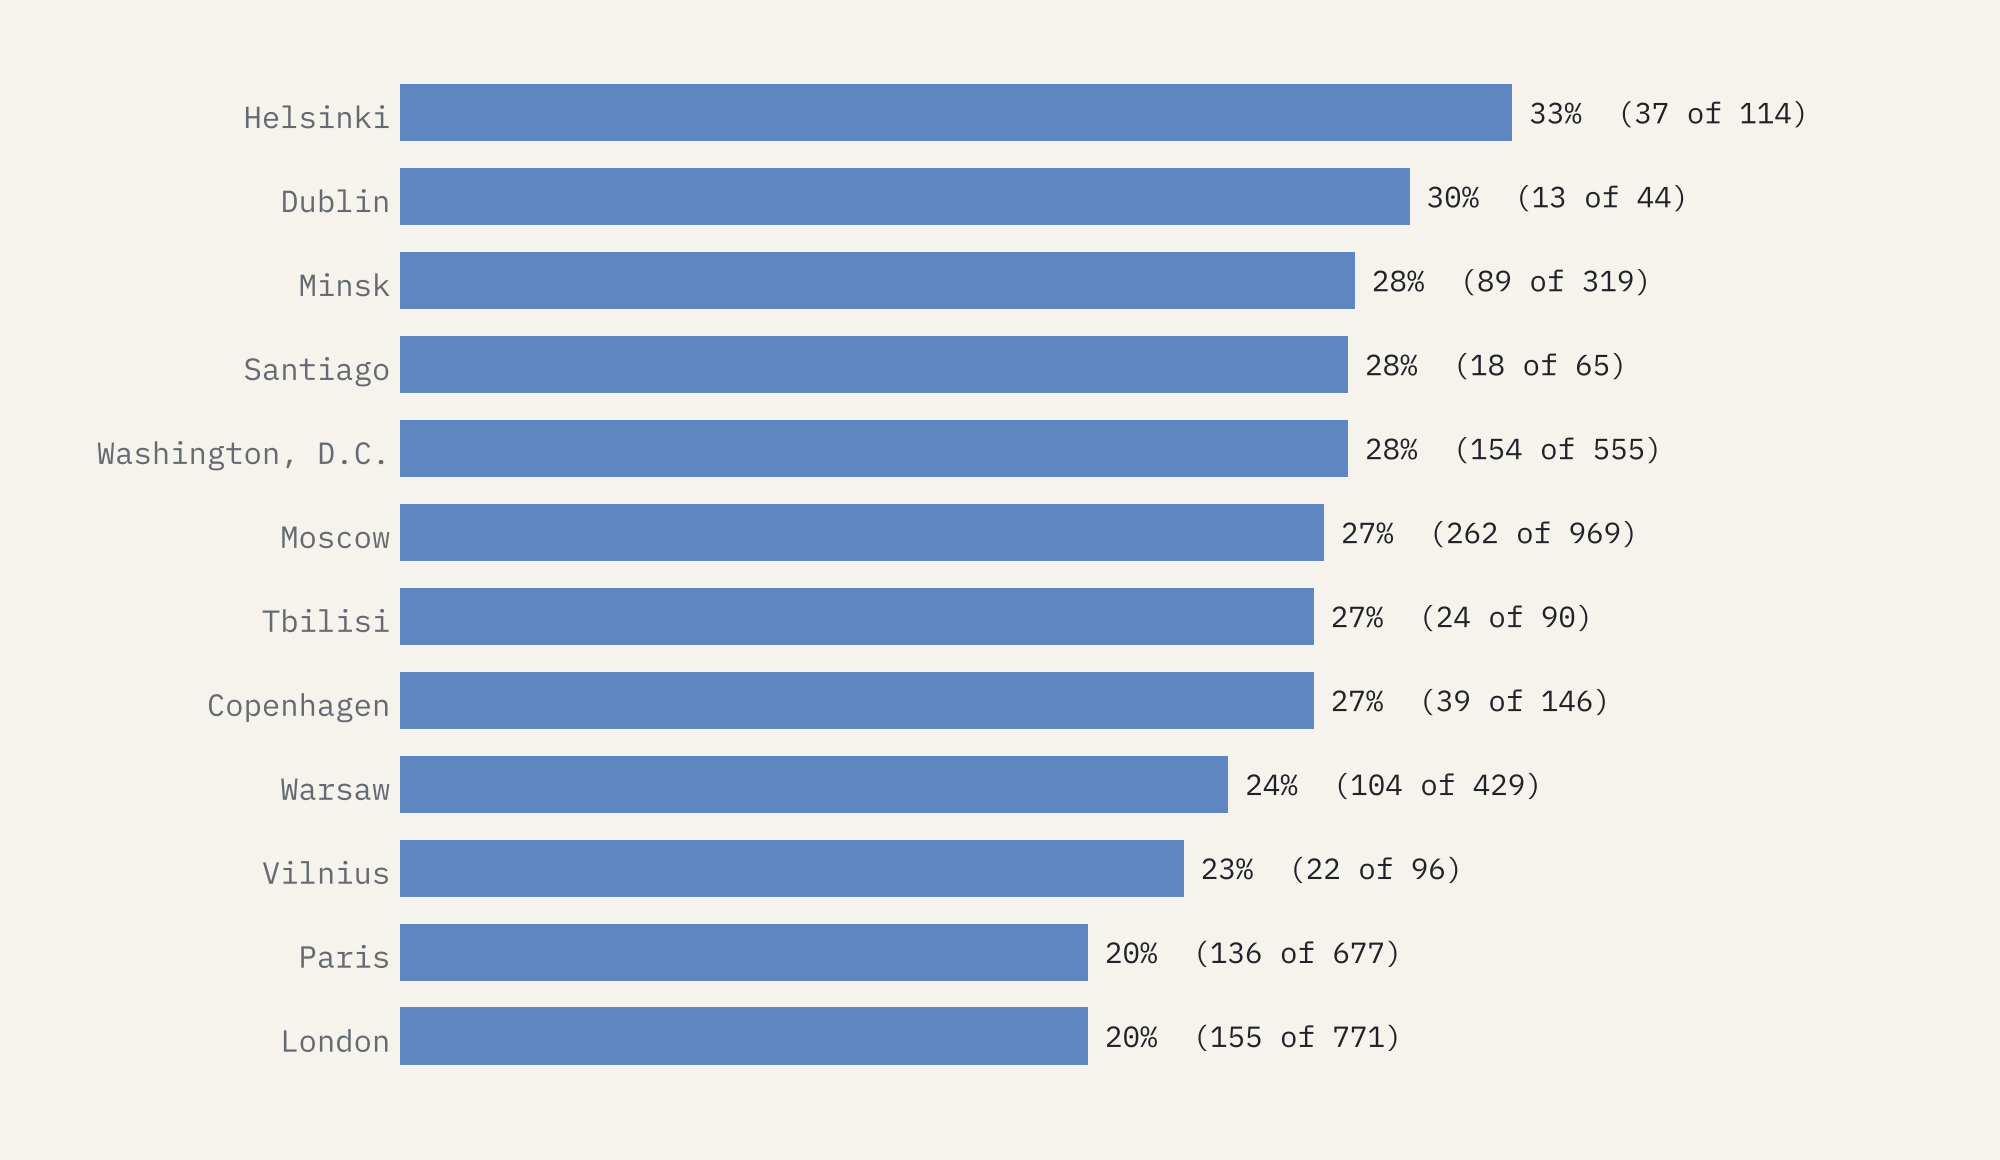
Neoclassical is the biggest family of all, 26,140 buildings, and capitals wear it more than most places. Of the 53 national capitals with enough buildings to compare, it is the most common family in six: Helsinki, Washington, Tbilisi, Paris, London and Havana. Helsinki tops the list (33% of its styled buildings), thanks to the Empire-style centre Carl Ludvig Engel built when it became a capital in the 1800s.
A map of who keeps the records
Now the caveat, and it is a big one. This is not a map of the world’s buildings. The United States and Spain hold 43% of them between them; Spain’s total includes 5,782 Catalan farmhouses. Slovakia has more per head than any other sizeable country. Germany, France and the UK together hold just 12%. Europe has 68% of everything and Africa 0.4%, and China has 381 buildings with a style.
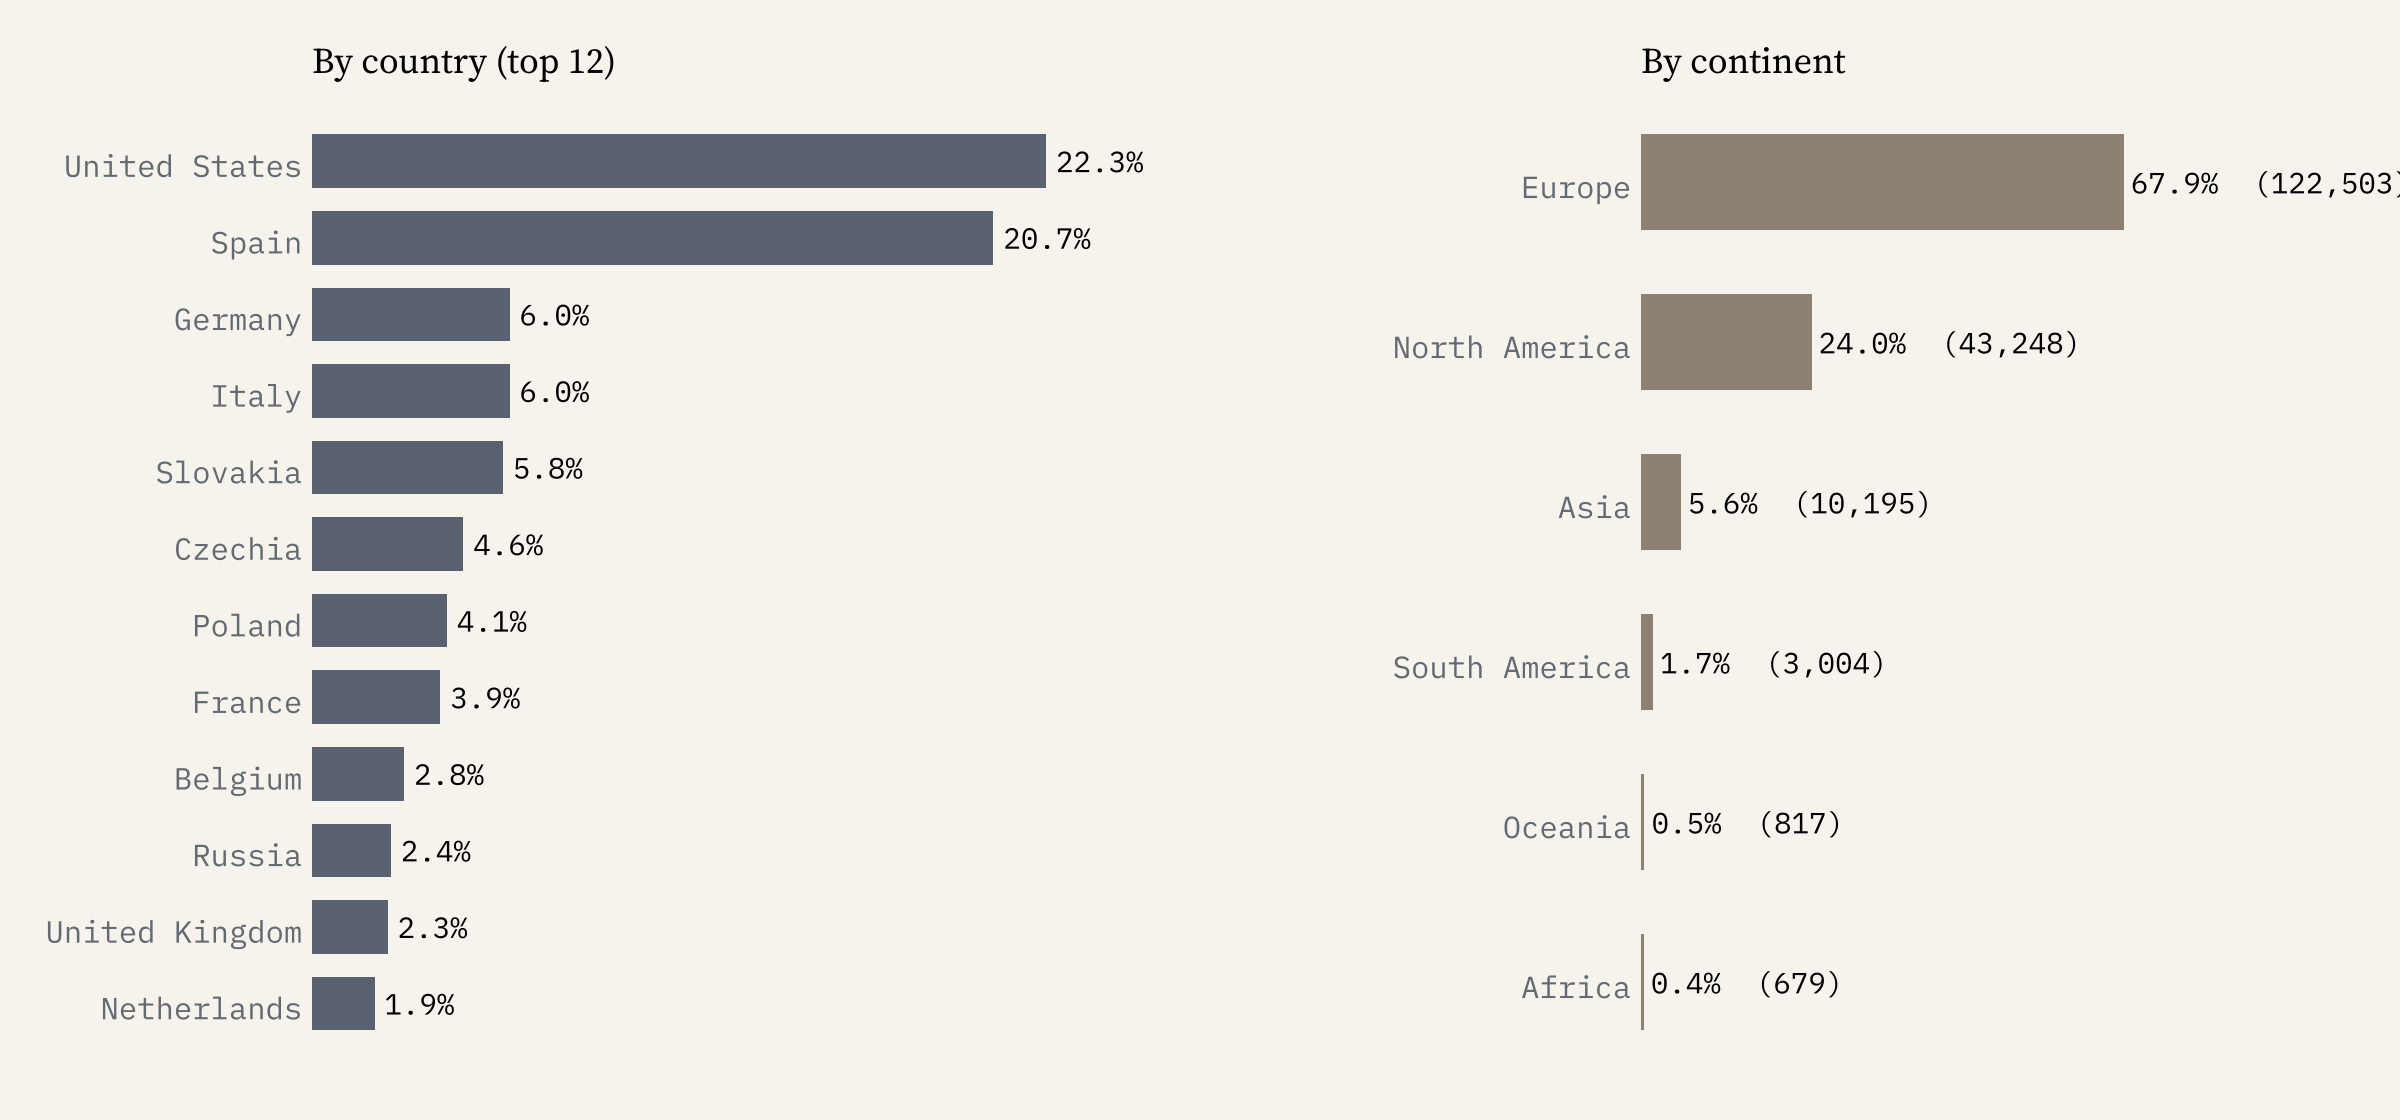
What the map really shows is which heritage lists have been loaded into Wikidata, and how keen editors have been to add a style. The style labels are European in outlook too: Iran’s buildings are labelled by dynasty, Japan’s shrines by the shape of their roofs, and hardly any Maya or Inca site has a style at all.
Wikidata gives a style to 37,369 buildings in Spain and 381 in China.
The interactive map lets you play through the centuries, switch to the dominant style in each patch, filter out the revivals or keep only them, and search for a town or a building. Click any dot for its name, style, date and links to Wikidata and Wikipedia.
How I did this
I took every Wikidata item with an architectural style and coordinates, through the QLever query service, in 2026. I decided the family of every style used by 20 or more buildings by hand, covering 99% of all style statements; the long tail went by words in the label or by the style’s parent in Wikidata. Revival styles keep the family of the style they revive, with a flag. A building with several styles takes its most specific one. Dates are Wikidata’s inception, with round centuries read as mid-century. The full mapping table, the data and the code are on GitHub, and the paper sets out the method and its limits.
It counts records, not buildings on the ground, and it ranks nothing. If a building near you is missing, or wearing the wrong style, Wikidata is open for anyone to fix.
Notes and sources
- Wikidata, architectural style (P149), coordinates, inception, country and sitelinks, via QLever. CC0.
- Natural Earth countries and populated places (public domain).
- Base map tiles on the interactive page © Esri.
- I wrote the text, with drafting and editing assistance from Claude (Anthropic), which also helped prepare the analysis code. I reviewed and checked all text and results.

