
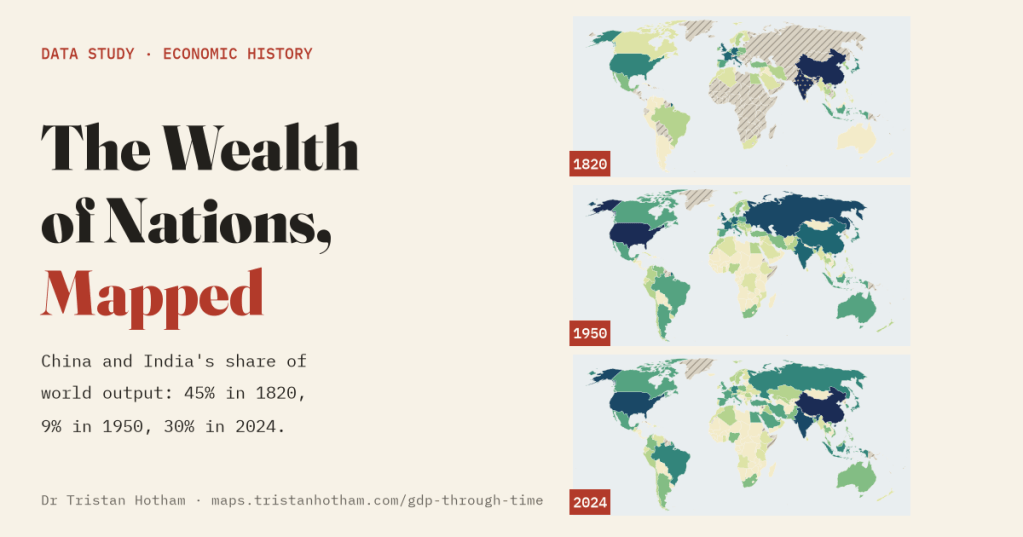
The world economy on one map you can play, from the first farmers to today. In 1820 China and India made 45% of everything the world produced. By 1950 it was 9%. Today it is 30% again. Here is the whole story, gaps and all.
Angus Maddison was an economist who spent decades doing something that sounds impossible: estimating the size of every economy in the world, as far back as the evidence would go. Roman Italy, Song China, Mughal India, the Dutch Golden Age. After he died, a team at Groningen carried the work on as the Maddison Project, replacing many of his guesses with new research. Its latest release holds 21,366 estimates of output per person for 169 countries, all in dollars of the same buying power.
These numbers usually appear as a line chart with five or six countries on it. I wanted to see them on a map, and to push it back as far as the evidence honestly goes. So I built one with a slider from 10,000 BC to 2024: every country coloured by the size of its economy, its output per person, its share of the world or how fast it was growing, a ranked list of the fifteen biggest beside it that reshuffles as you play, and a full history for any country you click.
Before the nations
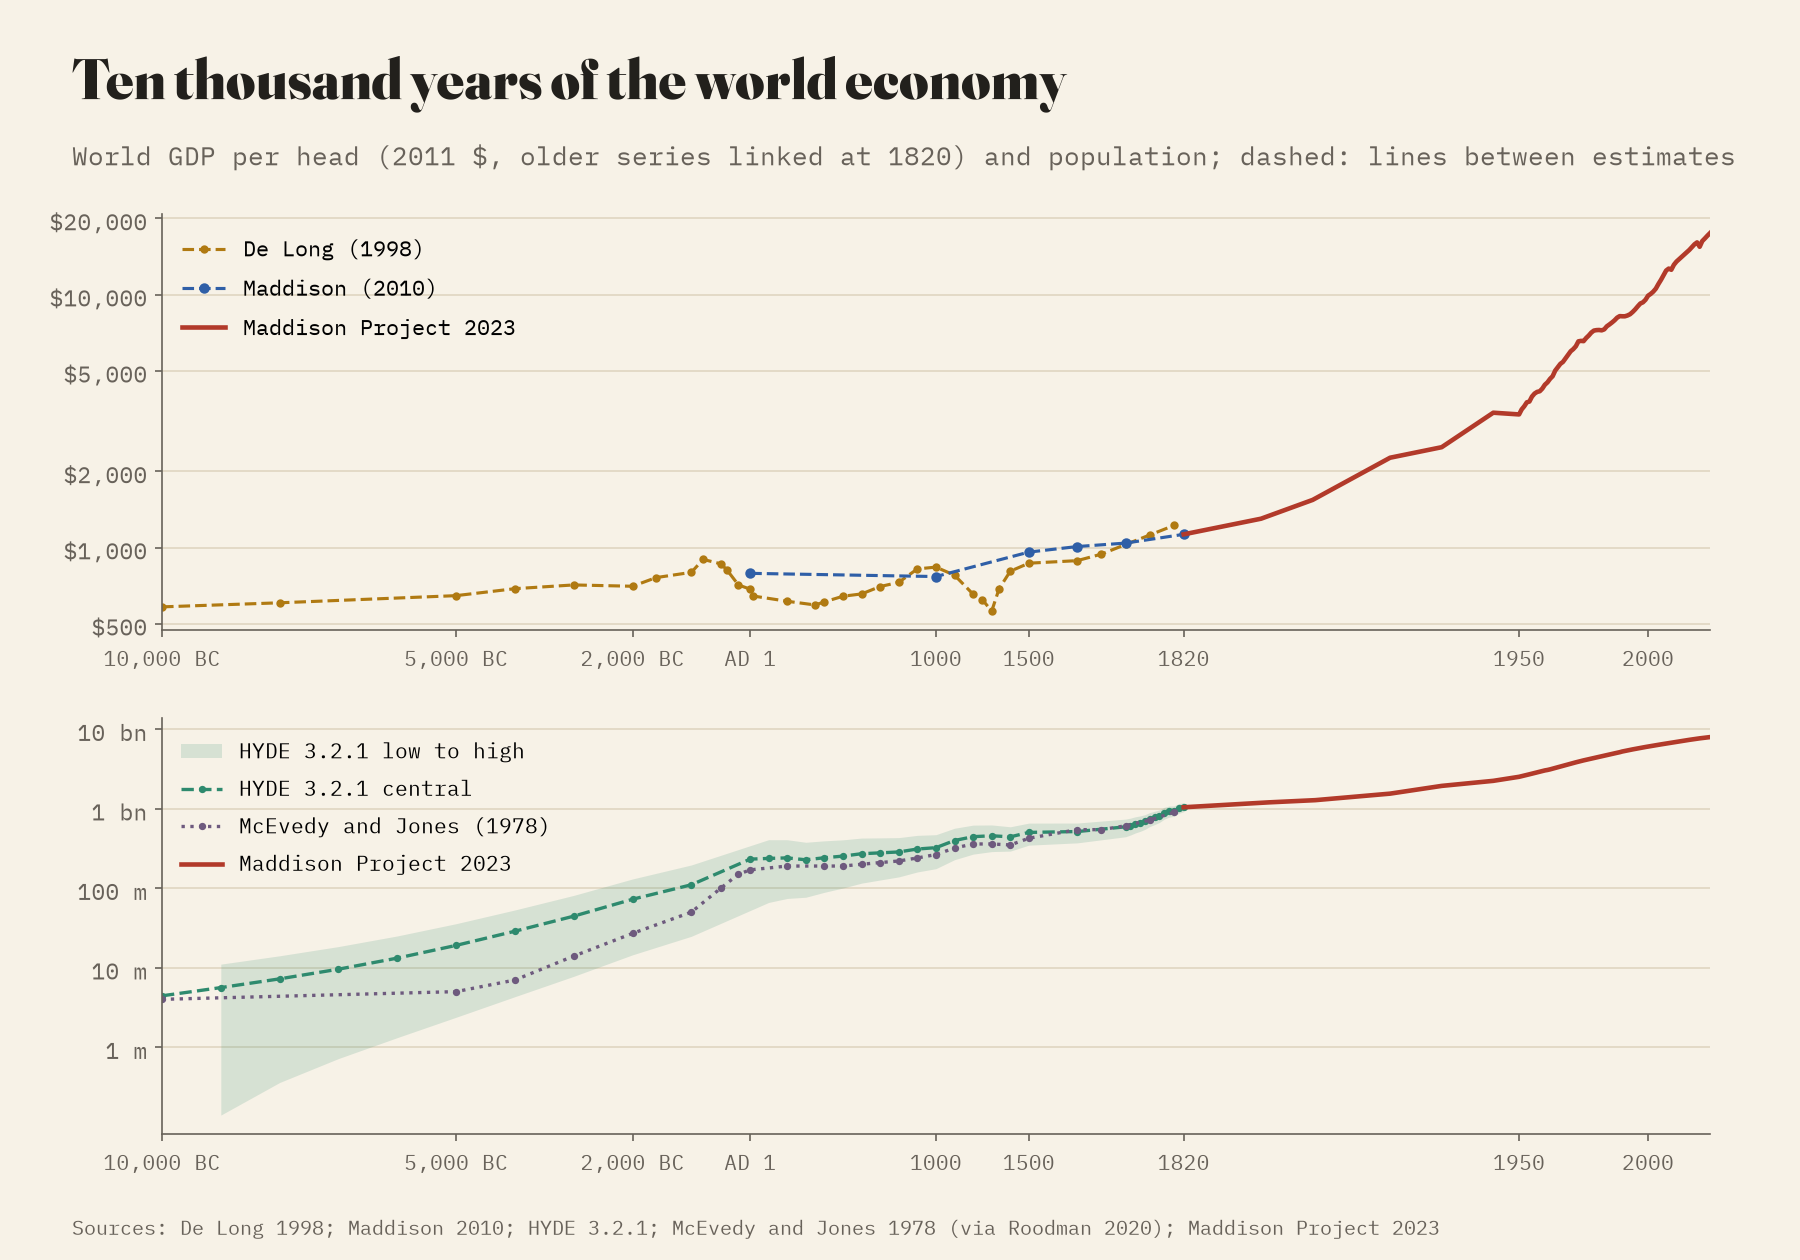
Start the slider at 10,000 BC and the map is empty, because nobody has estimated the output of any country or region that far back. What scholars have estimated is the world as a whole, and those numbers are mostly reasoned guesses. The HYDE reconstruction puts the world at about 4.4 million people as farming began; for 3000 BC its range runs from 7.8 to 81 million. Brad DeLong’s estimates of output per head start near subsistence by assumption and barely move: about 2.1 times higher in 1800 than in 10,000 BC. Since 1820 the figure has grown 15.5 times.
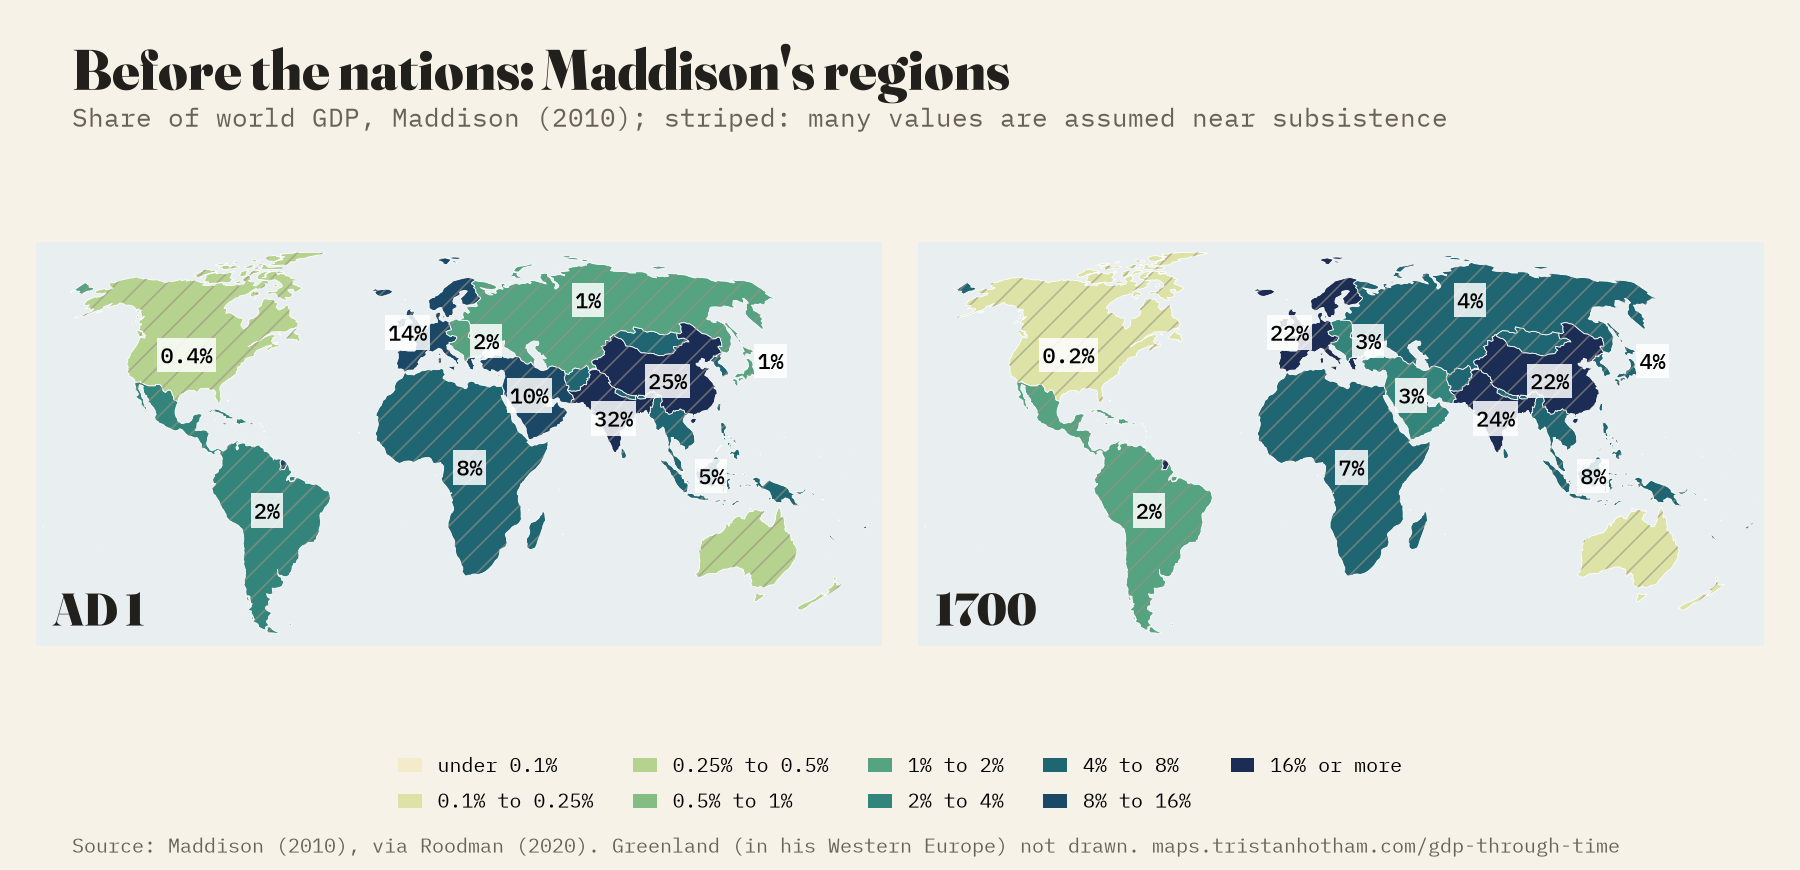
From AD 1 the map shows striped regions: Angus Maddison’s own regional estimates, which the newer database no longer carries. On his figures the Indian subcontinent and Han China made 57% of the world’s output in AD 1, and Western Europe, then mostly Roman, 13.7%. But 7 of his 11 regions sit at round values he assumed for economies near subsistence, so these shares are mostly his population estimates in disguise. I have striped them on the map so they cannot be mistaken for measurement.
Half the world, then a tenth, then a third
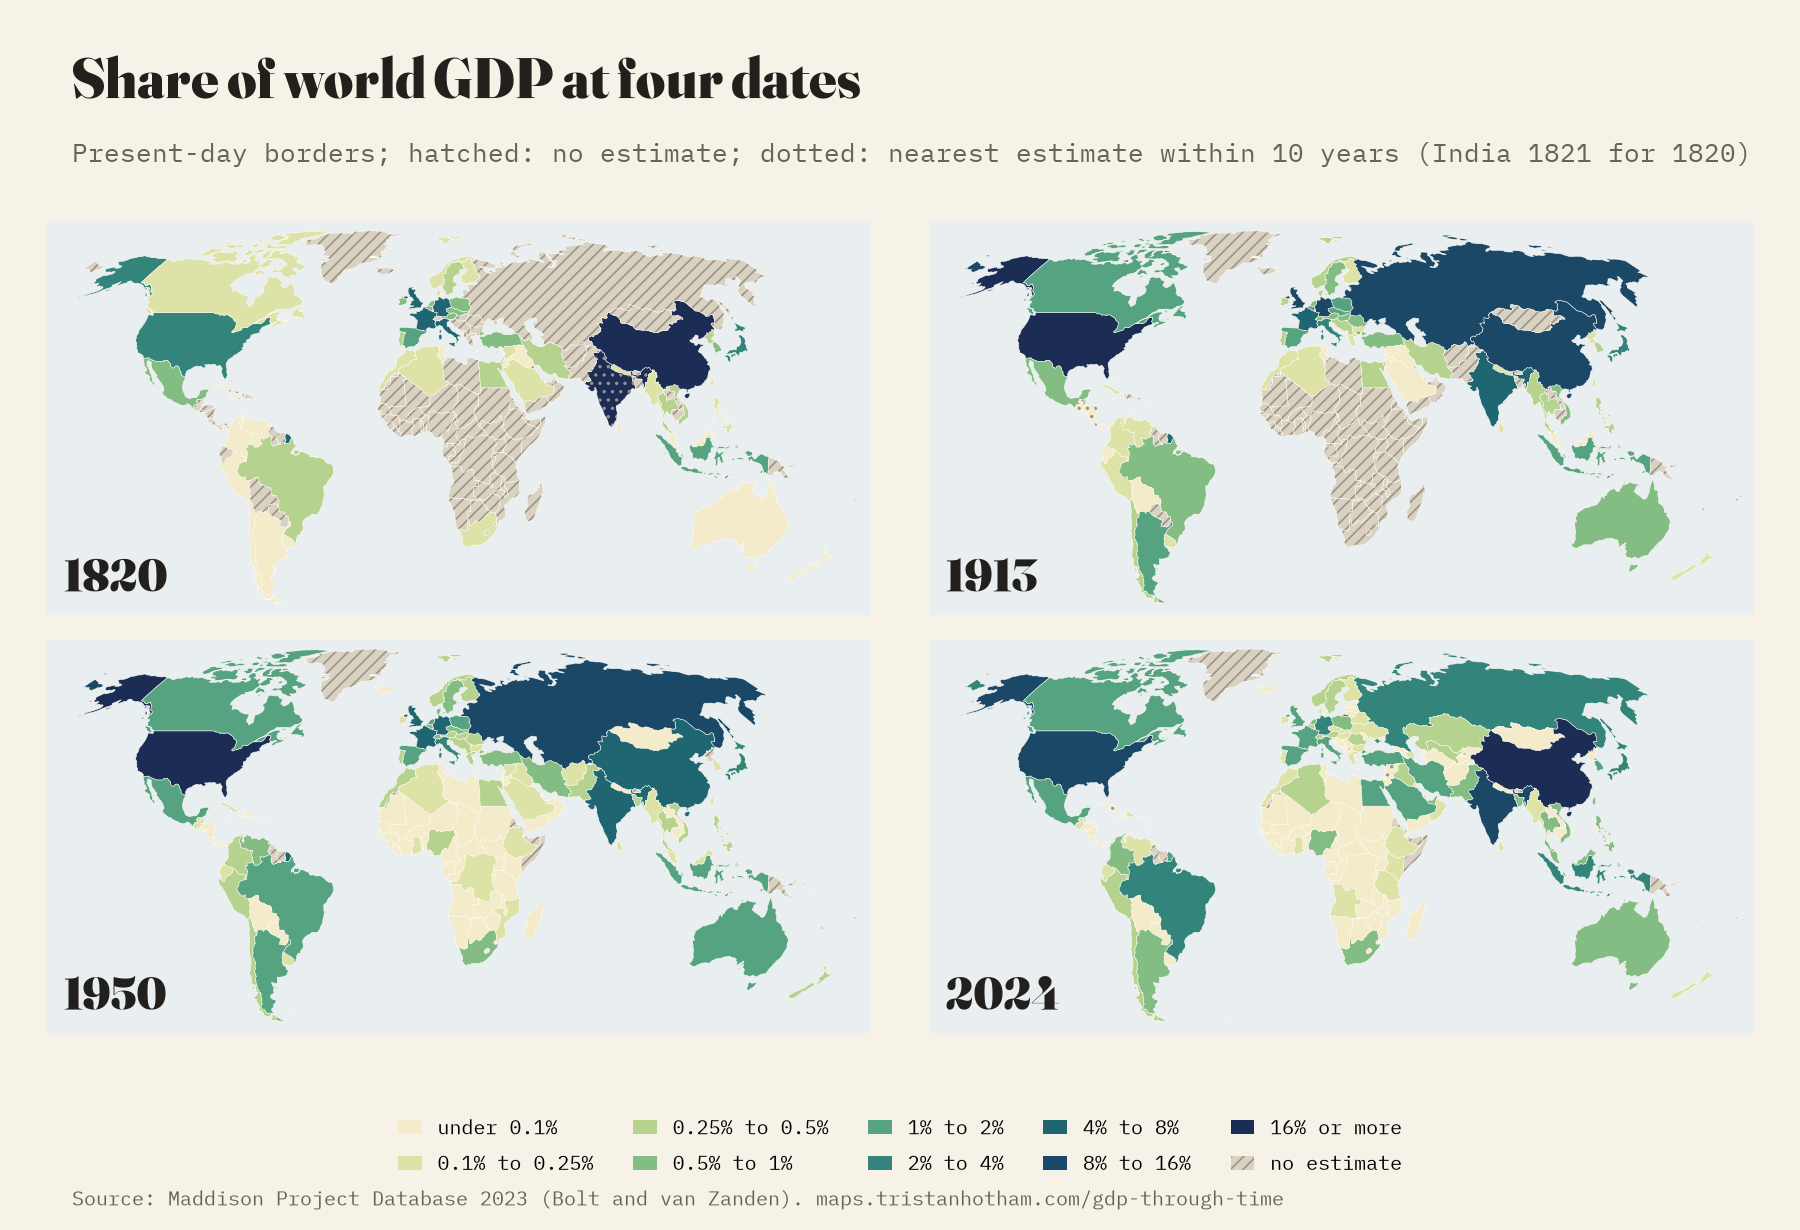
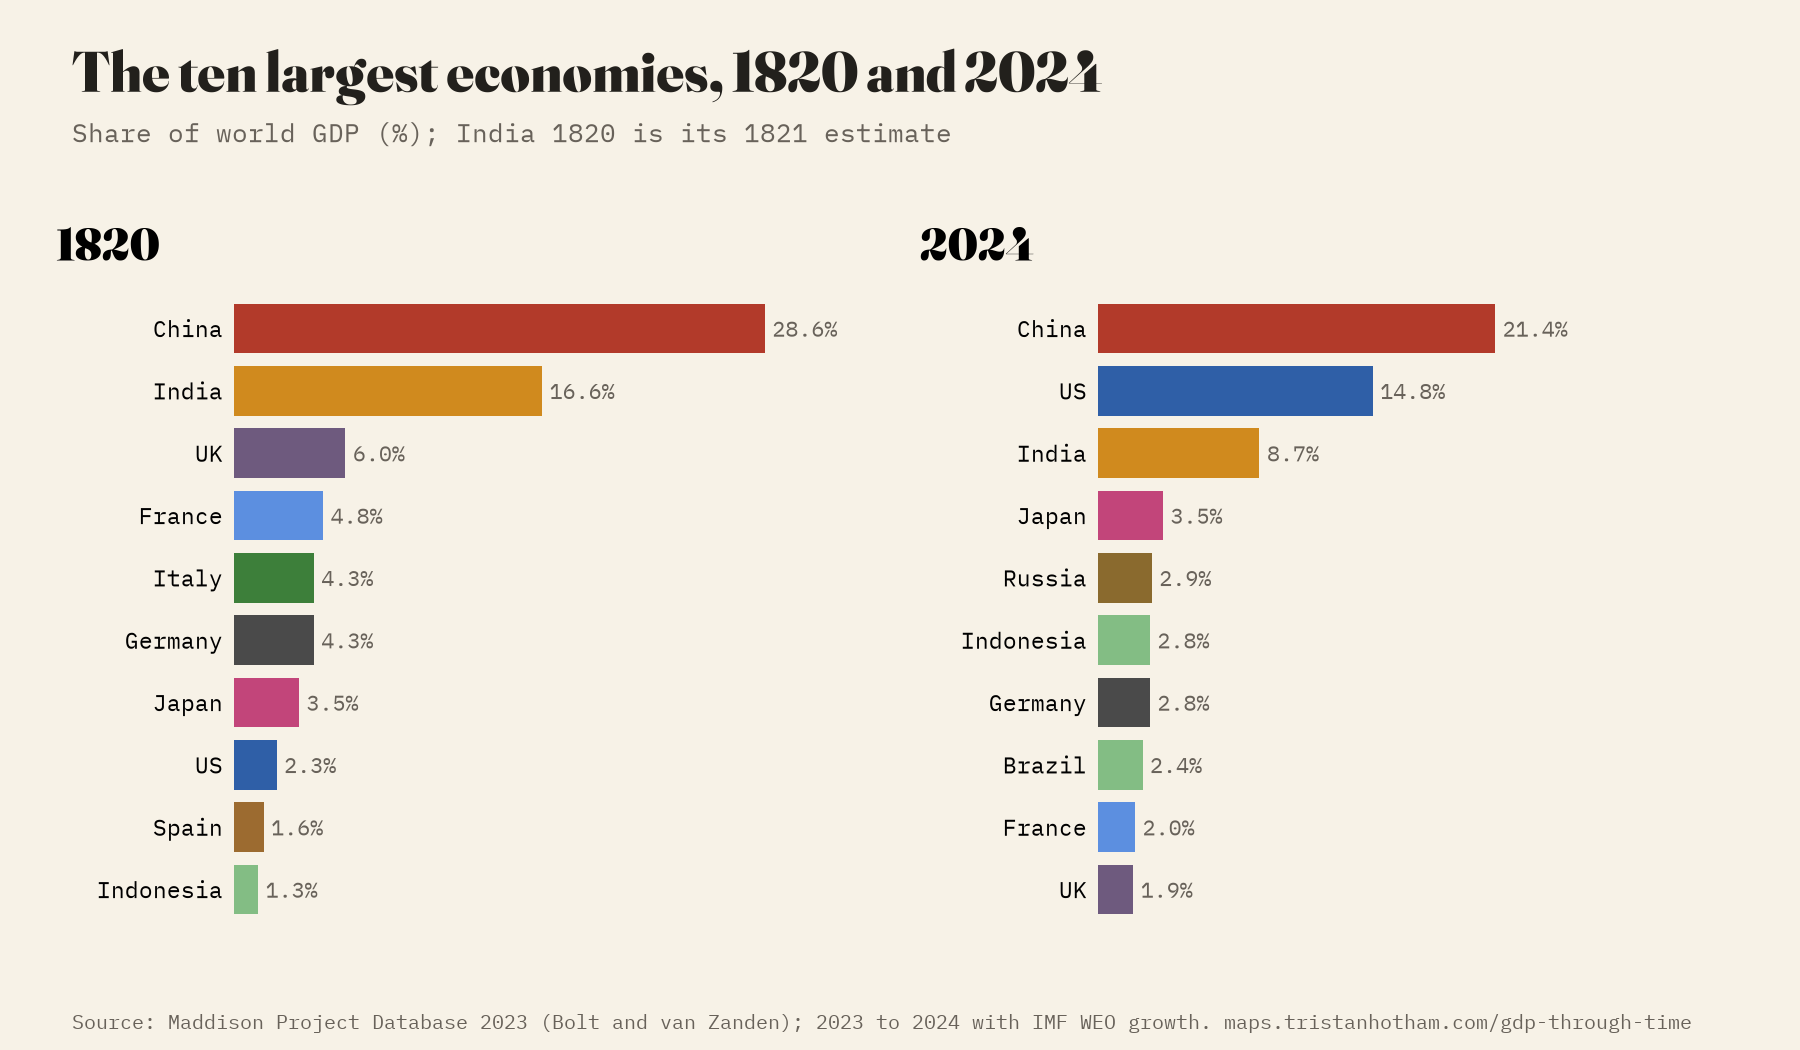
In 1820, the first year with a world total, China produced 28.6% of the world’s output and India 16.6%. Not because people there were rich: output per person was about $882 in China and $937 in India, against $3,306 in Britain. They were big because so many people lived there.
Then came what historians call the great divergence. As Britain, then Western Europe and the United States industrialised, China’s share fell to 10.0% by 1913 and to its lowest, 4.2%, in 1961, at the end of the famine of the Great Leap Forward. India’s bottomed out at 3.0% in 1979. Meanwhile Western Europe and its offshoots (the United States, Canada, Australia, New Zealand) went from 27% of world output to 59% on the eve of the First World War.
And then it turned. In 2024 China makes 21.4% of world output and India 8.7%. Together that is 30%, almost exactly the same as the West’s 30%.
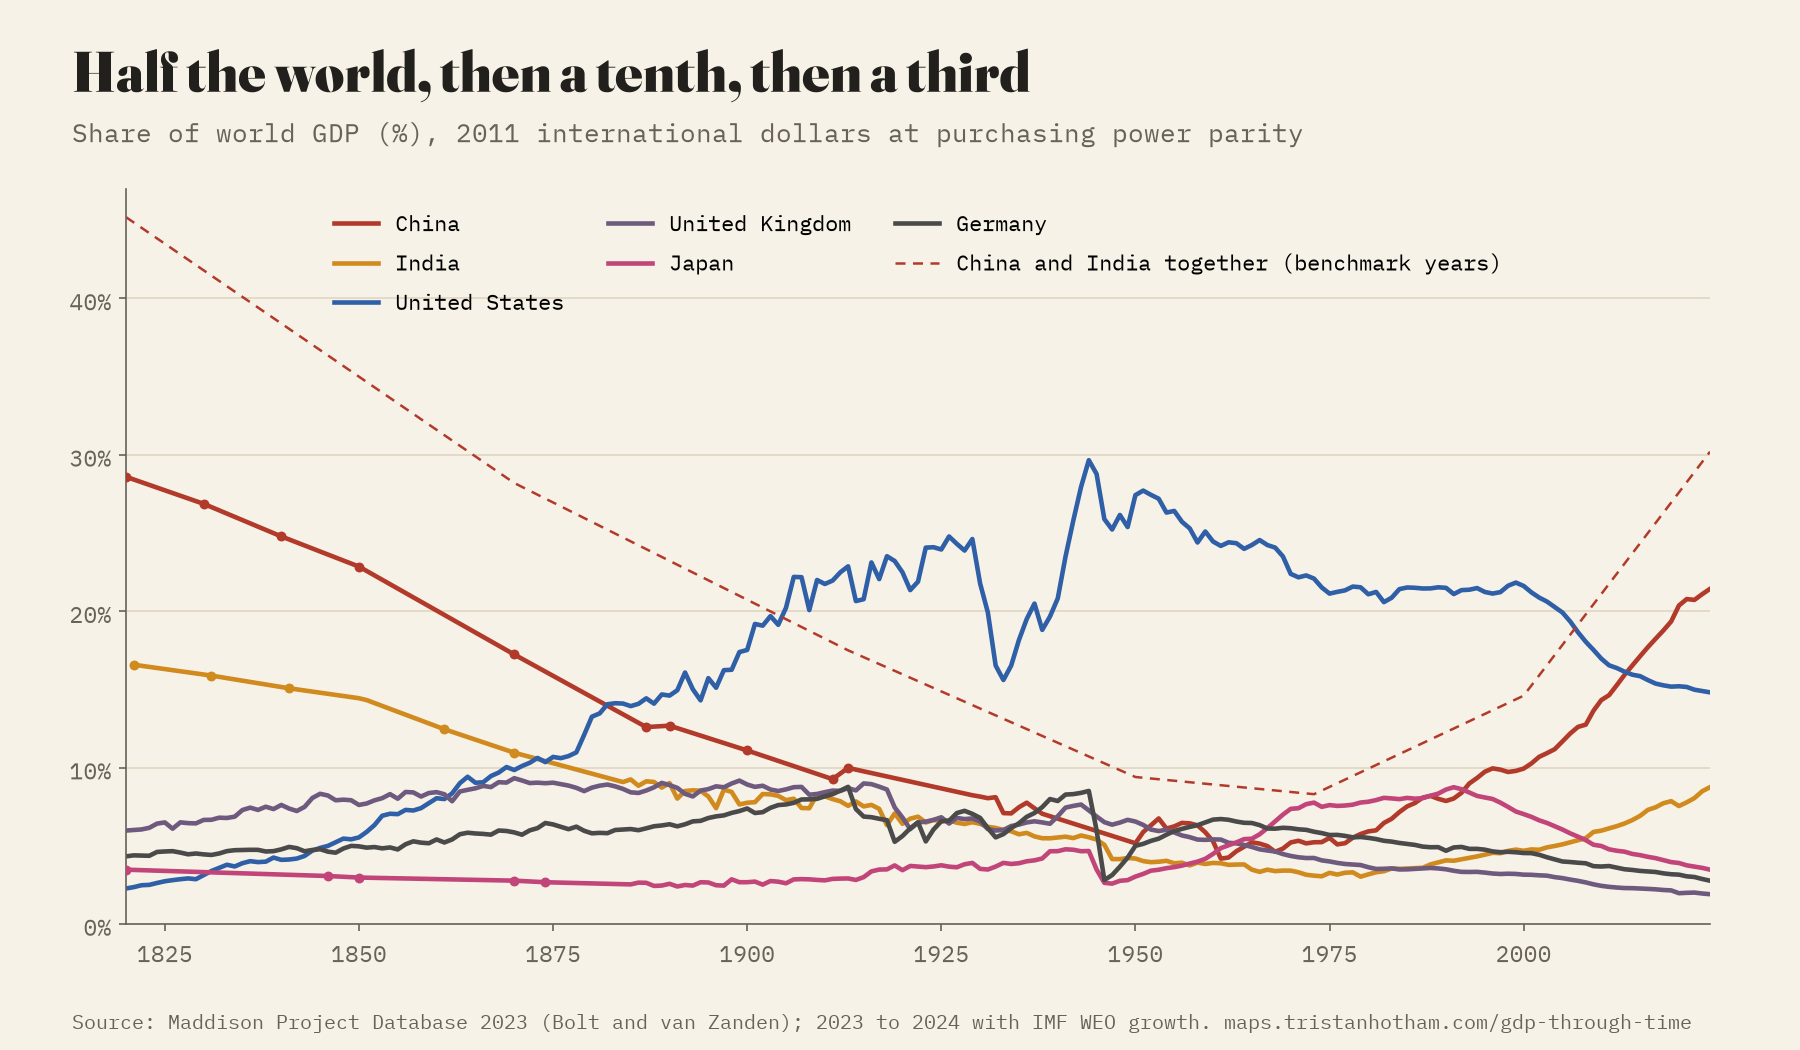
China and India made 45% of the world’s output in 1820 and 8% in 1973. In 2024, 30%.
When the leaders swapped
The American economy became bigger than Britain’s in 1862, in the middle of the Civil War, and never fell behind again. Output per person took longer: the two swapped places on and off until 1898, and again in the Depression, and the United States has been ahead every year since 1935. The American share of the world peaked at 29.7% in 1944, while most of the rest of the industrial world was at war.
China was the world’s largest economy in every year Maddison can compare until the 1880s. The record then goes quiet: there is no estimate for China between 1870 and 1887, and by 1887 the United States was bigger. It stayed on top until 2014, when China passed it again in these purchasing power figures. (At market exchange rates, which measure something different, the United States is still larger.)
The take-offs
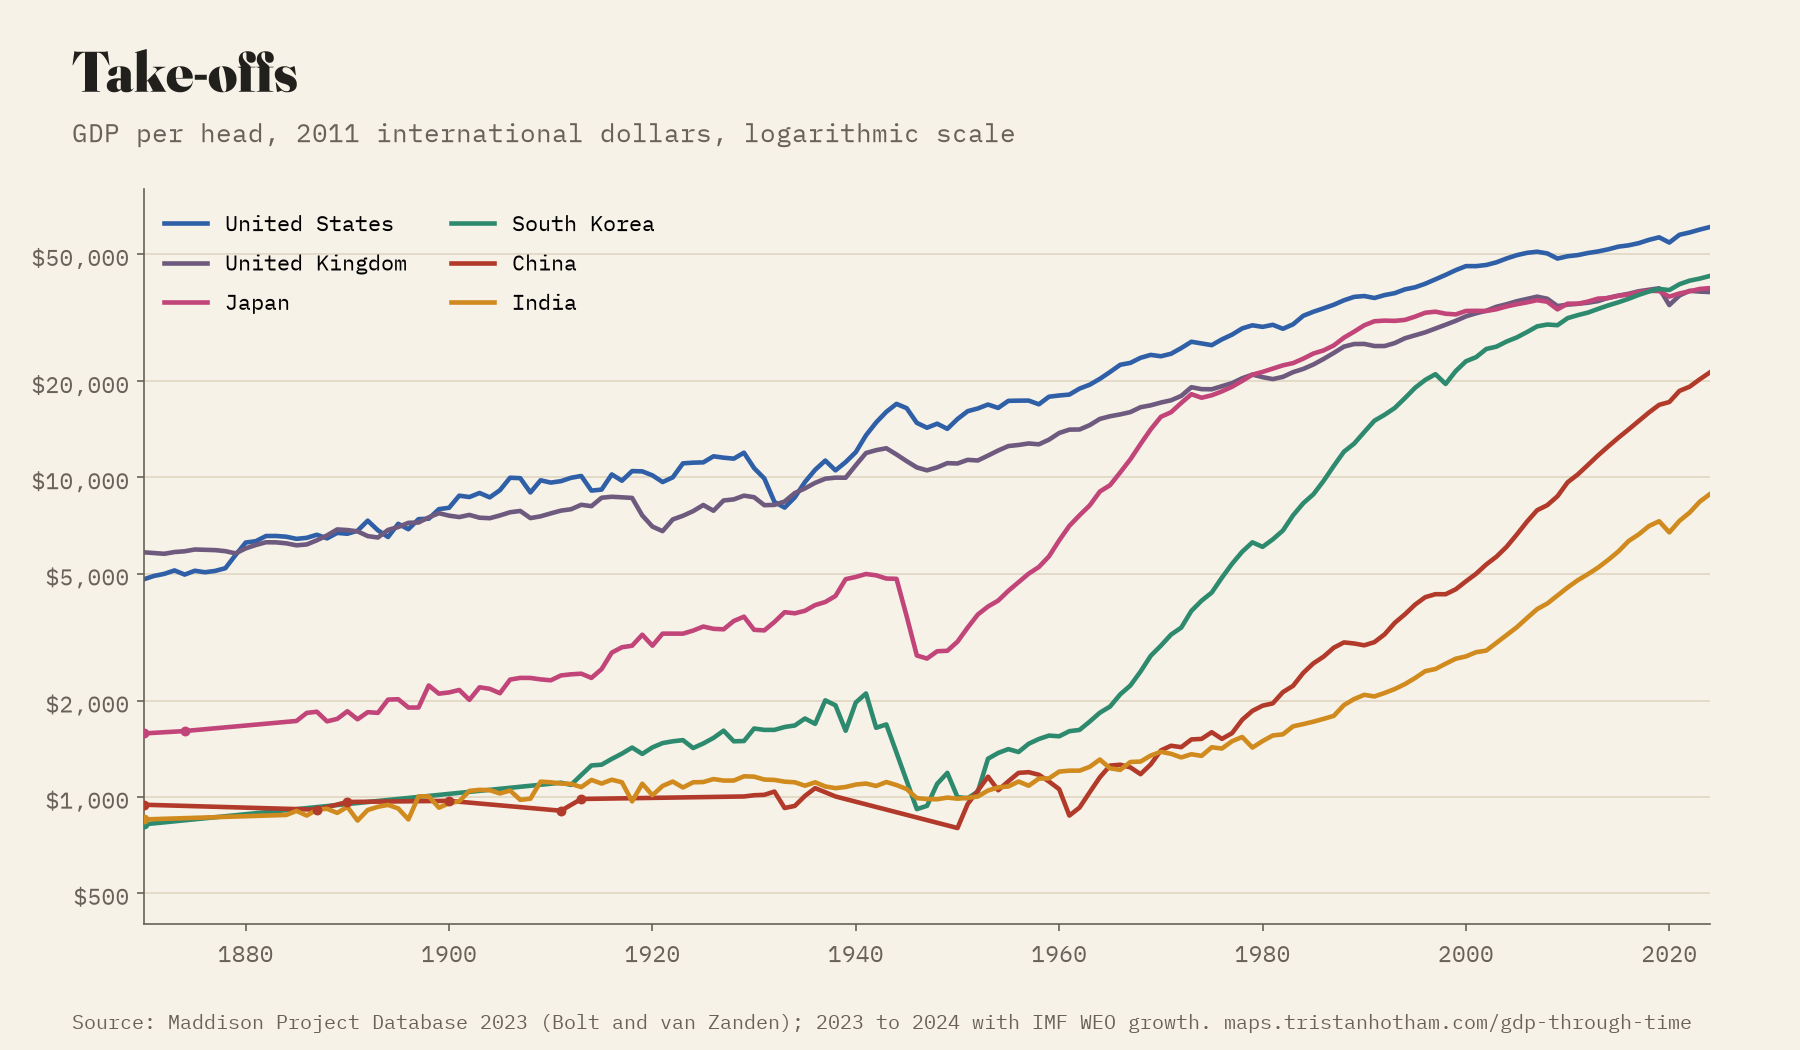
Most economies grow slowly. A few have grown astonishingly fast for a long time, and the map shows them light up. In 1950 Japan’s output per person was $3,062, 28% of Britain’s. Over the next 23 years it grew 6.0 times, and Japan passed Britain in 1980.
South Korea is the most remarkable line on the chart. In 1960 its output per person, $1,548, was a quarter of Japan’s and below Ghana’s; 88 of the 122 countries of a million people or more with an estimate were richer. It grew by 7.0% a year for forty years, passed Japan in 2019 and Britain in 2020, and is now 28 times as rich as in 1960. Measured by the best 25 years of growth since 1950, only Iraq and Angola, both oil economies bouncing back from war, beat Korea, Japan and Taiwan. China’s output per person has grown 12.2 times since 1978.
The gap
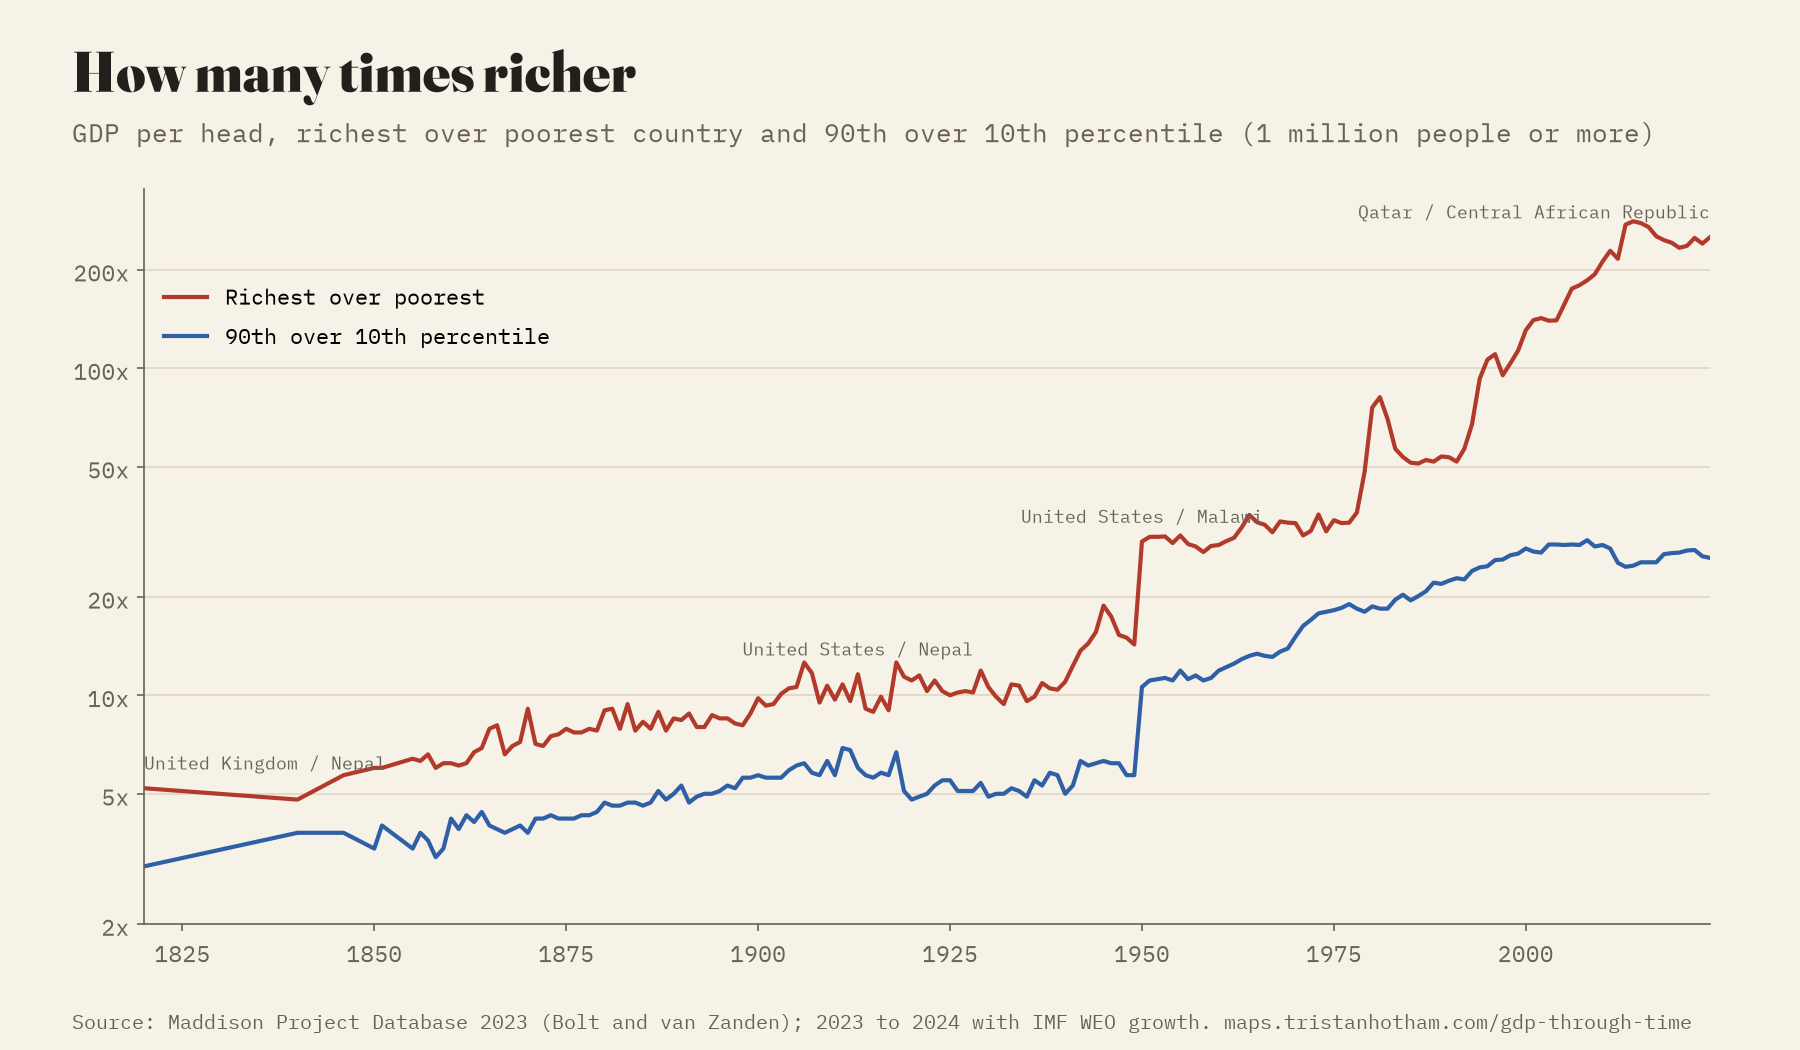
In 1820 the richest country with an estimate (of those with a million people or more) had 5.2 times the output per person of the poorest. In 1913 it was 11.6 times, in 1950 29.5, and in 2024 it is 251 times: Qatar against the Central African Republic. The very top is often a small oil state, so I also compare a country nine-tenths of the way up the ranking with one a tenth of the way up. That ratio rose from 3.0 in 1820 to 28.1 in 2000 and has eased slightly since. Part of the early rise is coverage, because the poorest countries are the least likely to have early estimates, but the widening between nations is real.
The hatched map
The thing I most wanted the map to show is how little we know. Press “AD 1” and almost everything is hatched: Maddison has estimates for 14 present-day countries, all in or beside the Roman world, and several of them share a single regional figure. In 1500 there are 11; in 1700, 17. The long series that exist come from a handful of European archives, colonial Mexico and Peru, and estimates at intervals for China, Japan and India. Among those few, the Netherlands was the richest in 1600 and 1700. The second richest in 1700 is “South Africa”, which here means the small Dutch colony at the Cape: a reminder that a present-day name can hide a very small place.
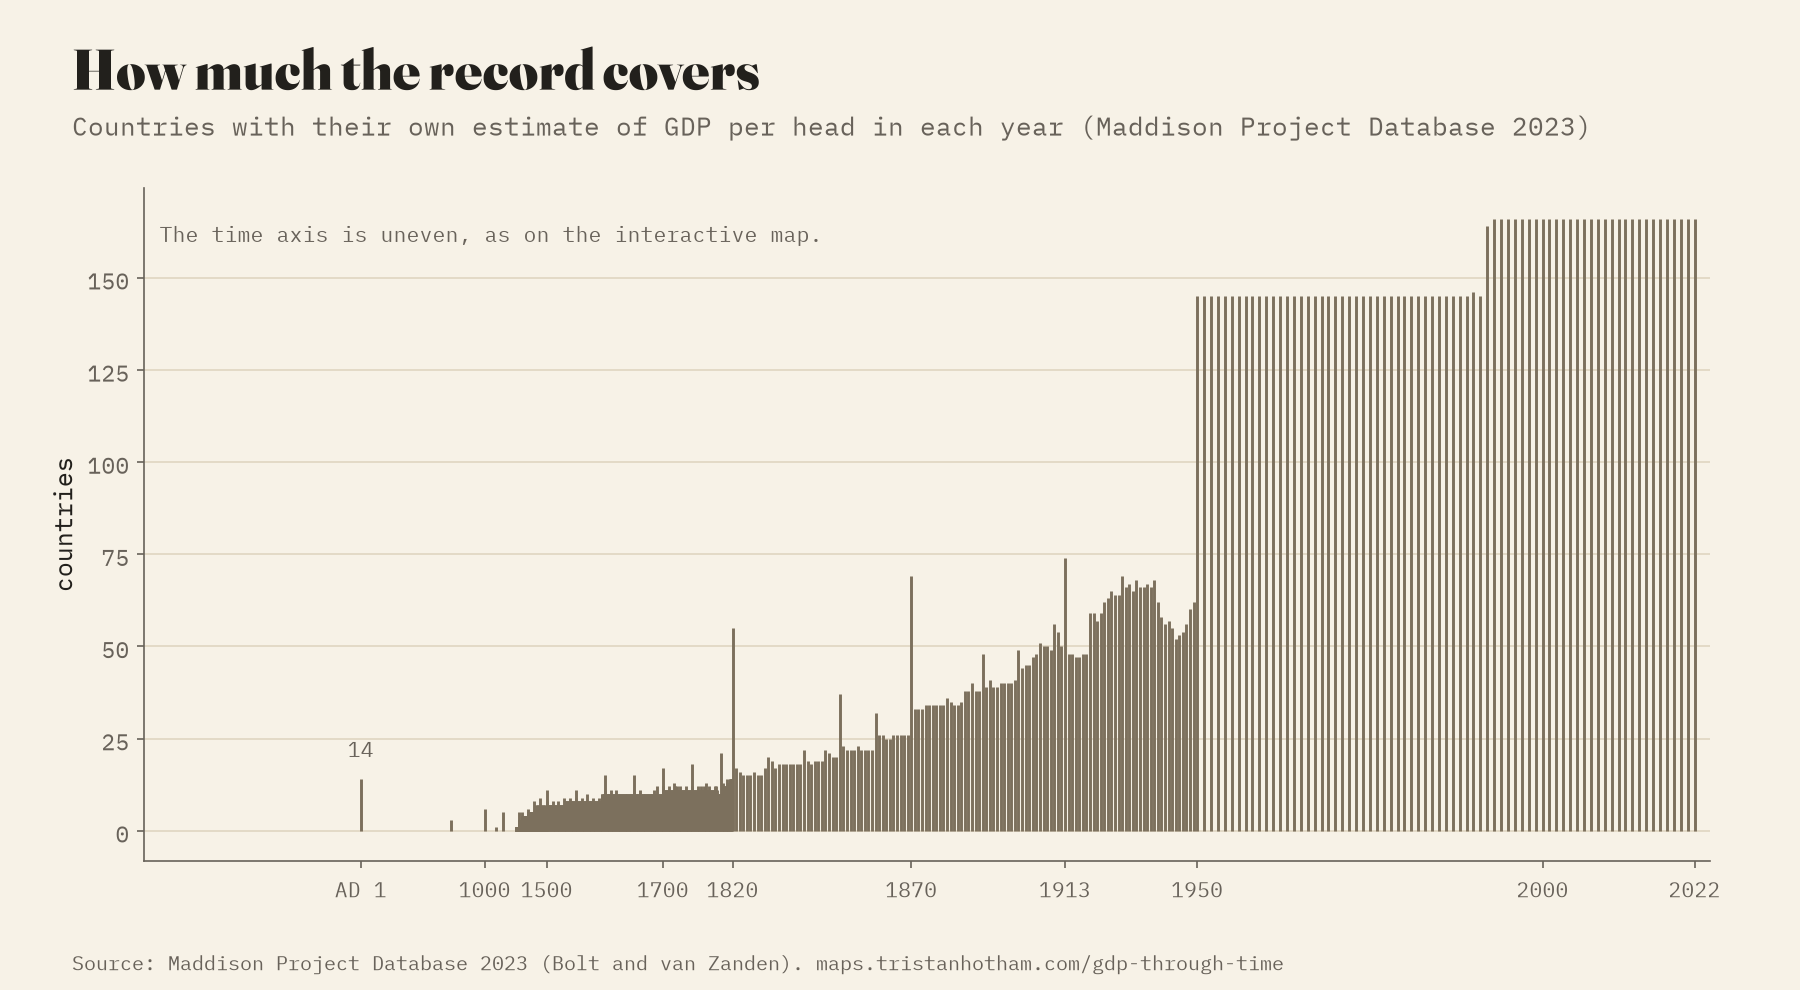
How I did this
Before 1820 the world numbers come from DeLong, HYDE and McEvedy and Jones, and the regions from Maddison’s 2010 tables, rescaled once so they meet the modern series in 1820. The national values, from AD 1 on, all come from the Maddison Project Database 2023, GDP per person and population in 2011 dollars adjusted for purchasing power. The database ends in 2022, so I carried each country forward to 2024 with the IMF’s growth rates (October 2025 World Economic Outlook). Total GDP is output per person times population; where a year lacks population I interpolate between Maddison’s figures if they are at most 30 years apart. Shares of the world use Maddison’s own world totals, which start in 1820.
The colours always sit on today’s borders, because that is what the numbers describe: “Germany” in 1820 means the territory of modern Germany. The faint dashed lines are the borders of the time, from the historical-basemaps project, there only for context. The USSR, Yugoslavia and Czechoslovakia appear whole until they broke up. Where a country has no estimate for the year you pick, the map shows its nearest estimate up to 10 years away, dotted, and you can switch that off.
Some honest caveats. Early estimates rest on wages, prices and harvests, and their margins are wide. Comparing buying power across two centuries is an approximation. GDP measures market output, not well-being or how it is shared. And each new Maddison release revises the past, sometimes a lot.
Notes and sources
- Maddison Project Database, version 2023: Bolt, J. and van Zanden, J. L. (2024), “Maddison style estimates of the evolution of the world economy: a new 2023 update”, Journal of Economic Surveys. DataverseNL, doi:10.34894/INZBF2 (CC BY 4.0). The paper lists the original studies behind the countries charted here, as the database asks.
- Before 1820: J. Bradford DeLong (1998), “Estimates of world GDP, one million B.C. to present”; HYDE 3.2.1 (Klein Goldewijk and others, 2017); McEvedy and Jones (1978), Atlas of World Population History; Maddison (2010), Historical Statistics of the World Economy. All taken from David Roodman’s (2020) compilation for “Modeling the Human Trajectory”.
- IMF World Economic Outlook database, October 2025, used only to carry the series from 2022 to 2024.
- historical-basemaps by André Ourednik and contributors (GPL-3.0), for the borders of the time; Natural Earth (public domain) for today’s borders.
- I wrote the text, with drafting and editing assistance from Claude (Anthropic), which also helped prepare the analysis code. I reviewed and checked all text and results.

