
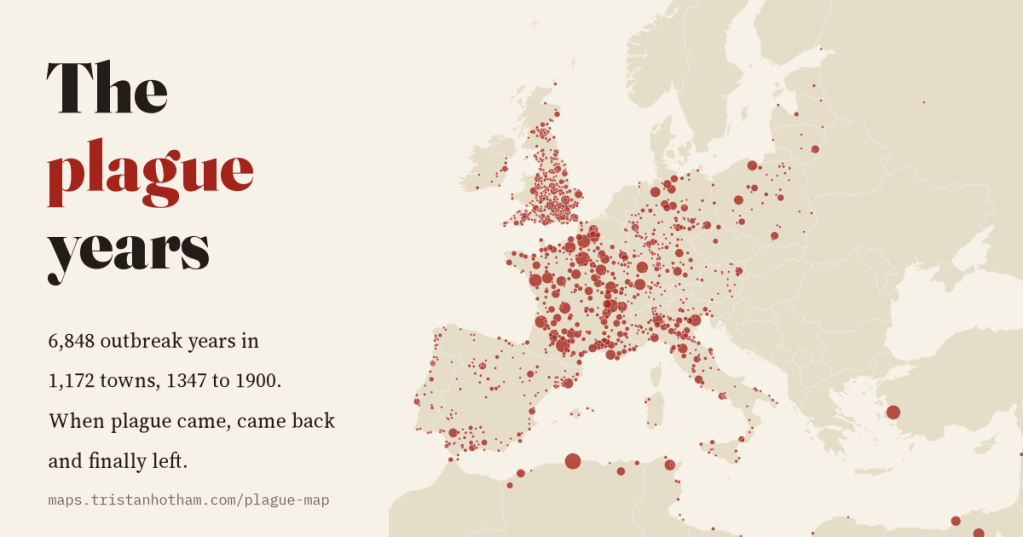
The Black Death reached Sicily in 1347, and then it kept coming back, to the same towns, roughly once a generation, for three hundred years. I mapped 6,848 recorded outbreak years in 1,172 towns, year by year, to watch plague arrive, return and finally leave.
Most of us learn about plague as a single catastrophe: the Black Death of 1347 to 1351, a third or more of Europe dead, and then, somehow, the Renaissance. But for the people who lived through the following centuries, plague was not a single event. It was a recurring fact of town life, something your grandparents remembered and your grandchildren would probably see.
In the 1970s the French demographer and historian Jean-Noël Biraben compiled an inventory of plague outbreaks across Europe and the Mediterranean, place by place and year by year. In 2012 Ulf Büntgen and colleagues digitised it and published it as open data. After some repairs (more on those below) it holds 6,848 town-years with plague recorded, in 1,172 towns, from Messina in 1347 to Porto in 1900. I put all of it on an animated map you can play like a film.
Four years from Sicily to the Baltic
The first records are in ten towns in 1347, all of them Mediterranean ports or close to one: Messina and the other Sicilian ports, Reggio across the strait, Naples, Genoa and Cagliari. In 1348 plague is recorded in 110 towns, from Alexandria and Cairo to Seville, Bordeaux, London and Bristol. In 1349 it reaches Paris and the German lands, and in 1350 the Baltic.
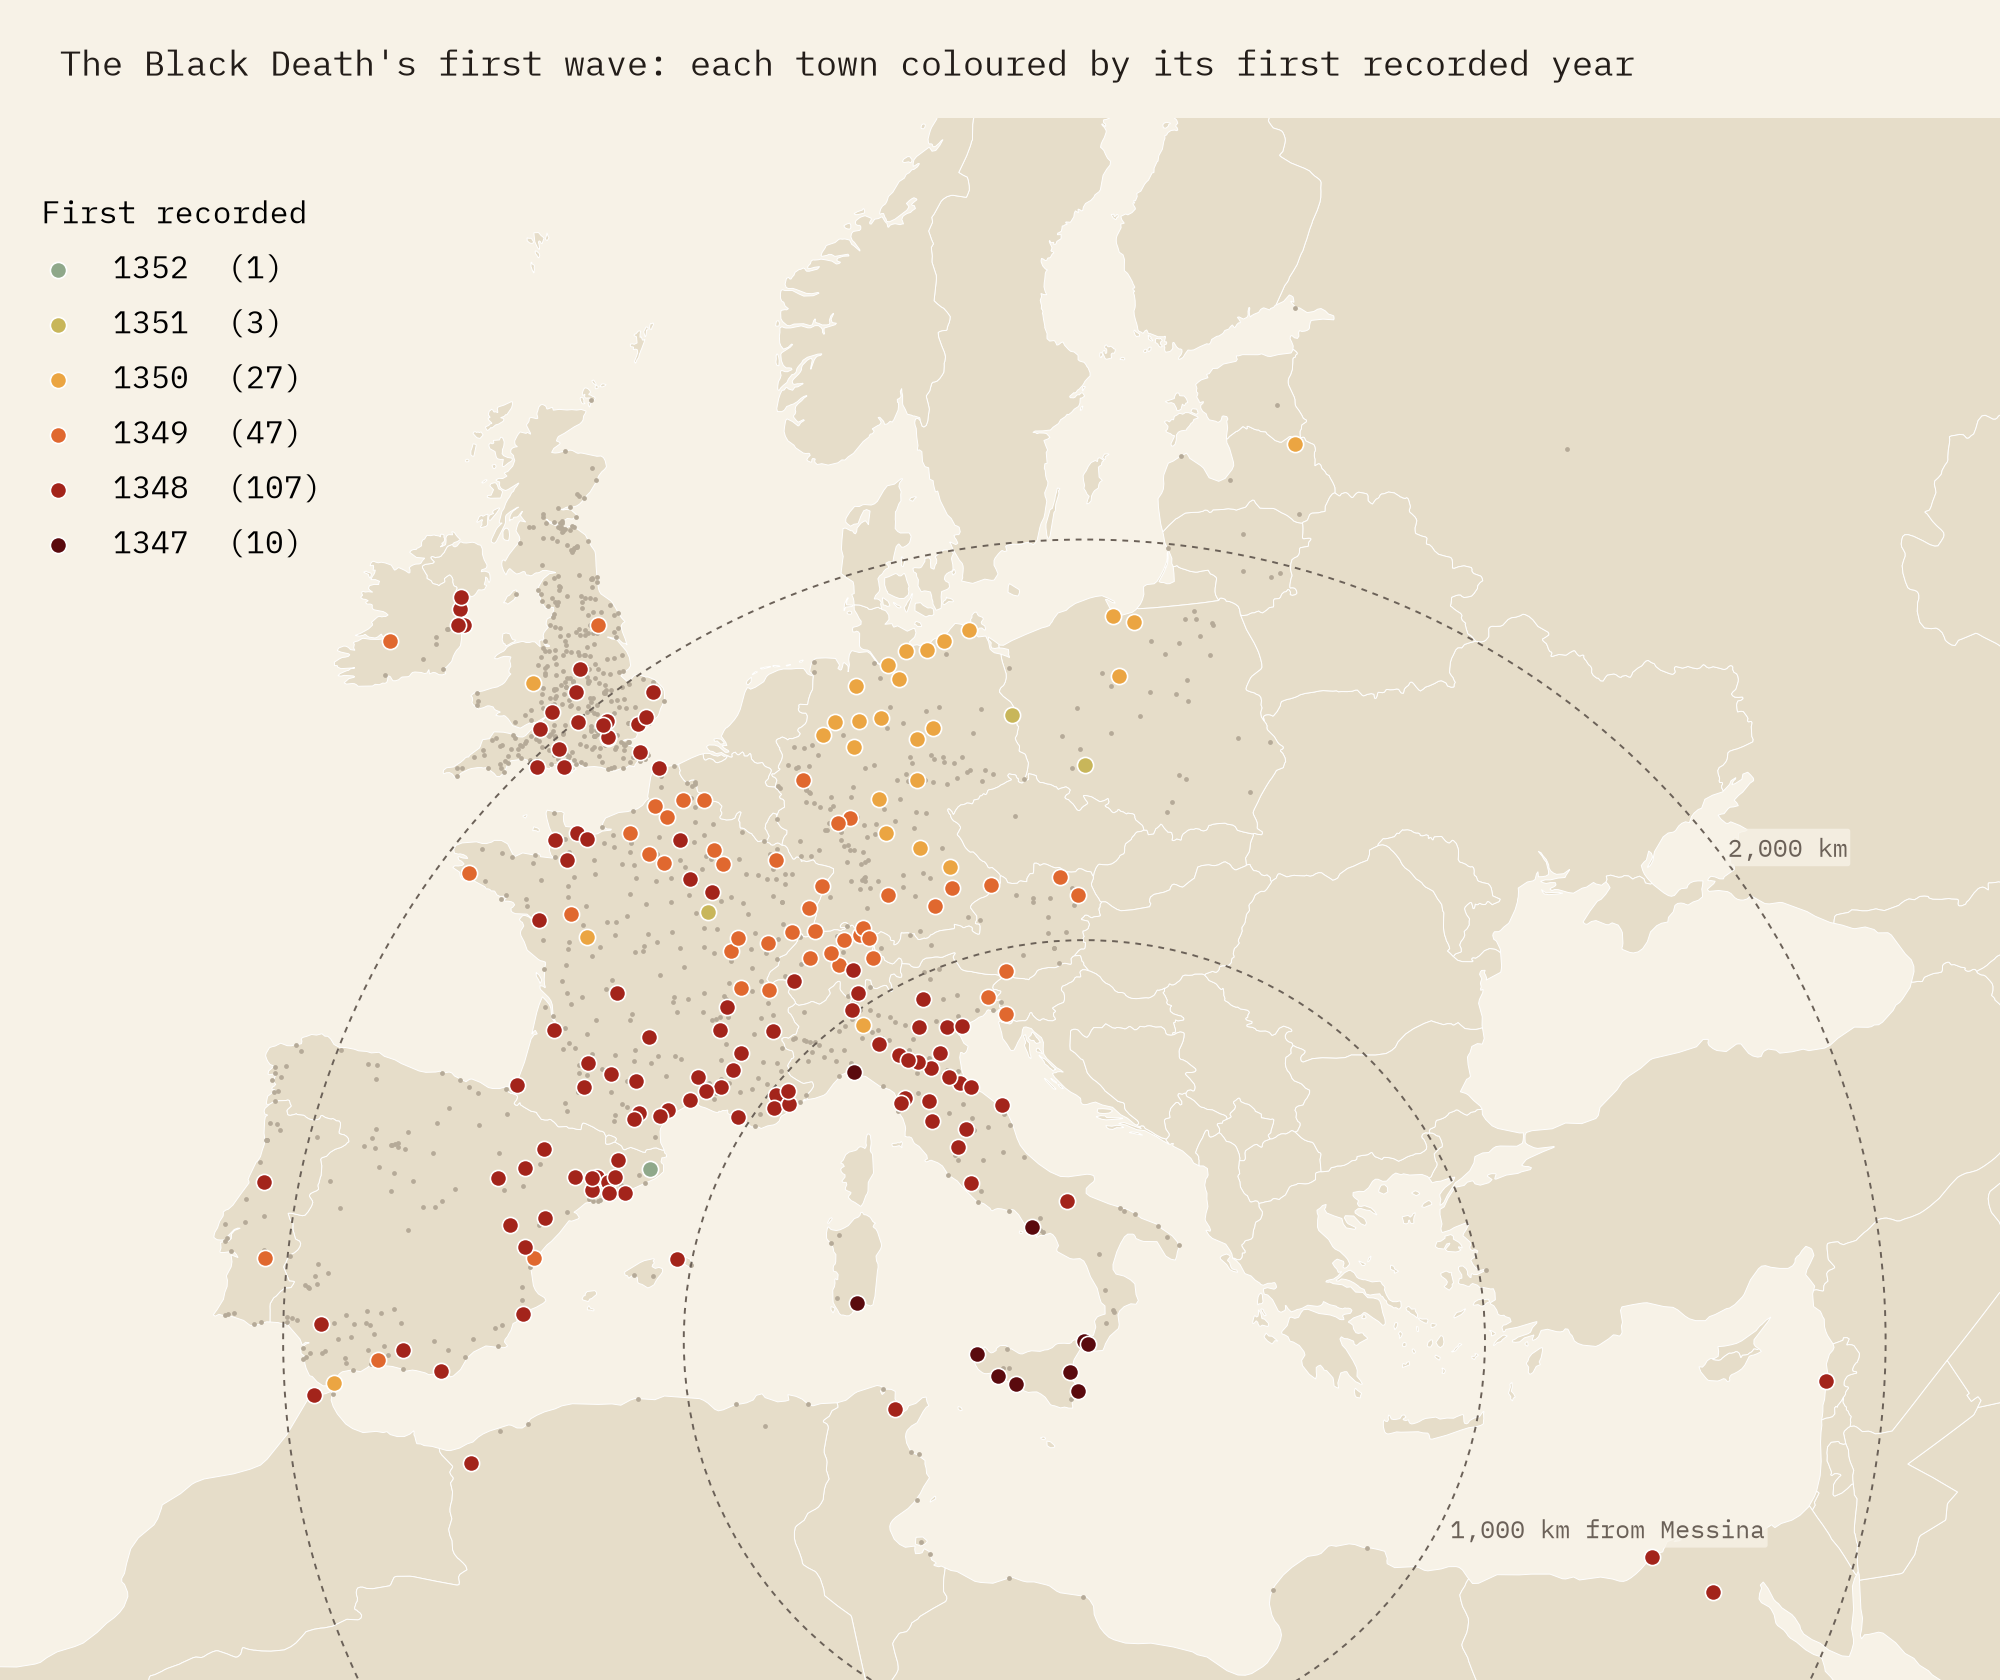
How fast was it? That is a harder question than it looks. The inventory gives years, not days, and the first surviving record of plague in a town is not the day it arrived. Ships also carried it in great leaps: it was in England, about 2,000 km from Messina, in 1348, while towns much nearer were not reached until 1349 or 1350. Fitting a line through distance and year gives somewhere between 176 and 214 km a year as the crow flies, or roughly half a kilometre a day, depending on how you measure it. Treat that as an average over fast sea passages and slow overland spread, not the speed of any single journey.
It never really left
Press play on the map and the surprise is what happens after 1350. Plague is recorded in almost every decade until the 1660s, and the busiest decade in the whole record is not the 1340s but the 1630s, with 570 town-years, when plague swept France and northern Italy. The single busiest year is 1630, with 119 towns.
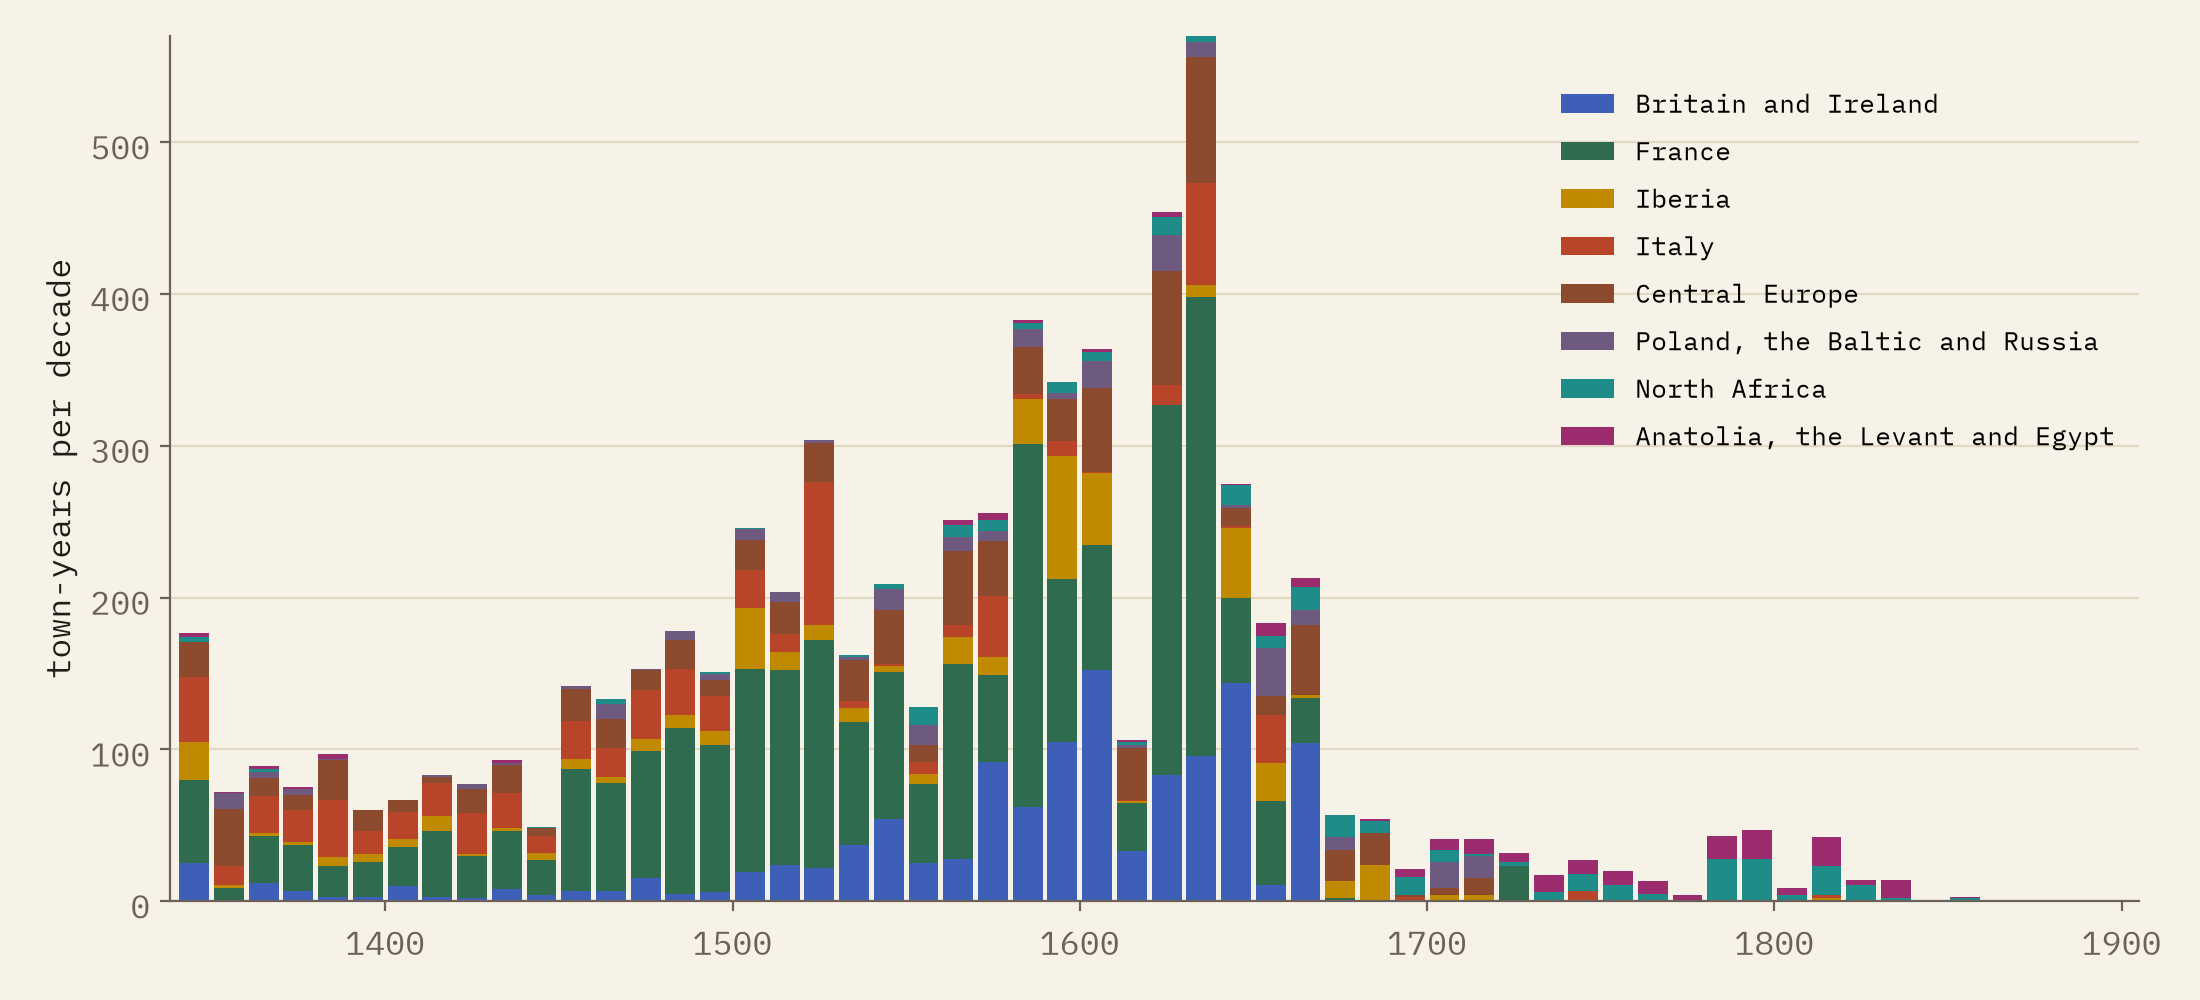
Some of that rise is a rise in paperwork. Town archives, health boards and printed bills of mortality multiply in the sixteenth and seventeenth centuries, so later outbreaks are more likely to have been written down and to have survived. But the shape is real enough: plague was a fixture of European life for three centuries.
Once a generation, or more often
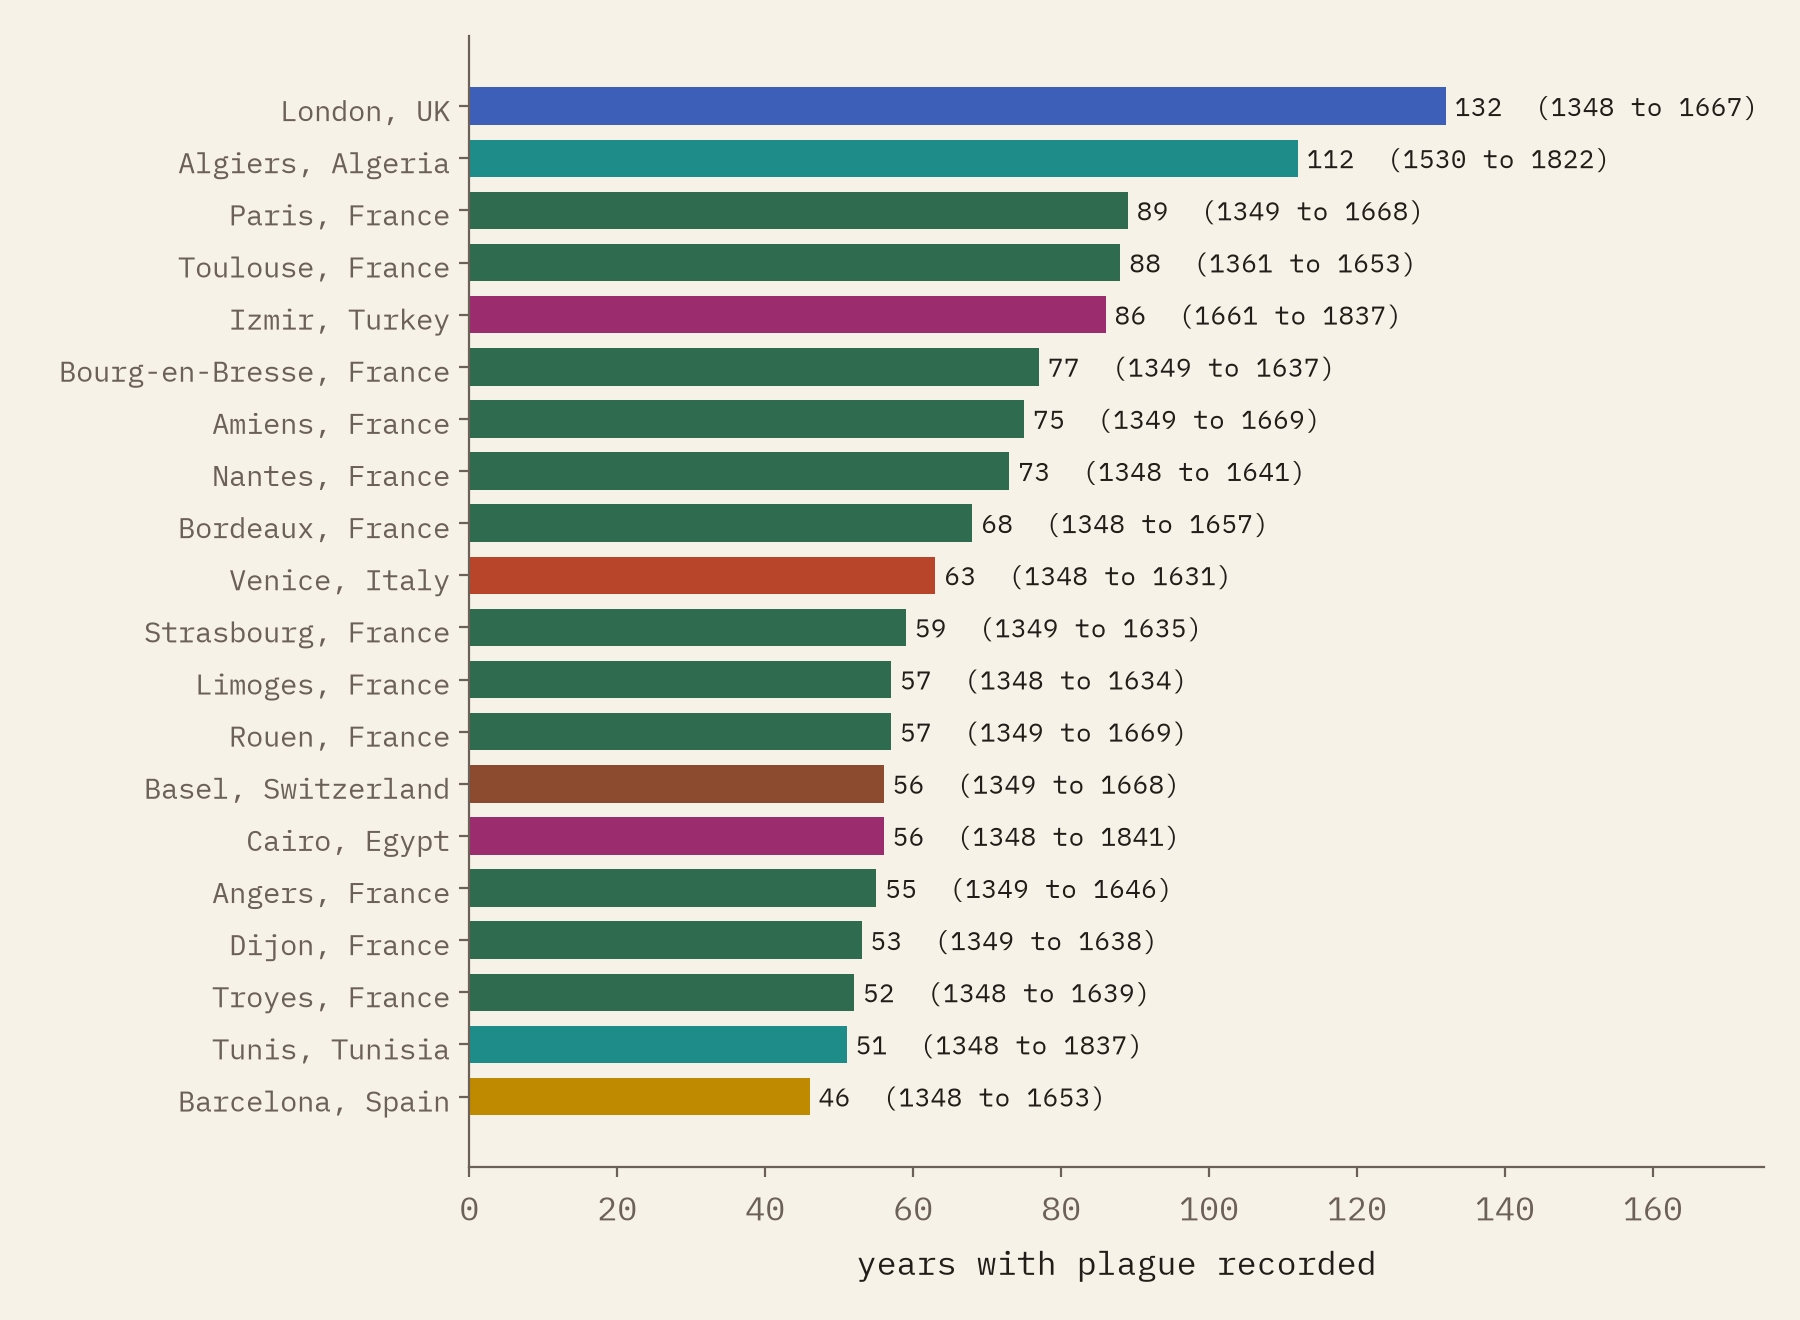
London has the most outbreak years in the inventory, 132 between 1348 and 1667, ahead of Algiers (112), Paris (89) and Toulouse (88). Big numbers belong to big towns with good records: London’s bills of mortality are among the best plague sources anywhere.
When plague struck it often lingered over a winter, so I joined consecutive outbreak years into a single episode. The median gap from one episode to the next in the same town is 13 years, and half of all gaps fall between 6 and 31 years. Over the centuries the gaps get shorter, from a median of 18.5 years for episodes starting in the fourteenth century to 11 in the seventeenth. A child born just after an epidemic would very likely see the next.
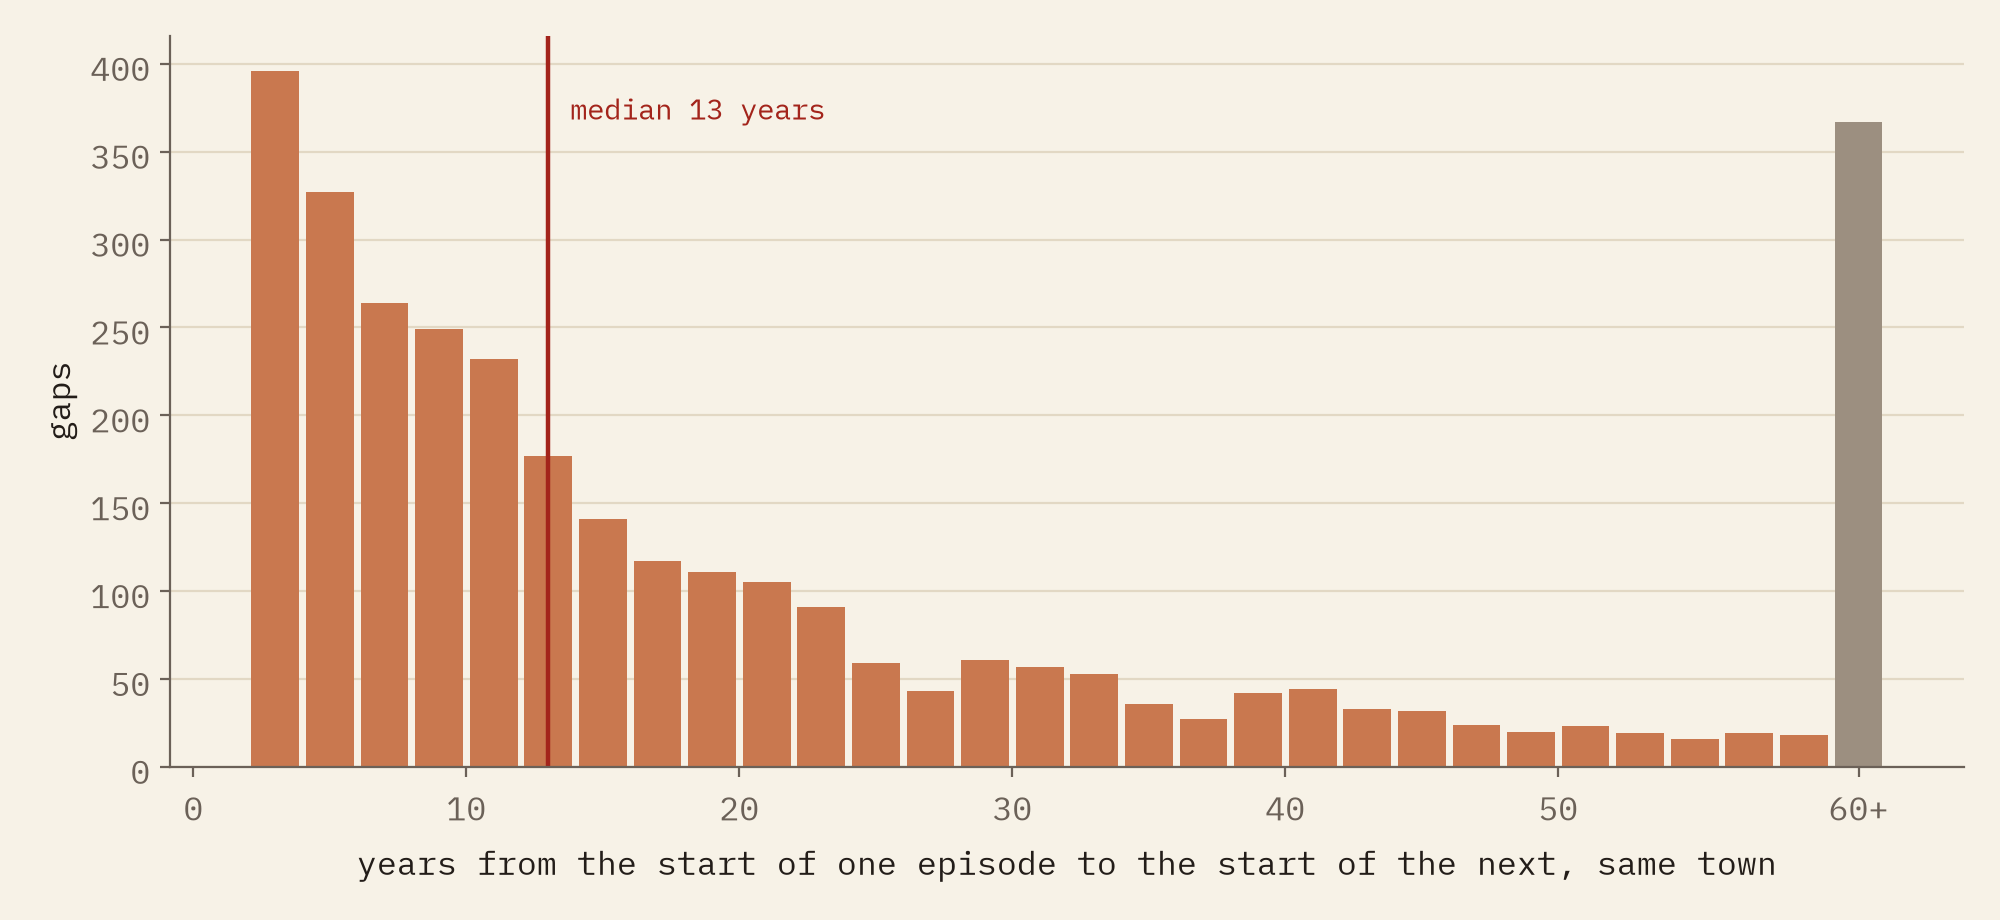
London has 132 plague years in the record. Constantinople, one of the great plague cities, has none.
When plague left
Plague did not leave Europe all at once. Taking the last year in which three or more towns in a region record it, plague left Italy first (1657), then Britain and Ireland (1667, the tail of London’s Great Plague), Iberia (1681), Poland and the Baltic (1712), central Europe (1713) and France (1722, after the Great Plague of Marseille). In North Africa it stayed widespread until 1821, and in Anatolia, the Levant and Egypt until 1834: 167 years after Britain.
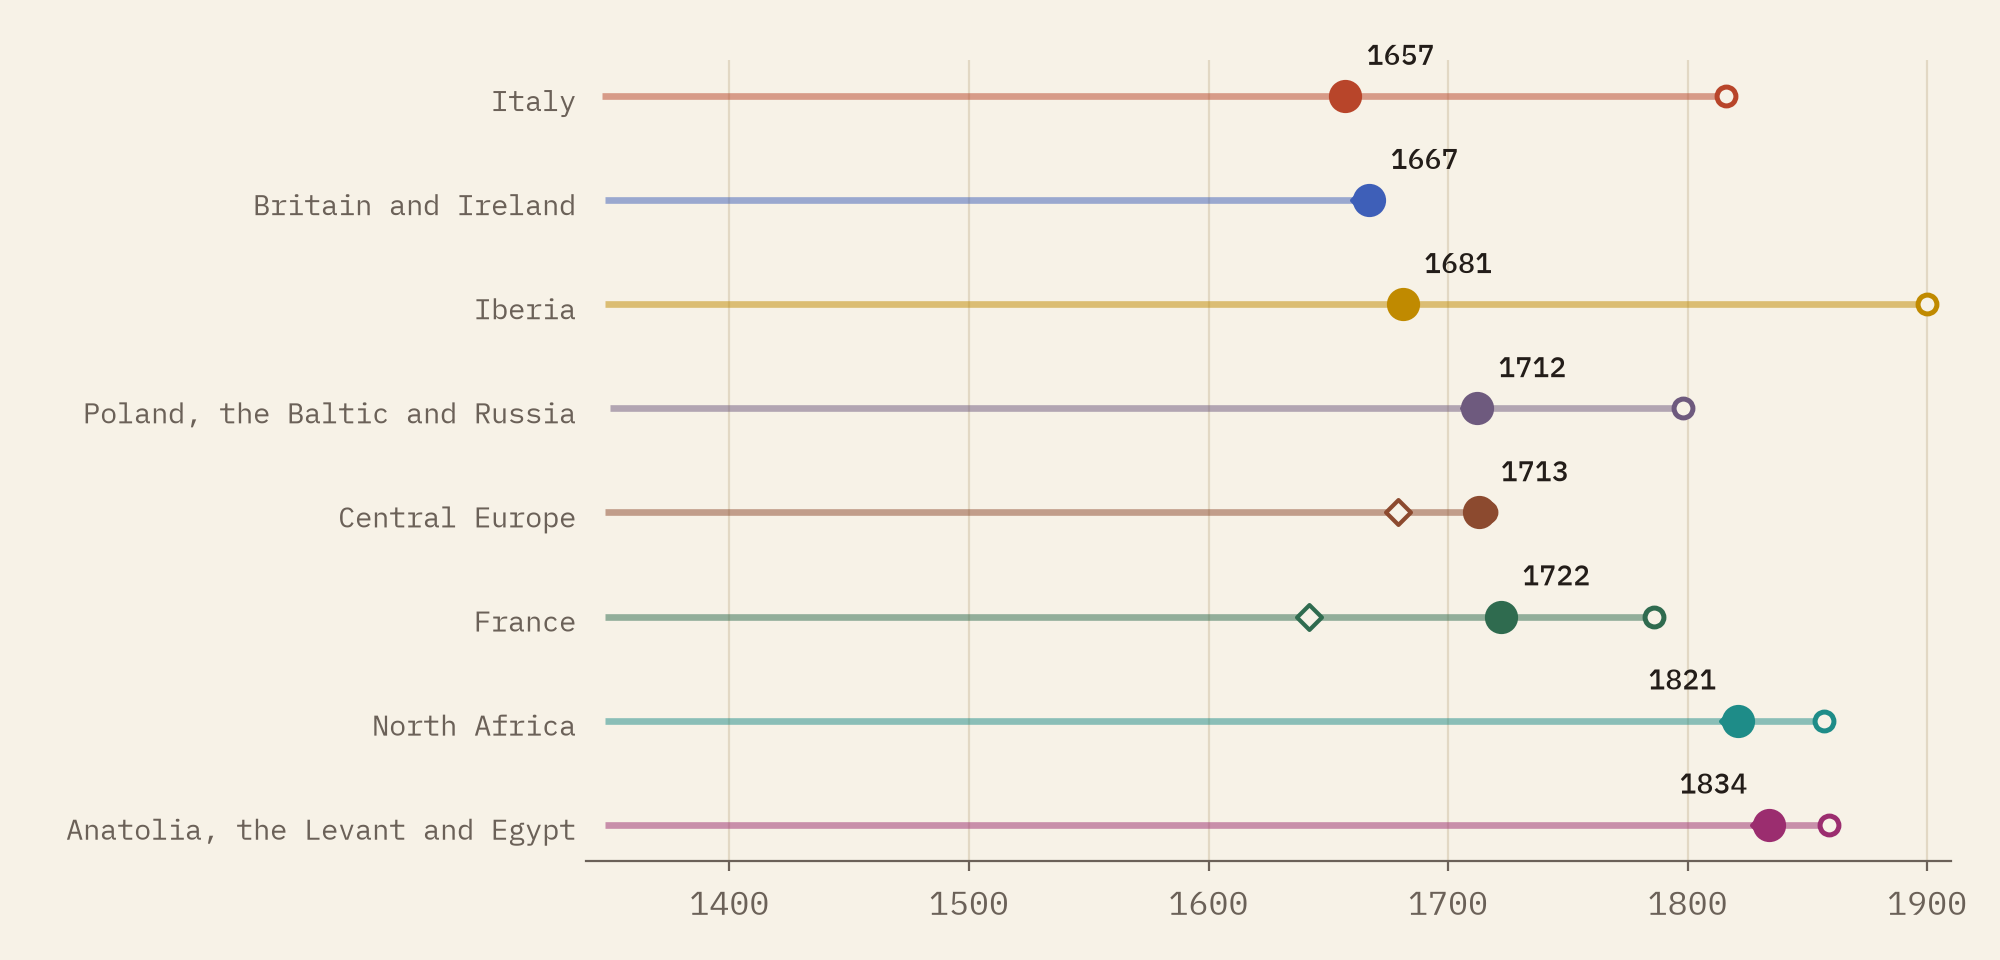
The famous last epidemics are all there: London in 1665 (recorded in 57 British towns that year), Marseille in 1720 to 1722, Messina again in 1743. So are some strays: a single year at Marseille in 1786, Noicattaro near Bari in 1815, Mallorca in 1819, and Porto in 1899, which was the third pandemic arriving by sea rather than the last of the second.
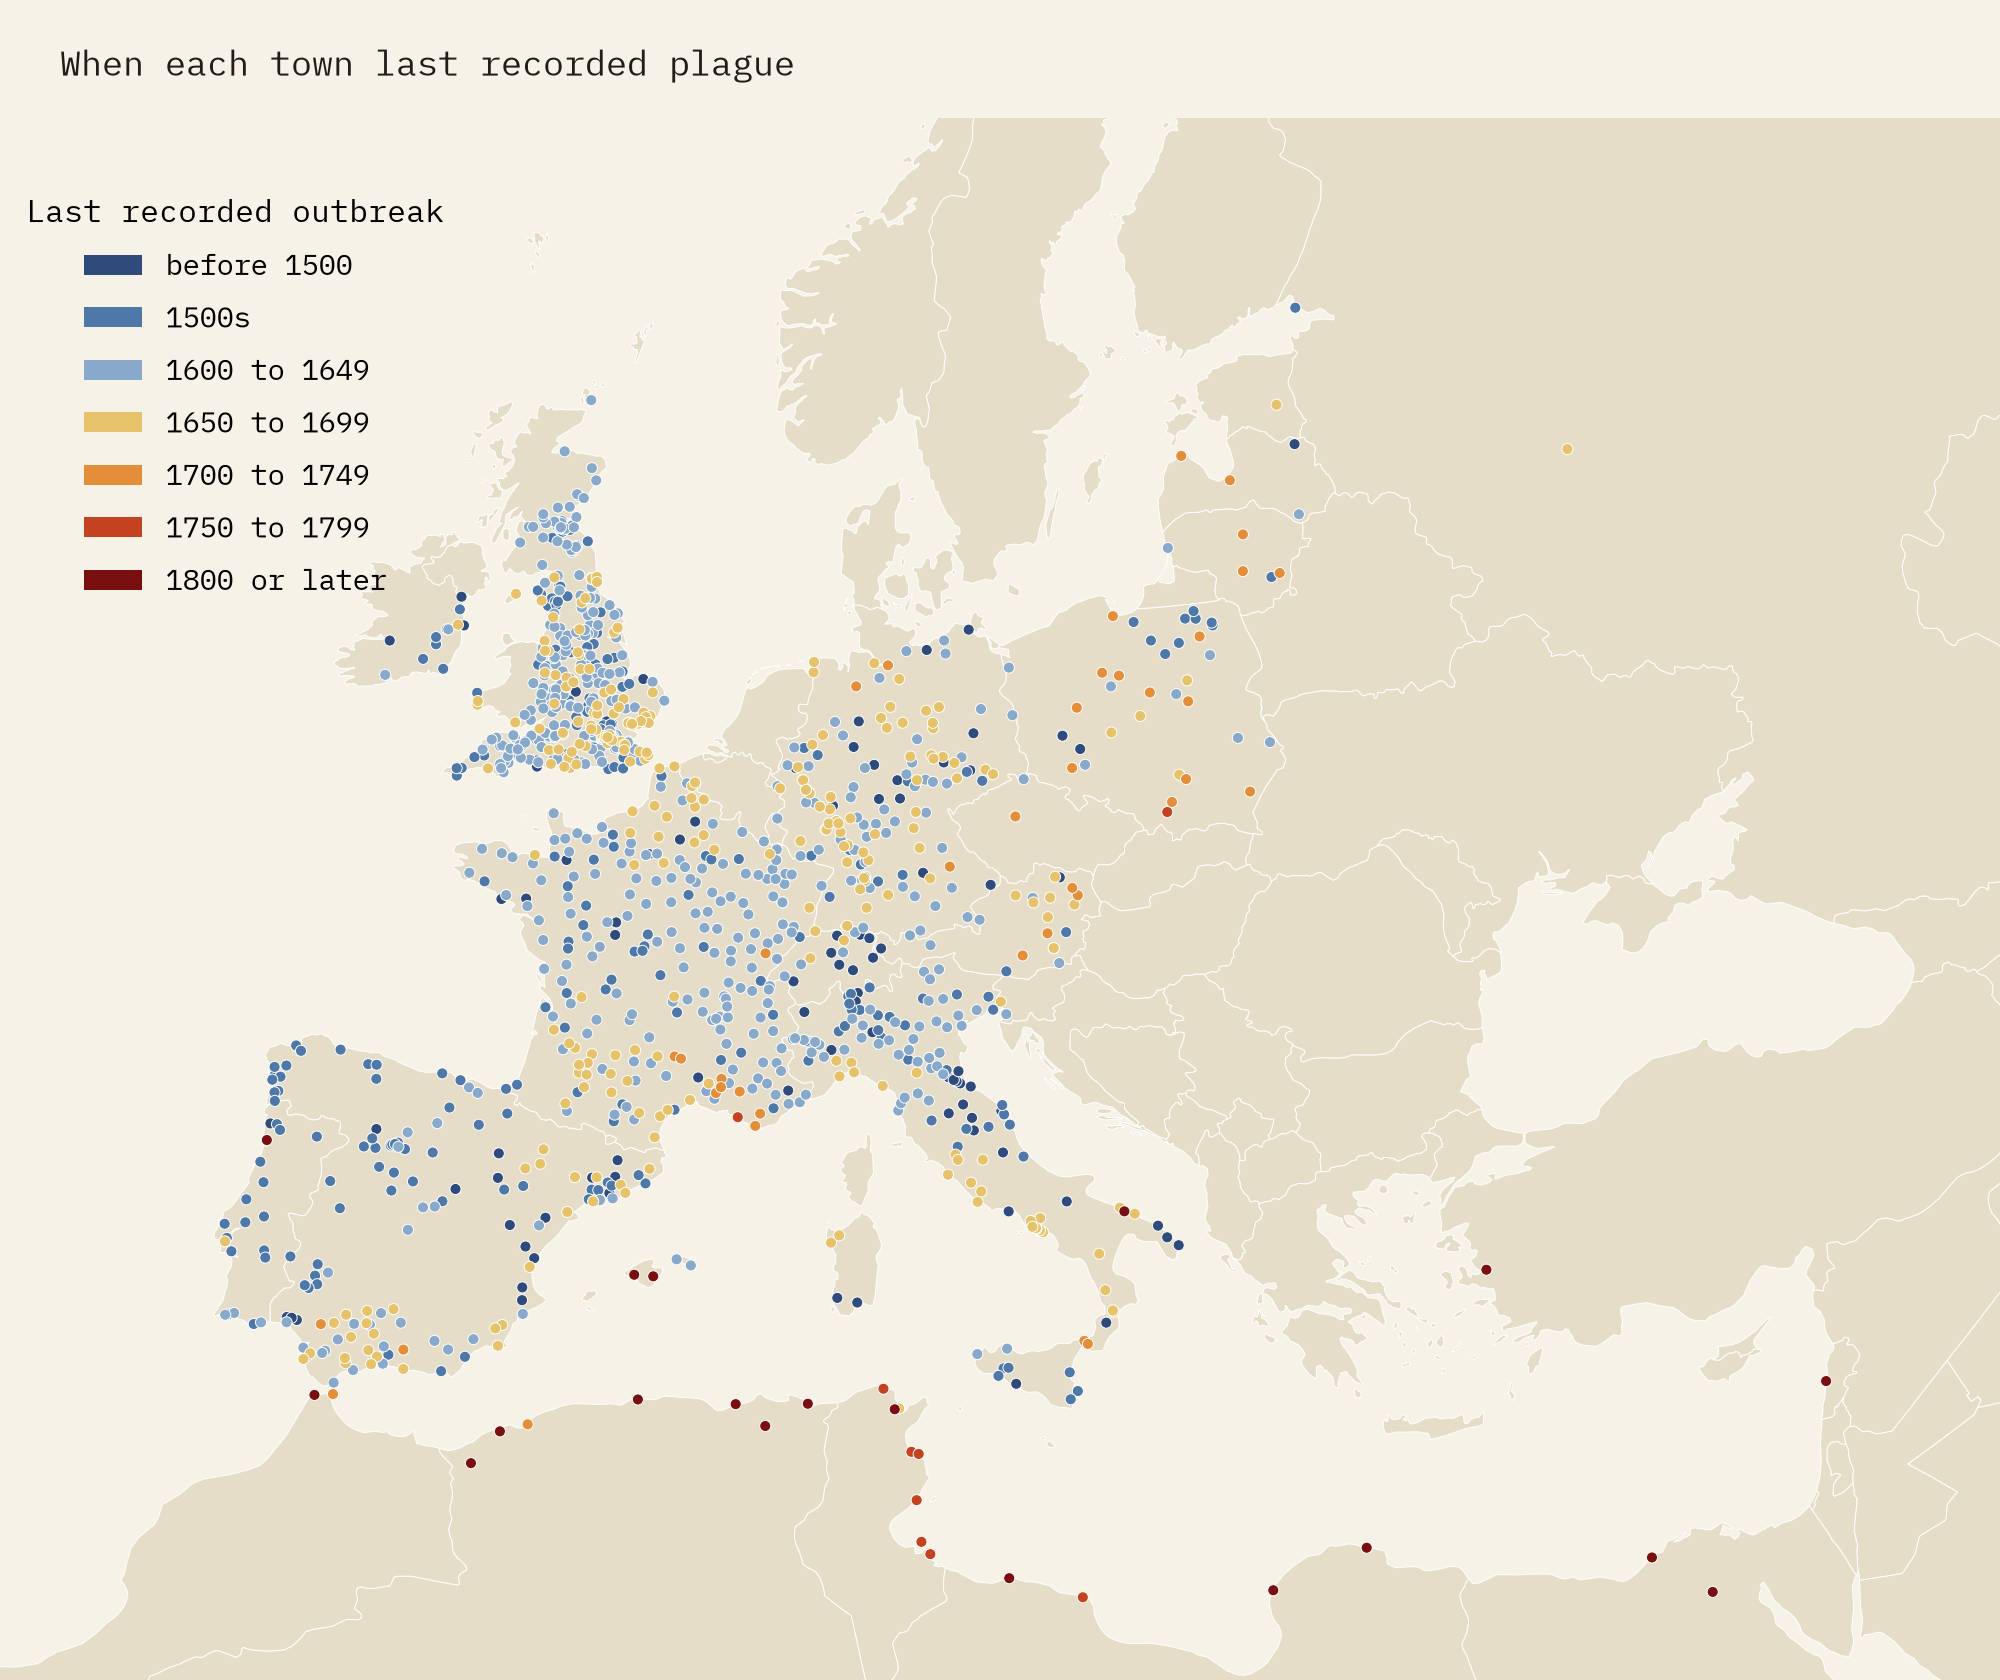
A map of surviving documents
The honest caveat is a big one. This is a map of where plague was written down, where the writing survived, and where Biraben and the historians he relied on looked. France alone holds 40% of the outbreak years. The Low Countries, Scandinavia, Hungary and the Balkans have few or no records. Moscow’s terrible epidemic of 1771 is missing, Russia appears only twice, and Constantinople not at all. The inventory says plague was present in a year, not how many people died, so a handful of cases counts the same as a catastrophe. Some years are approximate.
How I did this
I started from the published file of 6,929 rows. Its latitude and longitude columns are swapped, which I checked against its own projected coordinates; two rows for Eisleben were broken by a comma in the name; one row has the year 9999; and 80 rows repeat a town and year. A few towns had been geocoded to the wrong place by a computer (Prague to a village in Bavaria, Milan to near Treviso, Noja near Bari to Cantabria in Spain), and I moved the five clearest cases. Each town is placed in a modern country and one of eight regions. Consecutive outbreak years in a town count as one episode for the recurrence figures, and the first-wave speeds are straight-line slopes fitted through distance and year. The paper sets out every step and caveat, and the cleaned data are free to reuse.
Notes and sources
- Büntgen U, Ginzler C, Esper J, Tegel W, McMichael AJ (2012) Digitizing historical plague. Clinical Infectious Diseases 55(11), 1586 to 1588. Data: EnviDat, doi:10.16904/envidat.181, Open Database Licence 1.0. The cleaned tables I publish are a derived database, also under the ODbL.
- Biraben J-N (1975 to 1976) Les hommes et la peste en France et dans les pays européens et méditerranéens. Paris and The Hague: Mouton.
- Roosen J, Curtis DR (2018) Dangers of noncritical use of historical plague data. Emerging Infectious Diseases 24(1), 103 to 110: a good guide to the limits of sources like this one.
- Natural Earth country outlines and places (public domain).
- I wrote the text, with drafting and editing assistance from Claude (Anthropic), which also helped prepare the analysis code. I reviewed and checked all text and results.

