
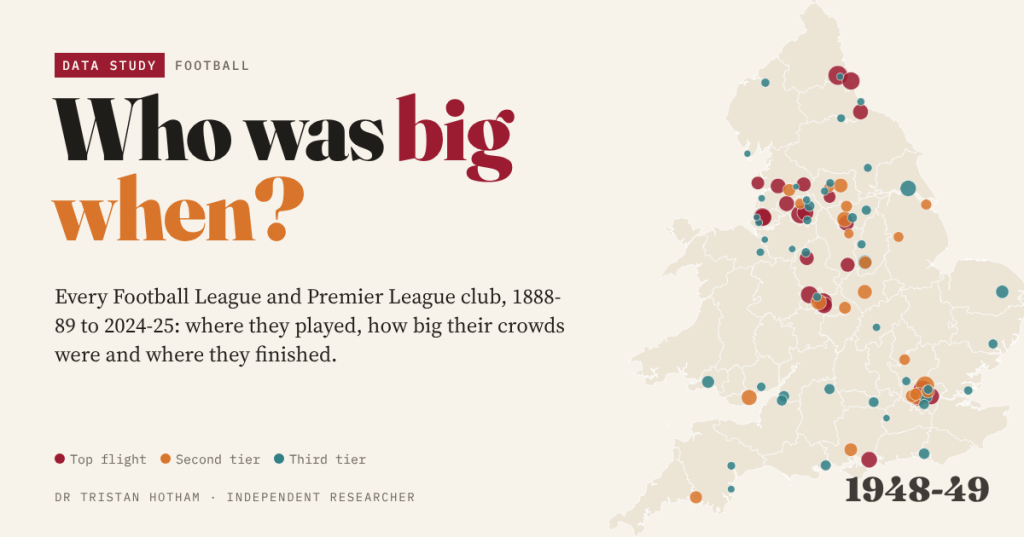
I rebuilt every English league table since 1888 and put every club on a map, sized by its home crowd. It shows a game that began in the Lancashire mill towns, drew 41.2 million people in a single season after the war, lost 60% of them by the 1980s, and moved south.
Every football fan has a version of the argument. Your club was massive once. Theirs only got big recently. Somebody’s grandad saw sixty thousand at a ground that now holds twelve. Most of these arguments are about when, and the answer is usually hiding in old league tables and attendance records that nobody has put side by side.
So I did. James Curley’s engsoccerdata package has every English league result since the first Saturday of the Football League in September 1888, 210,019 matches across 126 seasons (I filled one missing season from openfootball). From those I rebuilt every final table, with the right points for a win and the right tie-breaks for each era. Then I joined each club’s average home league crowd, season by season, from the remarkable collection at englishfootballleaguetables.co.uk. That gives 147 clubs, each with a place, a league position and a crowd, every season.
Twelve clubs from two places
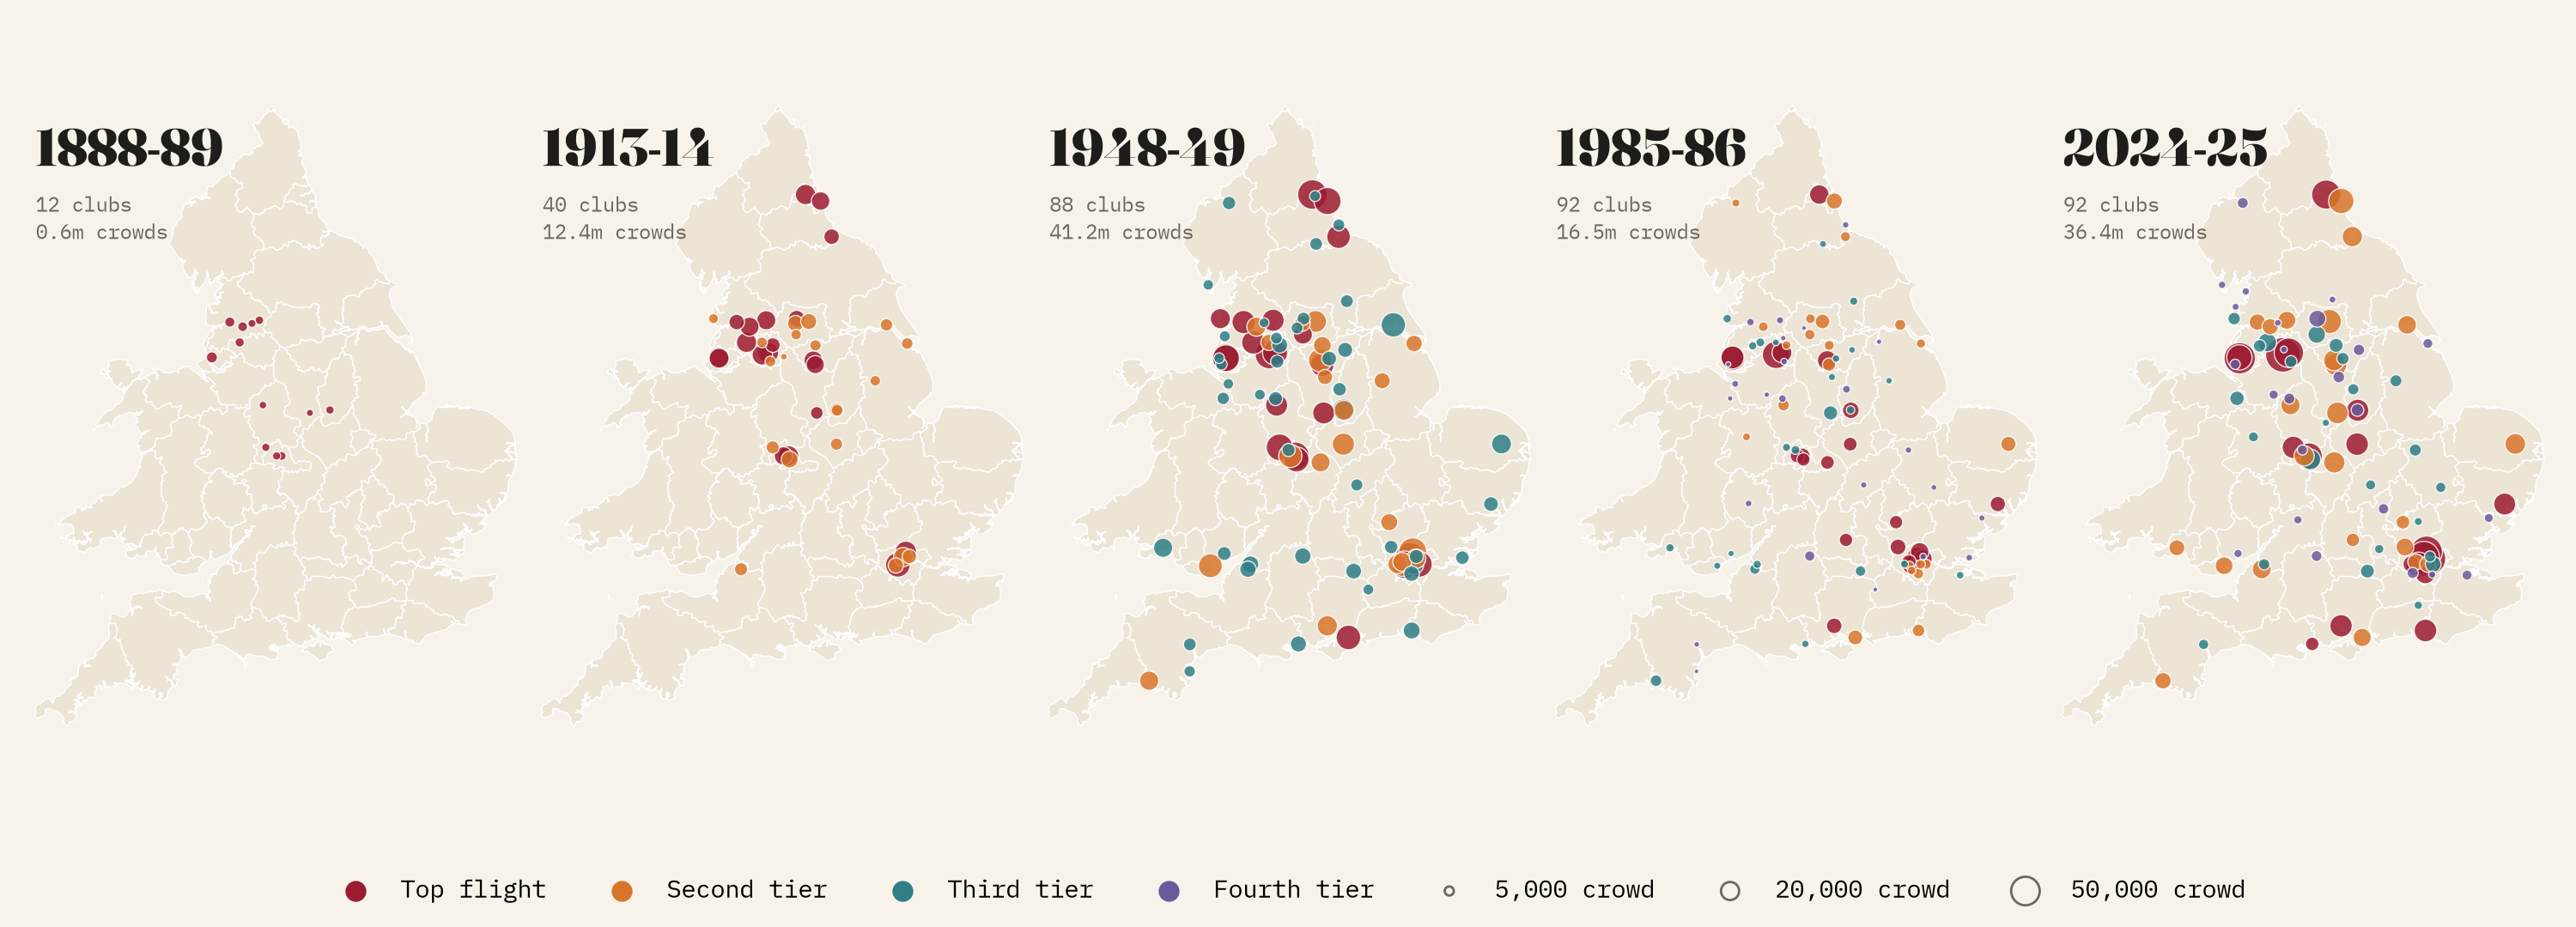
The first season looks almost nothing like now. All twelve founders came from two places: six from Lancashire (Preston, Accrington, Blackburn, Bolton, Burnley and Everton) and six from the Midlands (Aston Villa, Derby, Notts County, Stoke, West Brom and Wolves). The biggest crowd was Everton’s, 7,518 a game. London did not get a league club until 1893-94, and did not get a champion until Arsenal in 1930-31.
11 of the twelve are still in the league. Only 3, Aston Villa, Everton and Wolves, were in the Premier League in 2024-25.
41.2 million, and then the long fall
Crowds grew almost every season until the First World War, and again between the wars. Then came the extraordinary seasons after 1945, when a country short of almost everything else went to the football. In 1948-49 league matches drew 41.2 million people, an average of 22,318 a game across all four divisions. It has never been matched.
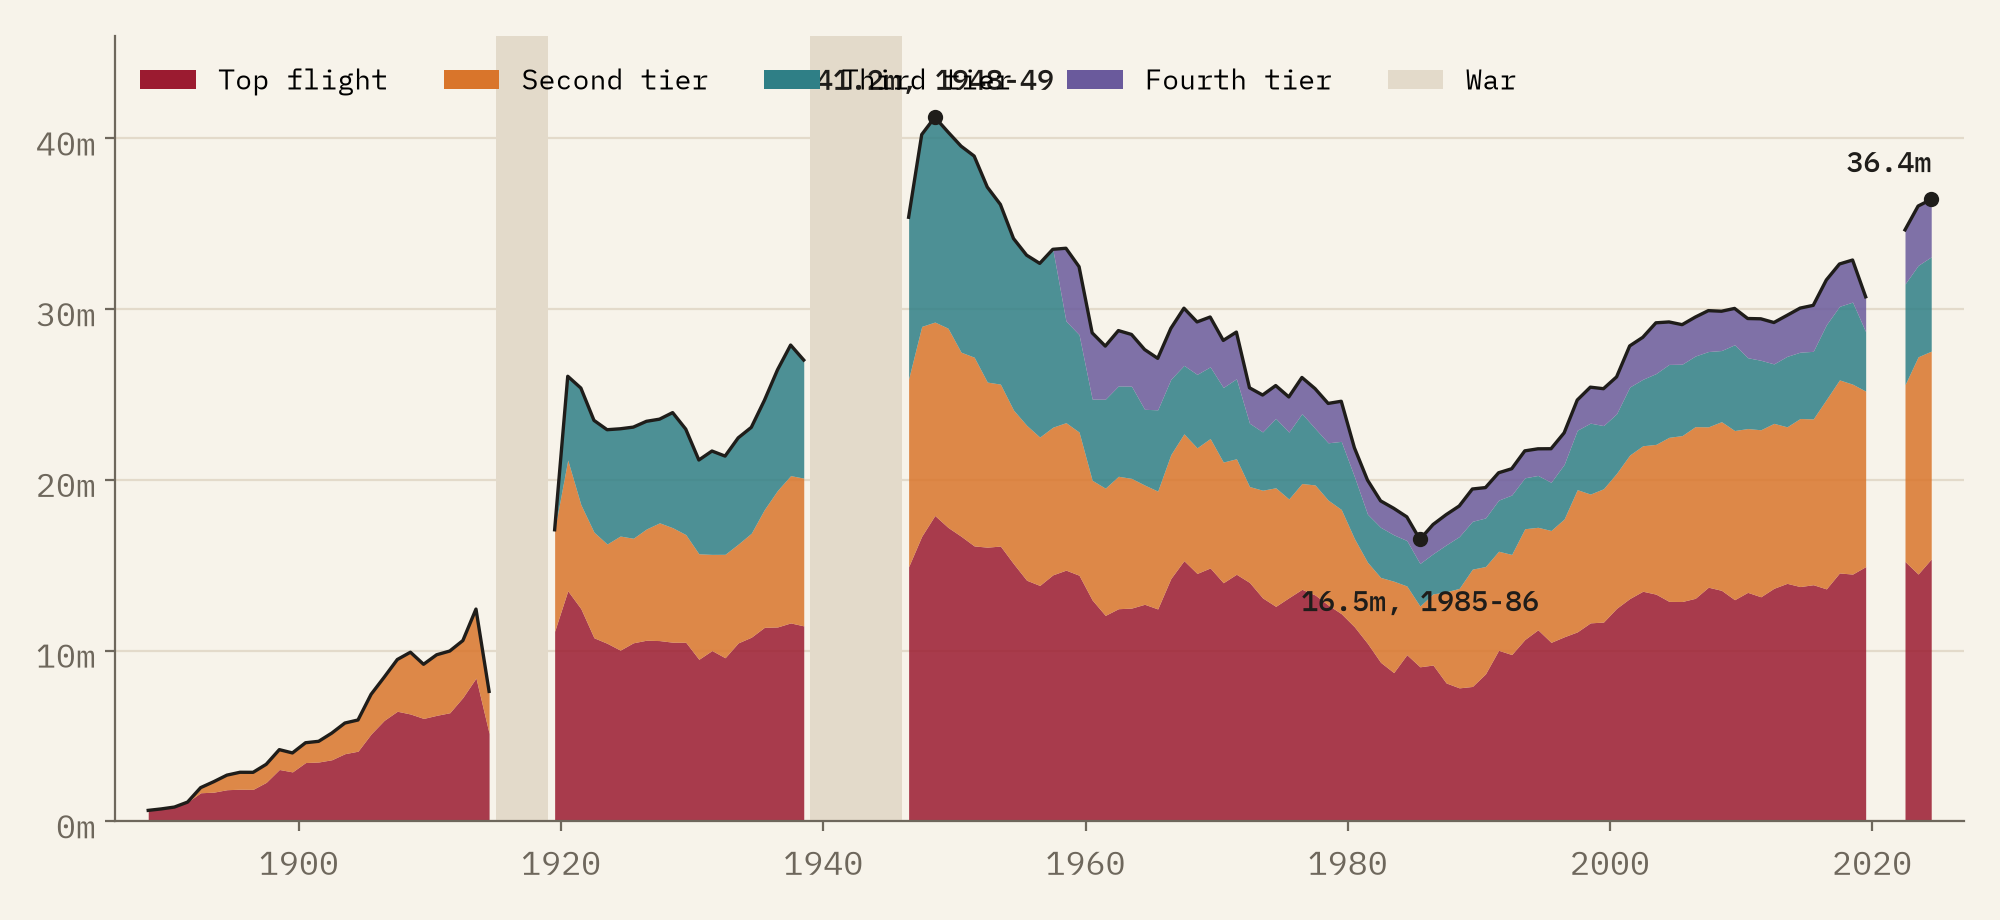
What followed was one of the longest declines in British leisure. Crowds fell in 27 of the next 37 seasons, to 16.5 million in 1985-86: 60% down. That was the season after Bradford and Heysel, and the average top-flight crowd was 19,581. The turn came the very next season, before Hillsborough, before all-seater grounds and before the Premier League, and it has kept coming: 36.4 million in 2024-25, 88% of the peak. Only 6 seasons, all between 1947-48 and 1952-53, beat it.
One thing surprised me. The Premier League has nearly doubled its average crowd since 1992, from 21,136 to 40,430, but the top flight’s share of everyone at a league match is 42%, almost exactly what it was in 1948-49 (43%). The Football League has come back too.
The game moved south
Before 1915 the North held 62% of all top-flight places and London and the South just 6%. Since 2010 the North has held 36% and the South, London included, 43%. In 2024-25 the Premier League had 7 London clubs and 5 from the whole of the North. Weight the top flight by its crowds and its centre has moved about 78 km south, from the edge of the Peak District to Leicestershire.
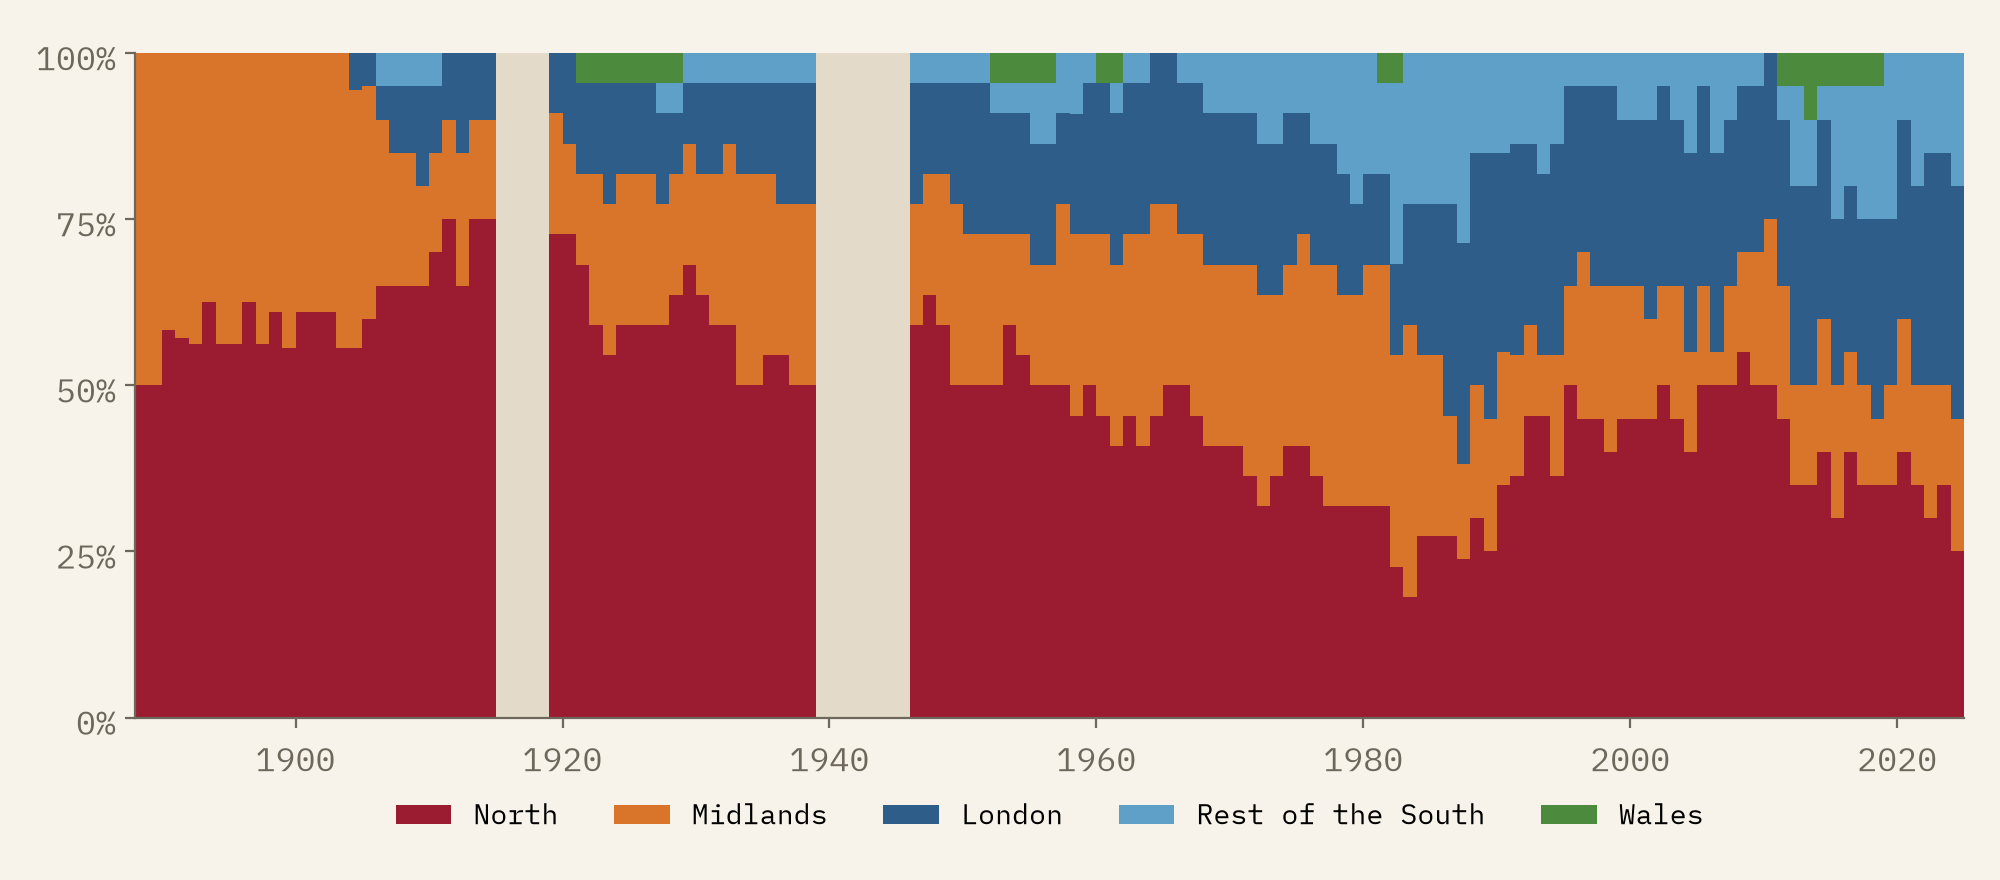
But the titles never left. 87 of the 126 champions have come from the North, and since 2000-01 the North has won 17 of 25, every one for Manchester or Liverpool. The North did not lose its great city clubs. It lost its towns.
The North did not lose its great city clubs. It lost its towns.
The biggest crowd in the land
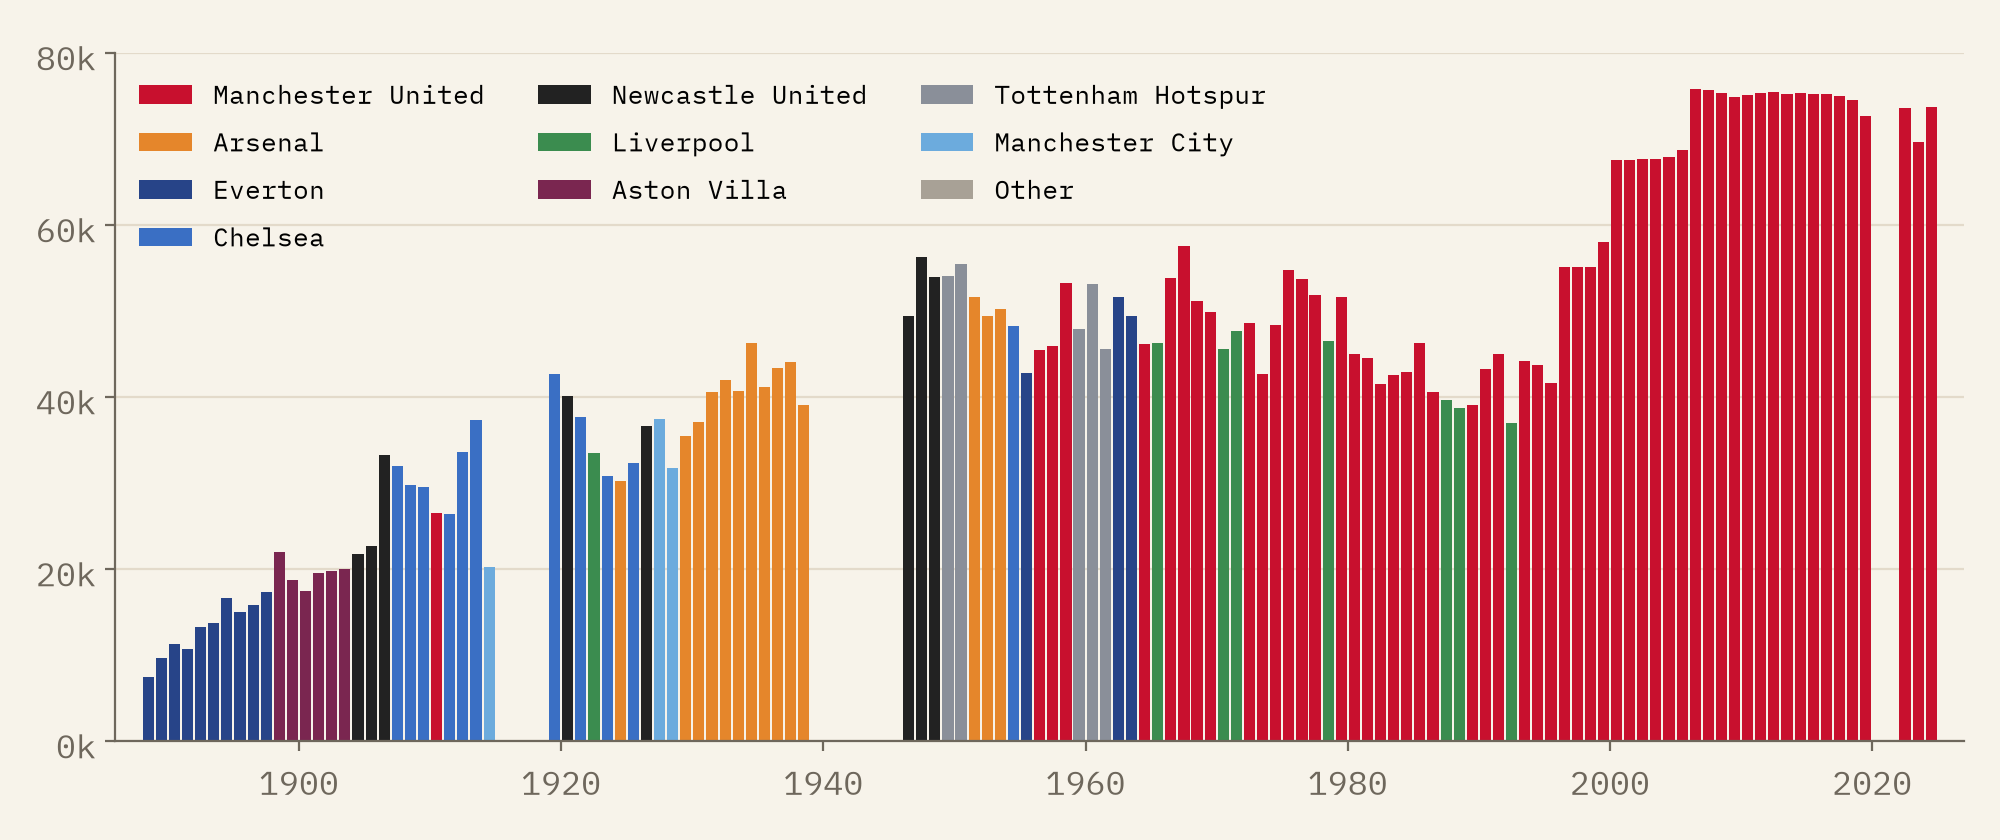
Everton had the biggest crowds in the league’s first decade, then Aston Villa, then Newcastle and Chelsea took turns before 1914. Arsenal owned the 1930s. Since 1993-94 every recorded season has belonged to Manchester United, 56 seasons in all, peaking at 75,826 in 2006-07.
39 towns that lost league football
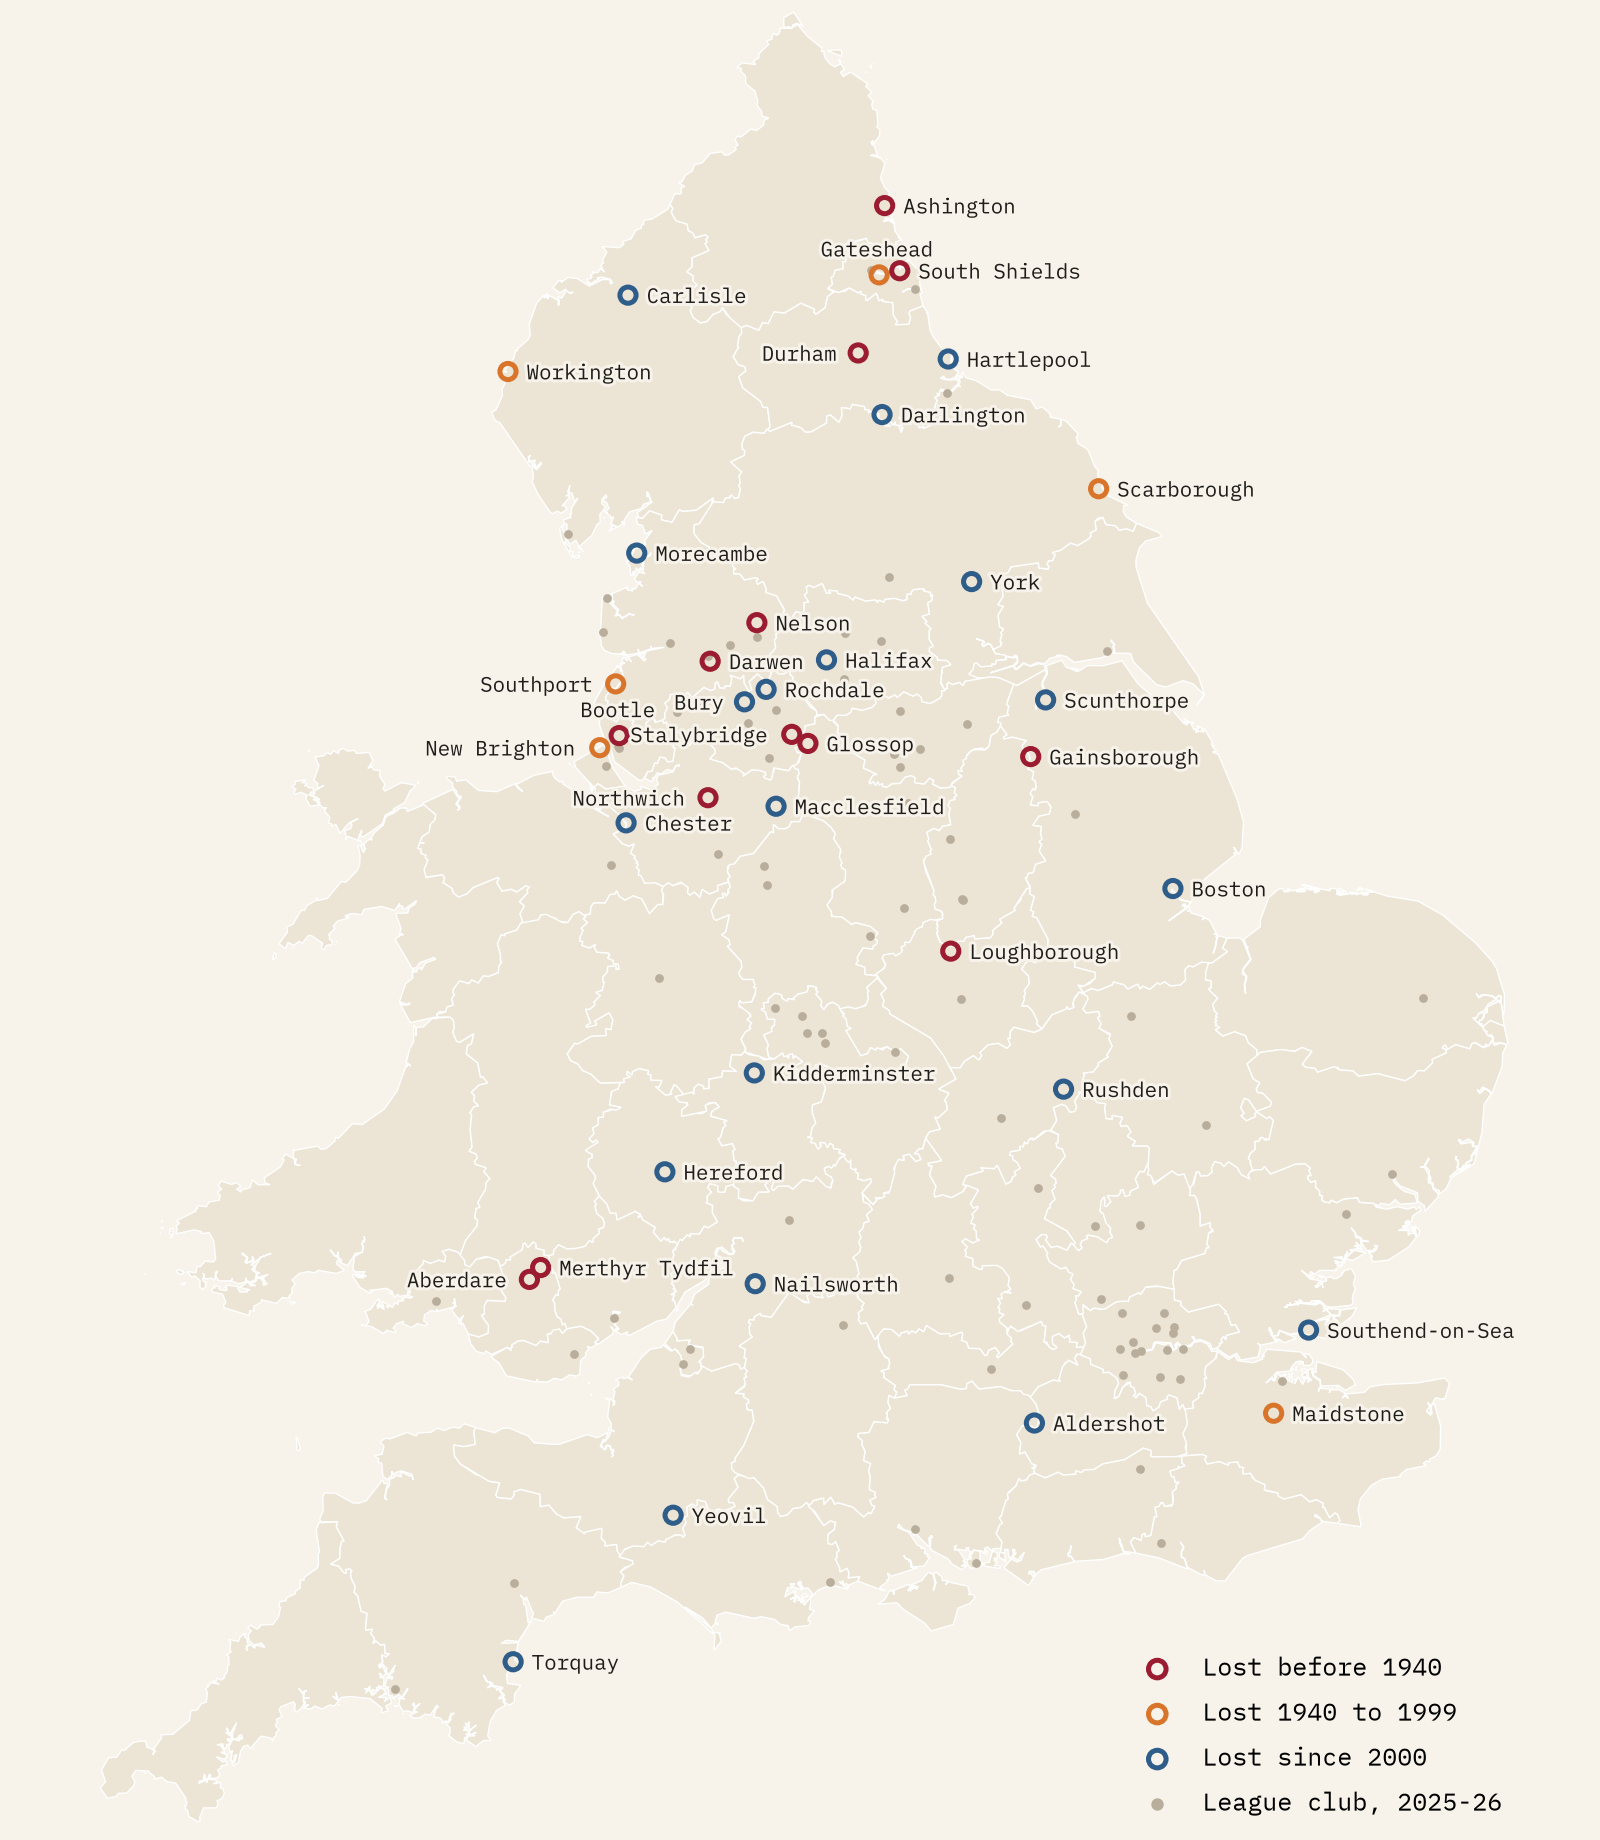
113 towns and cities have had a league club at some point. 74 have one in 2025-26. The other 39 lost it and have not got it back. Some are footnotes from the 1890s: Darwen, Bootle, Northwich, and Glossop, who spent a single season in the top flight. Some went between the wars, from mining and mill towns: Merthyr Tydfil, Aberdare, Ashington, Nelson, Durham, Stalybridge. And 20 have gone since 2000, Bury most painfully, expelled in 2019 after 114 seasons. Rochdale, Hartlepool, Southend and Scunthorpe are among the recent ones, and Carlisle and Morecambe dropped out at the end of 2024-25. It can be undone: Barrow came back in 2020 after 48 years away, and Barnet and Oldham are back in League Two for 2025-26.
When was your club big?
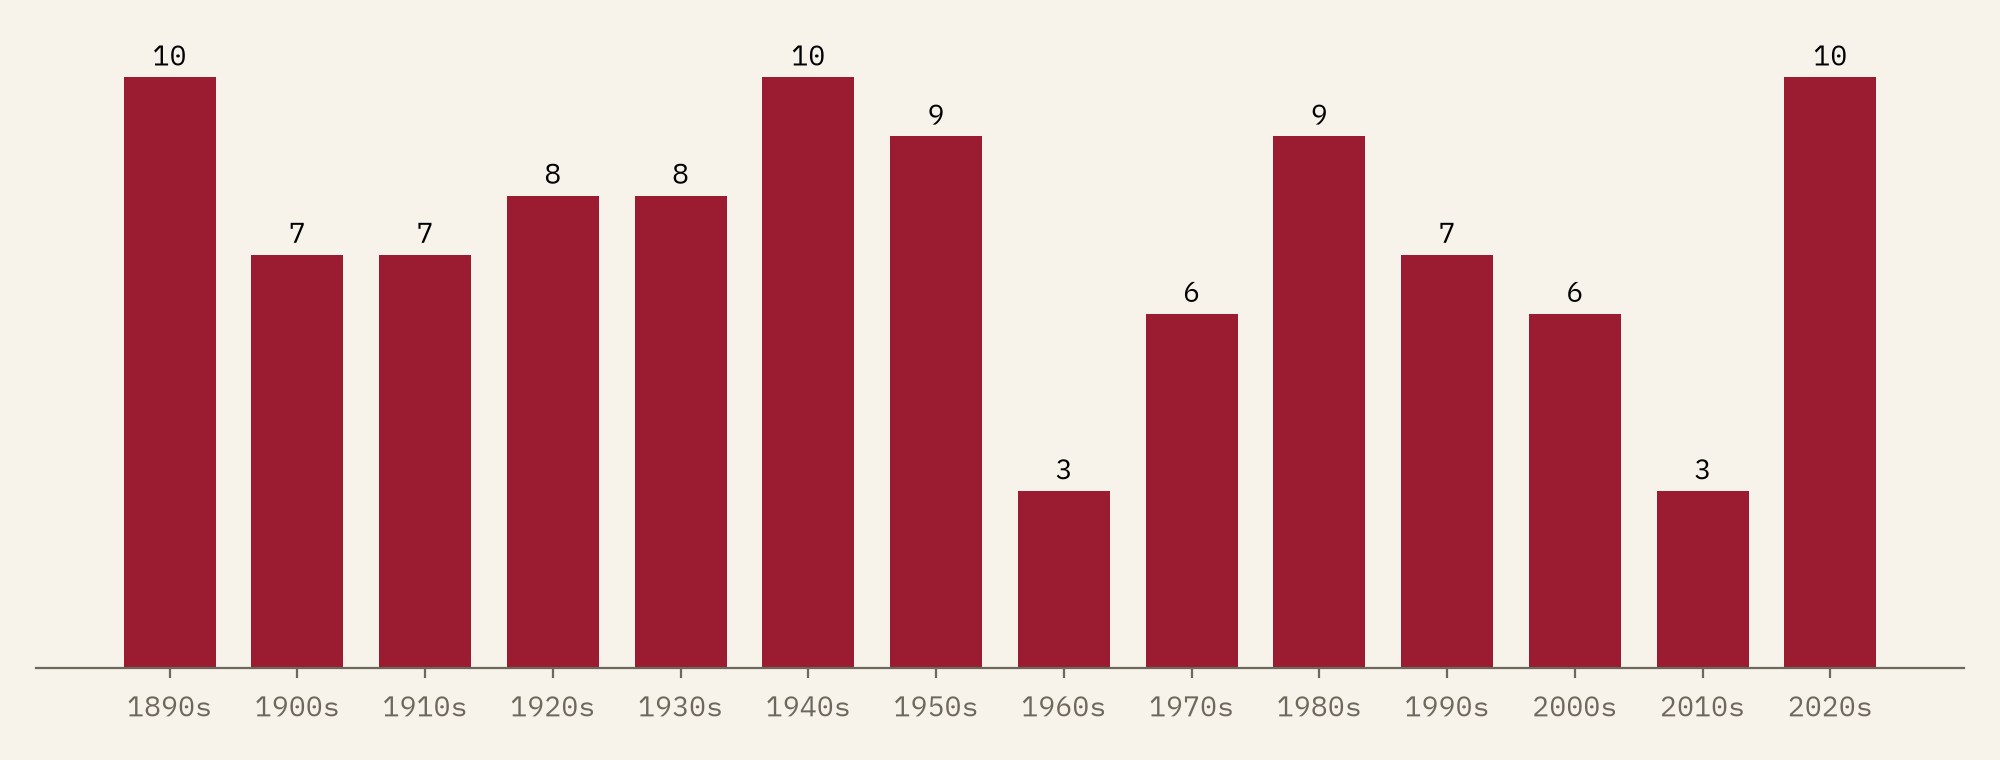
The best part of the interactive version is the search: type any club and you get its whole history as a sparkline of league position and crowd. Every club has a peak, and they are scattered across the whole history of the game. Of the 103 clubs with twenty or more league seasons, 10 had their best decade in the 1890s, and 10 are living through it now. Preston’s was the very first season. Huddersfield’s was the 1920s, Portsmouth’s the late 1940s, Brighton’s and Bournemouth’s the last ten years.
How I did this
Tables come from every league match in engsoccerdata (2022-23 from openfootball): two points for a win until 1981, three after; goal average until 1976, then goal difference; points deductions applied; expunged records removed. I checked the rebuilt champions against the record. Crowds are average home league gates from englishfootballleaguetables.co.uk, matched to clubs season by season through all the old names (Small Heath, Newton Heath, The Wednesday and the rest). Season totals are average times home league games. Each club sits at its present or last ground, so early Arsenal is in Islington rather than Plumstead. Crowds before the mid 1920s are estimates, and there are none for 2020-21 (behind closed doors) or 2021-22 (missing from my copy of the source). The paper has the details.
Notes and sources
- Match results: James P. Curley, engsoccerdata (R package; code GPL-3), and openfootball/england for 2022-23 (public domain).
- Average league gates: englishfootballleaguetables.co.uk. Only per-club, per-season averages derived from its tables are republished, with credit.
- Boundaries: Office for National Statistics, Open Government Licence v3.0. Town names: OS Open Names, Open Government Licence v3.0.
- I wrote the text, with drafting and editing assistance from Claude (Anthropic), which also helped prepare the analysis code. I reviewed and checked all text and results.

