
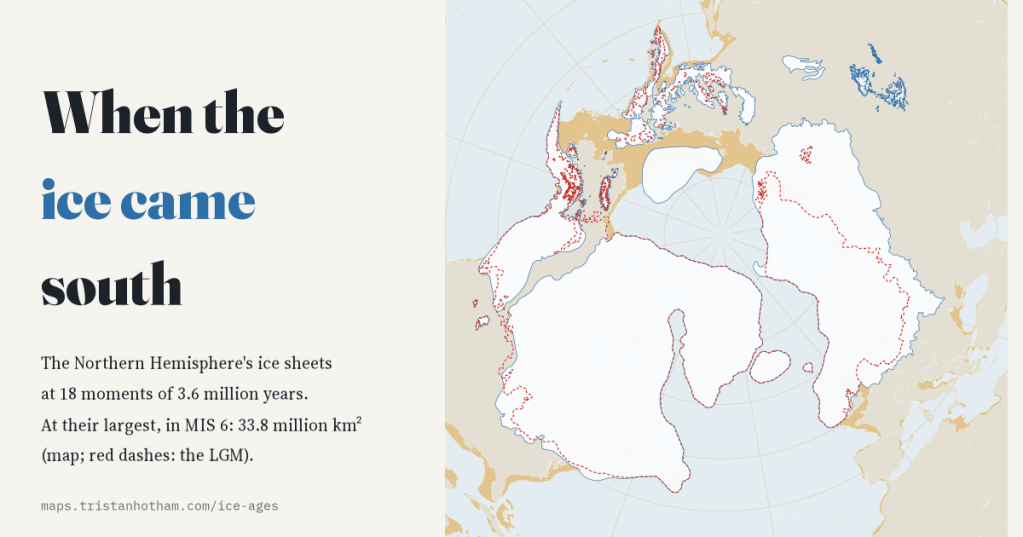
I took the reconstructions of the Northern Hemisphere’s ice sheets published by Batchelor and colleagues in 2019, 18 moments from 3.6 million years ago to the Last Glacial Maximum, and asked what lies under them today: which countries, which cities, and how much land the lowered sea gave up.
Most of us carry one picture of the ice age: a white cap over Canada and Scandinavia, about 20,000 years ago. That was the Last Glacial Maximum, the LGM, and it was real. But it was one advance among many. In 2019 Christine Batchelor and eight colleagues pulled together the published evidence for where the Northern Hemisphere’s ice sheets reached and drew a best estimate of the ice for each of 18 time slices, plus a minimum and a maximum for every slice before the LGM. Their outlines are open data. I measured them, laid them over today’s map and over the sea floor, and built a map where you can step through the slices and click any spot to see which of them reached it.
The last ice age was not the biggest
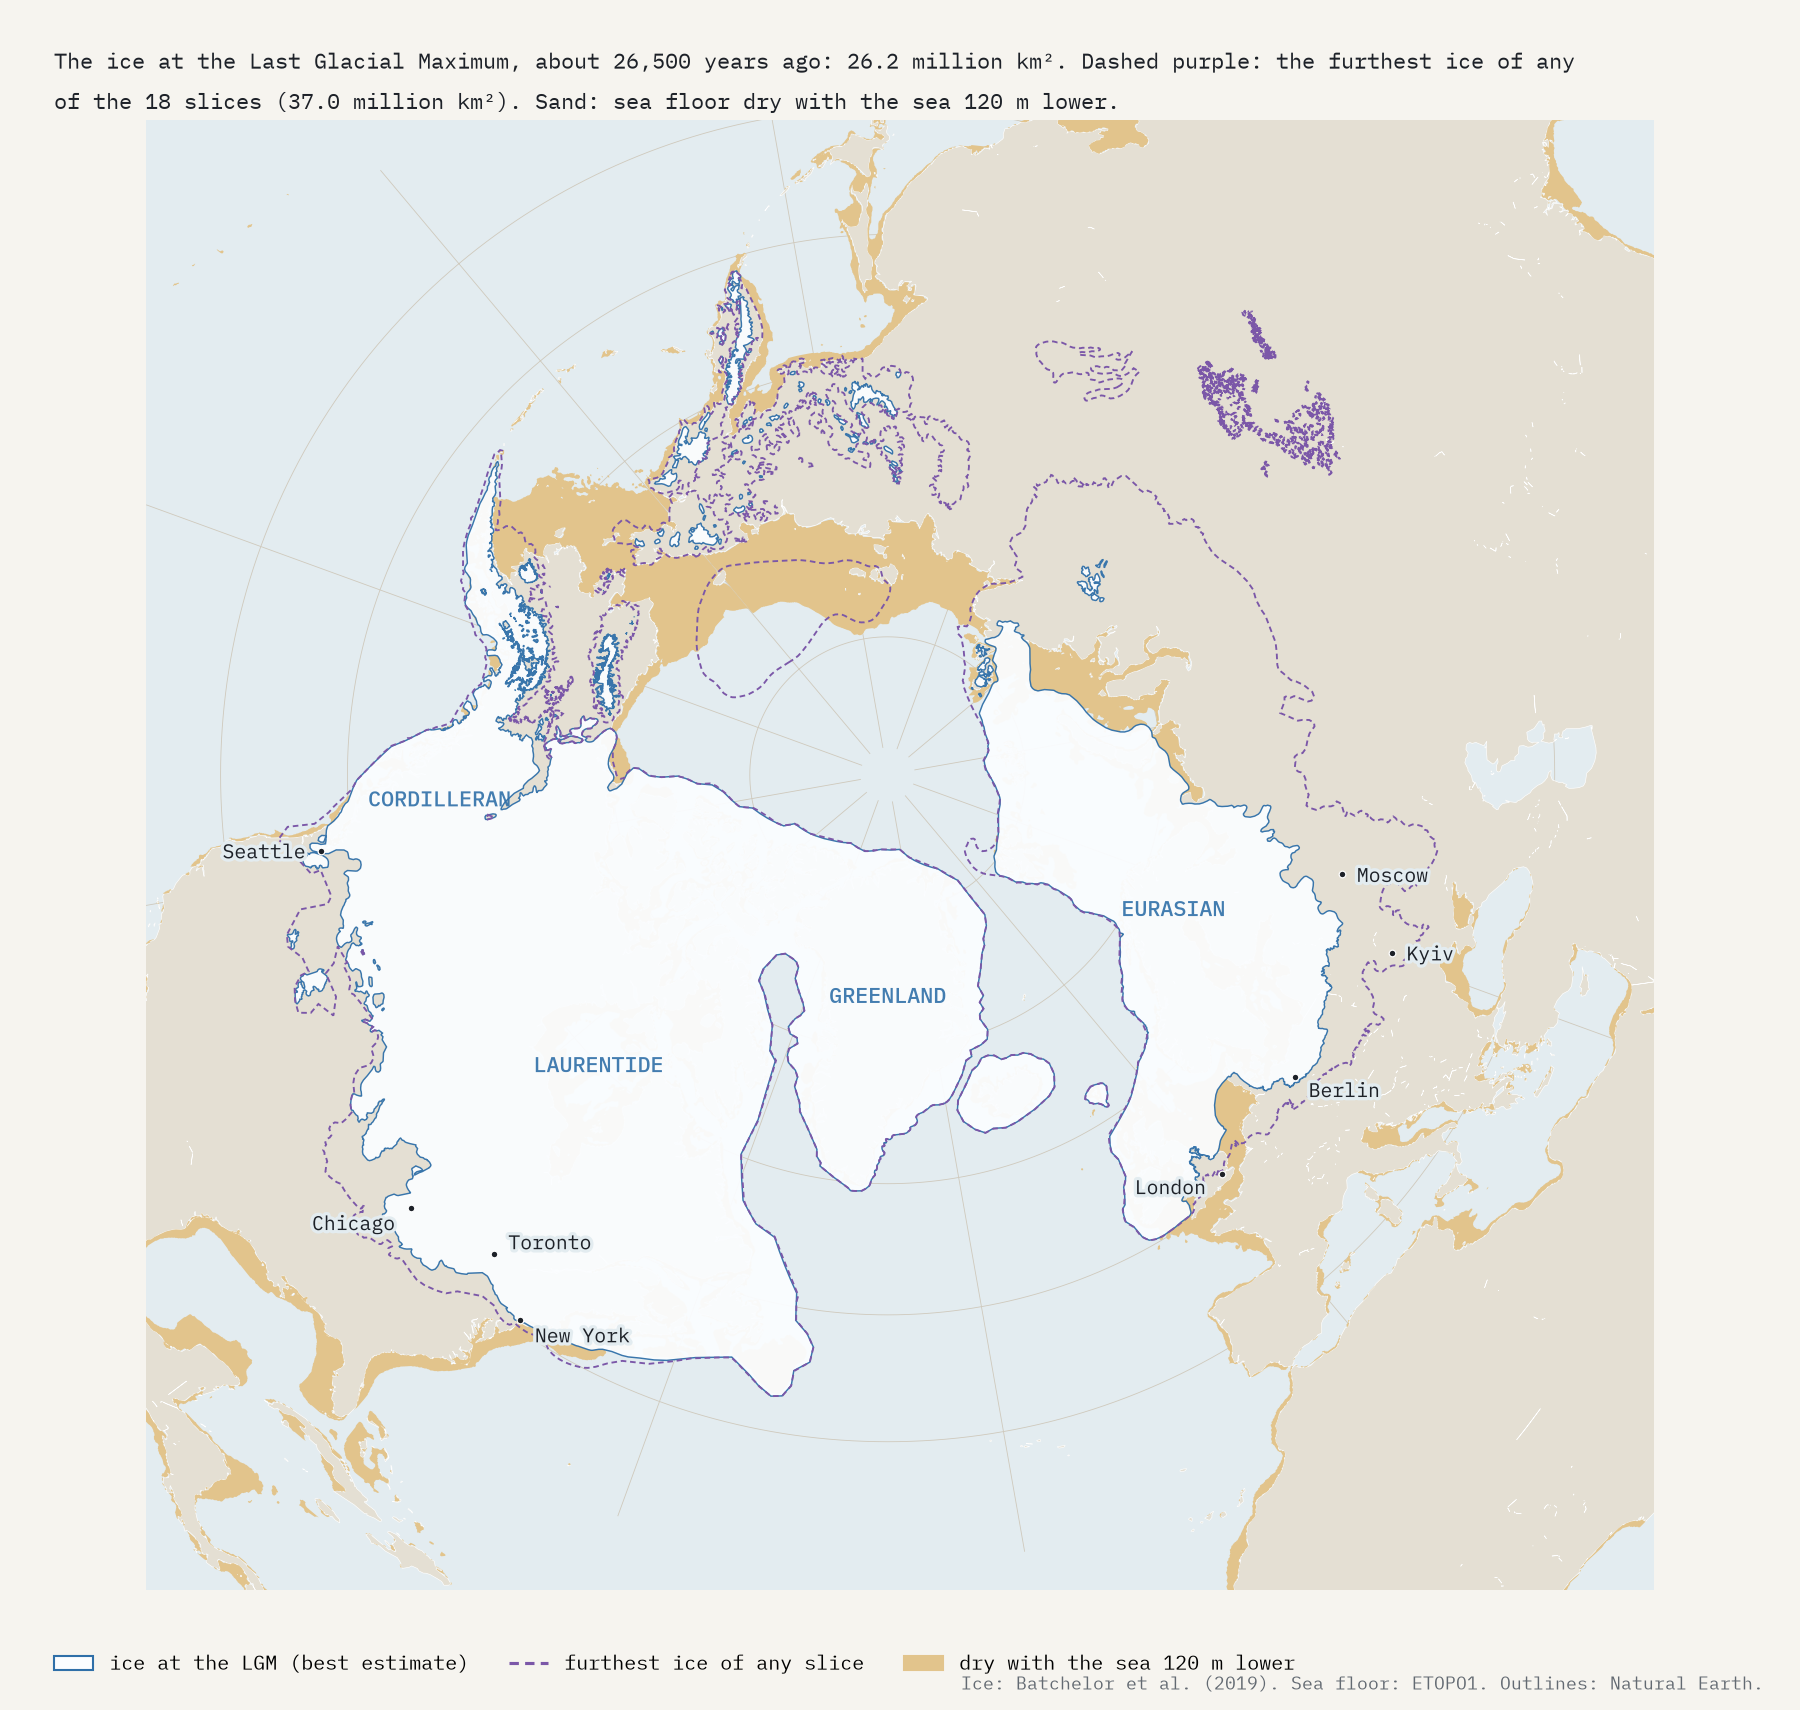
At the LGM the ice covered 26.2 million km², about a third of it on what is now sea floor. That is only the 4th largest of the 18 slices. The biggest was MIS 6, 132,000 to 190,000 years ago: 33.8 million km², 29% more. MIS 12 and MIS 16, roughly 450,000 and 650,000 years ago, came close. The authors’ own area table, which comes with the outlines, puts the seven largest slices in the same order.
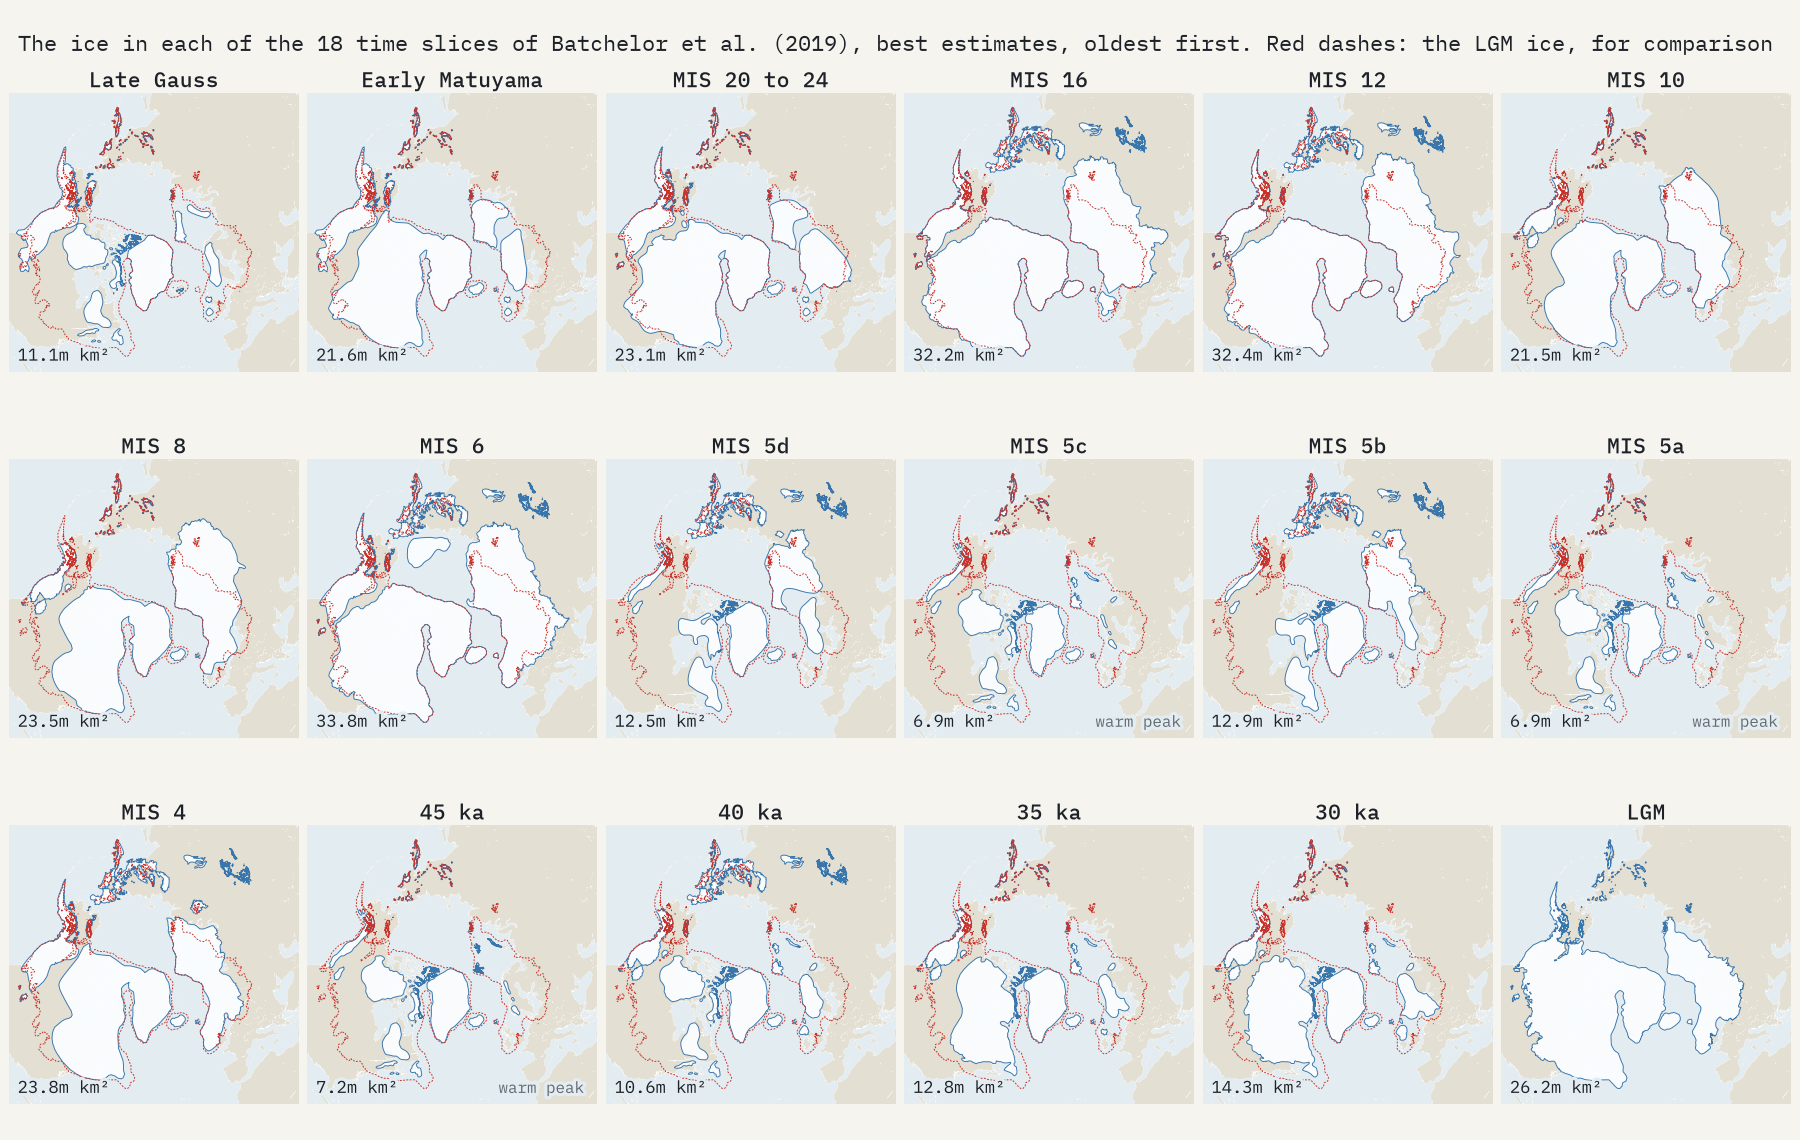
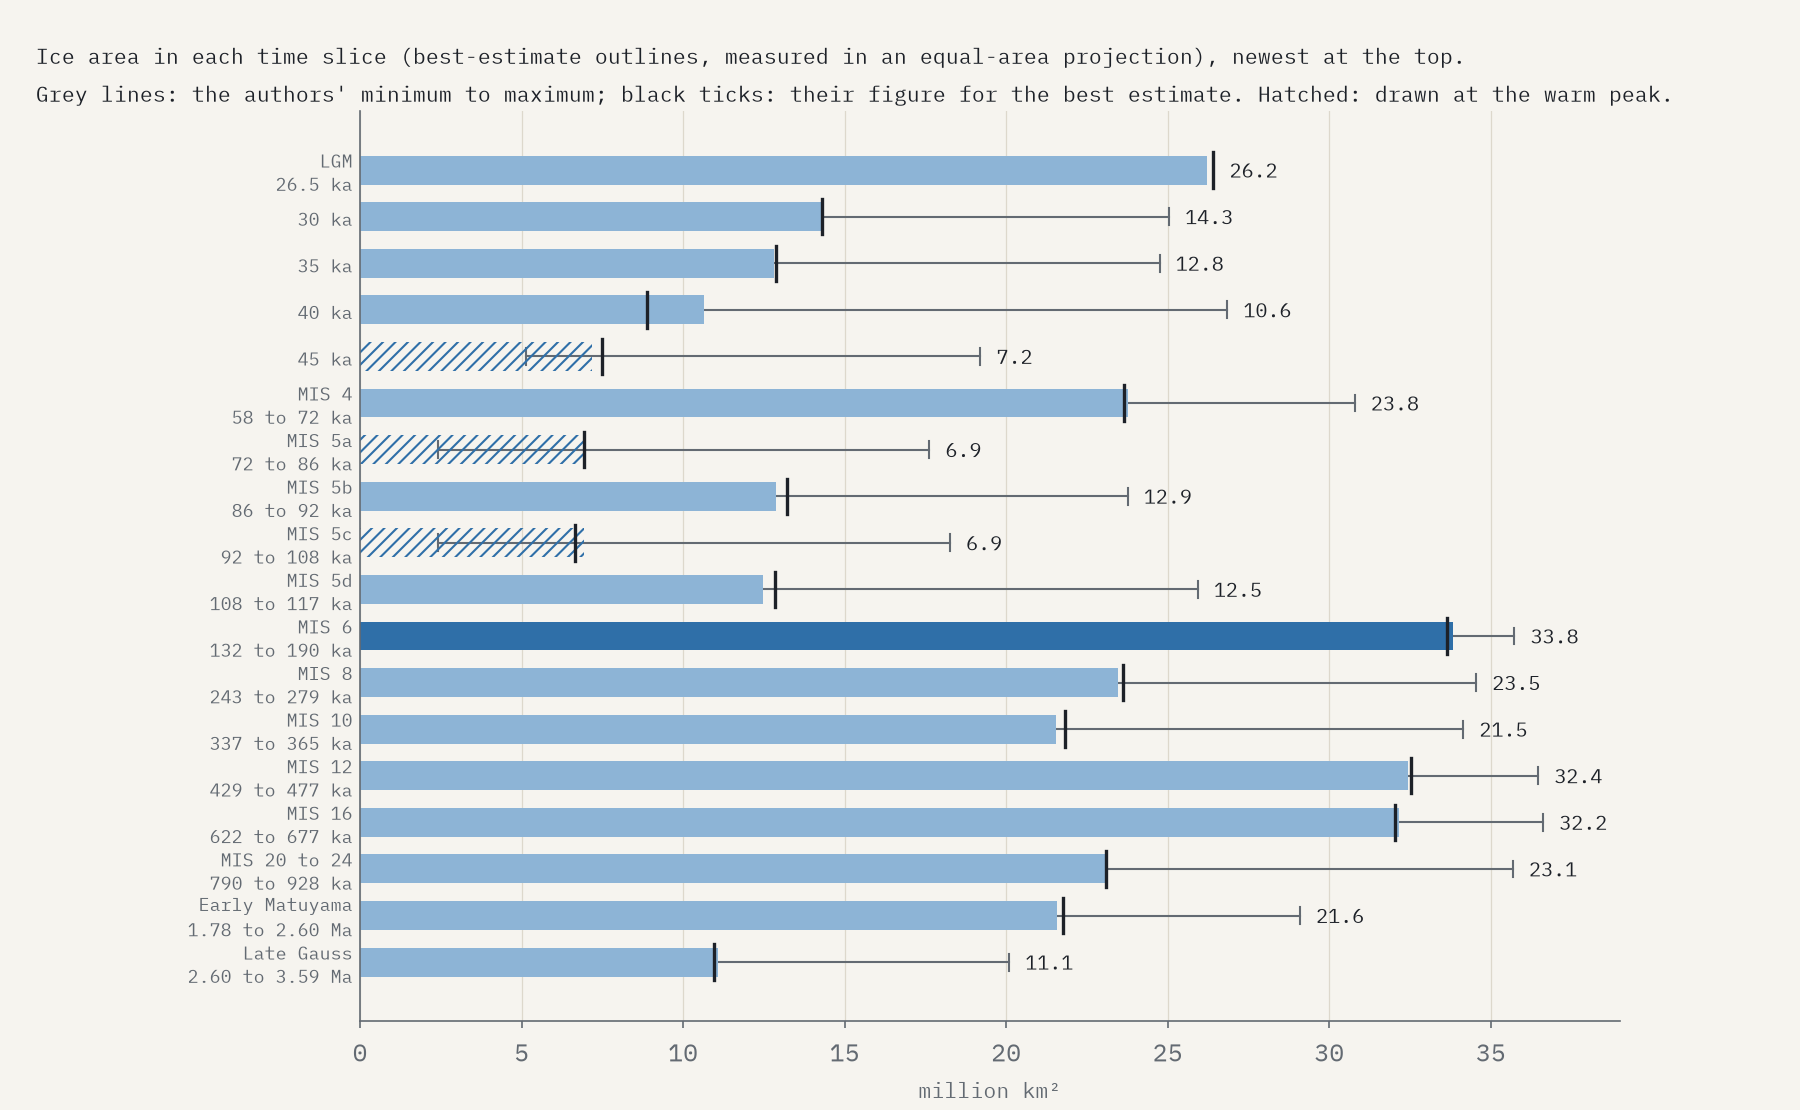
Those older outlines are less certain. The authors warn that their reconstructions are generalised, that some, MIS 8 and MIS 10 above all, show the amount of ice better than where its edge lay, and that none should be used for local detail. Three slices, 45 ka, MIS 5a and MIS 5c, are drawn at their warmest moment, not their largest, and they are the three smallest. Taken together, the ice reached 37.0 million km² at one time or another.
How far south
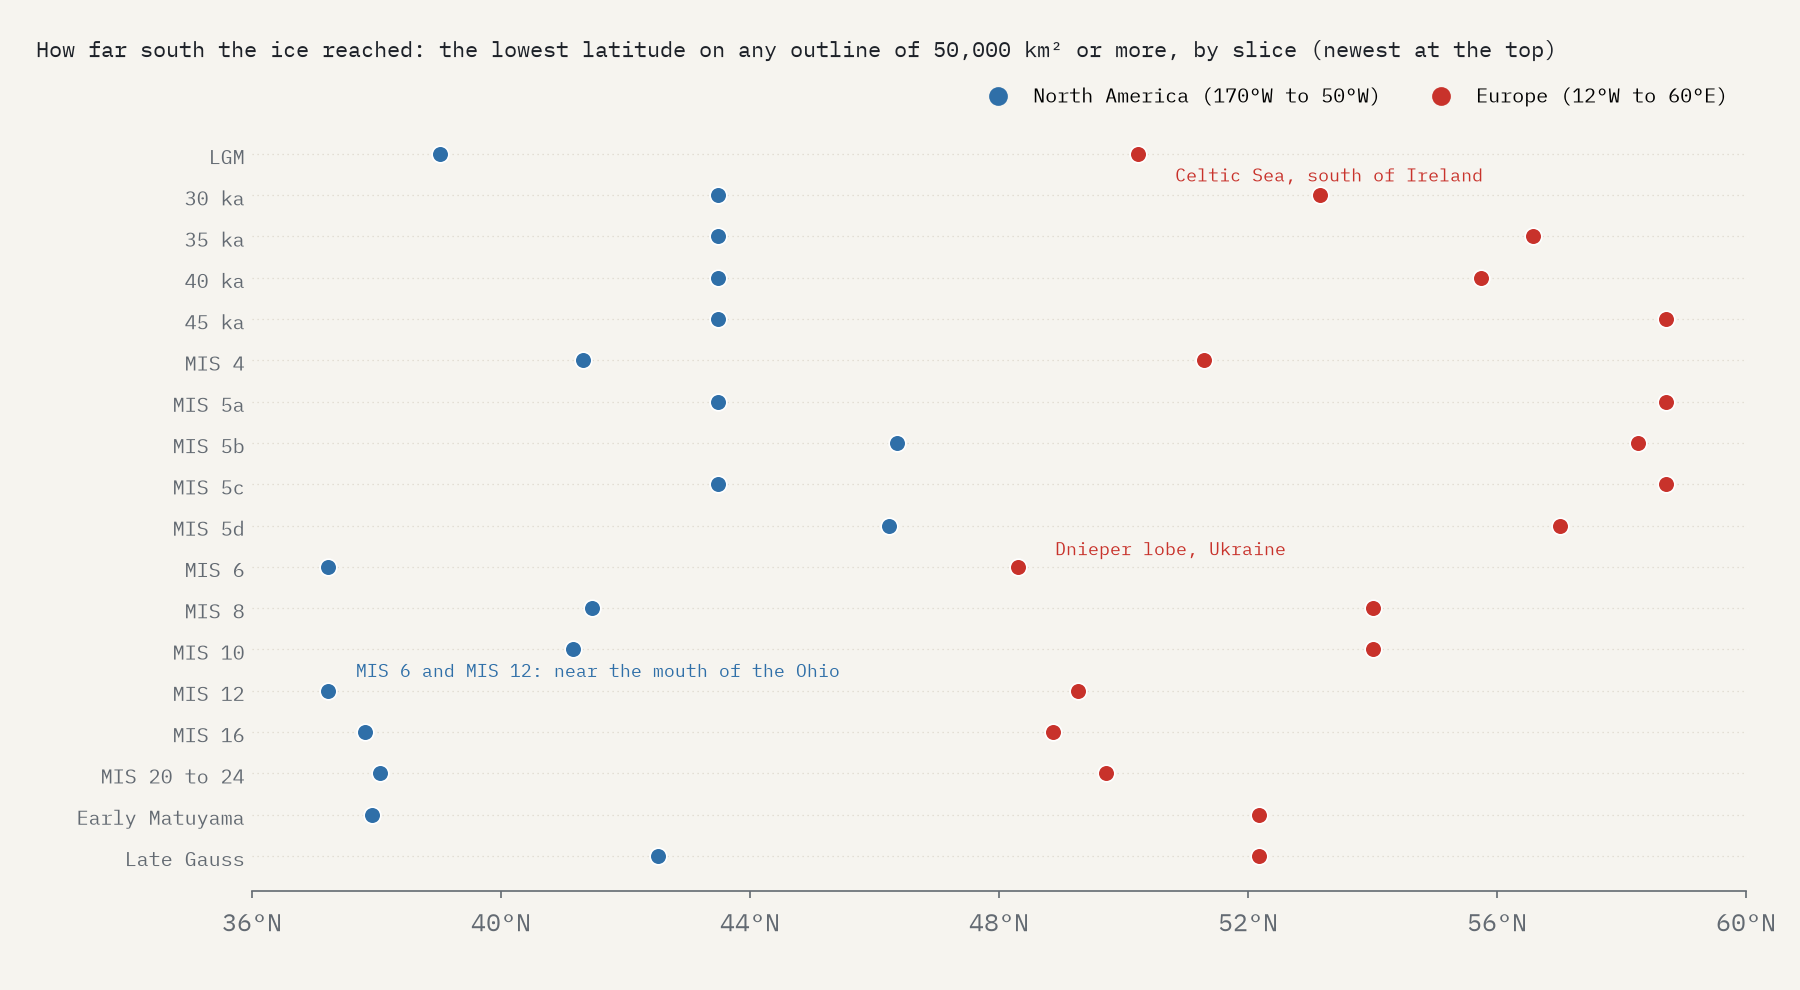
In North America the LGM ice reached 39.0°N in Indiana. In MIS 6 and MIS 12 it got to 37.2°N in southern Illinois, about 26 km from where the Ohio joins the Mississippi. In Europe the older ice went much further than the LGM’s: in MIS 6 a lobe pushed down the Dnieper valley in Ukraine to 48.3°N, and in MIS 16 the ice reached the Don basin of southern Russia.
What lay beneath
The LGM ice covered 97% of Canada, all of Ireland, Sweden and Finland, 61% of the United Kingdom and 21% of the United States. Of the 7,342 cities and towns in Natural Earth, 709 stand on ground it covered, and their population figures add up to about 141 million people. The largest is New York, 13 km inside the edge, which fits the usual account that the ice reached Manhattan. Chicago was 112 km inside, Berlin 42 km.
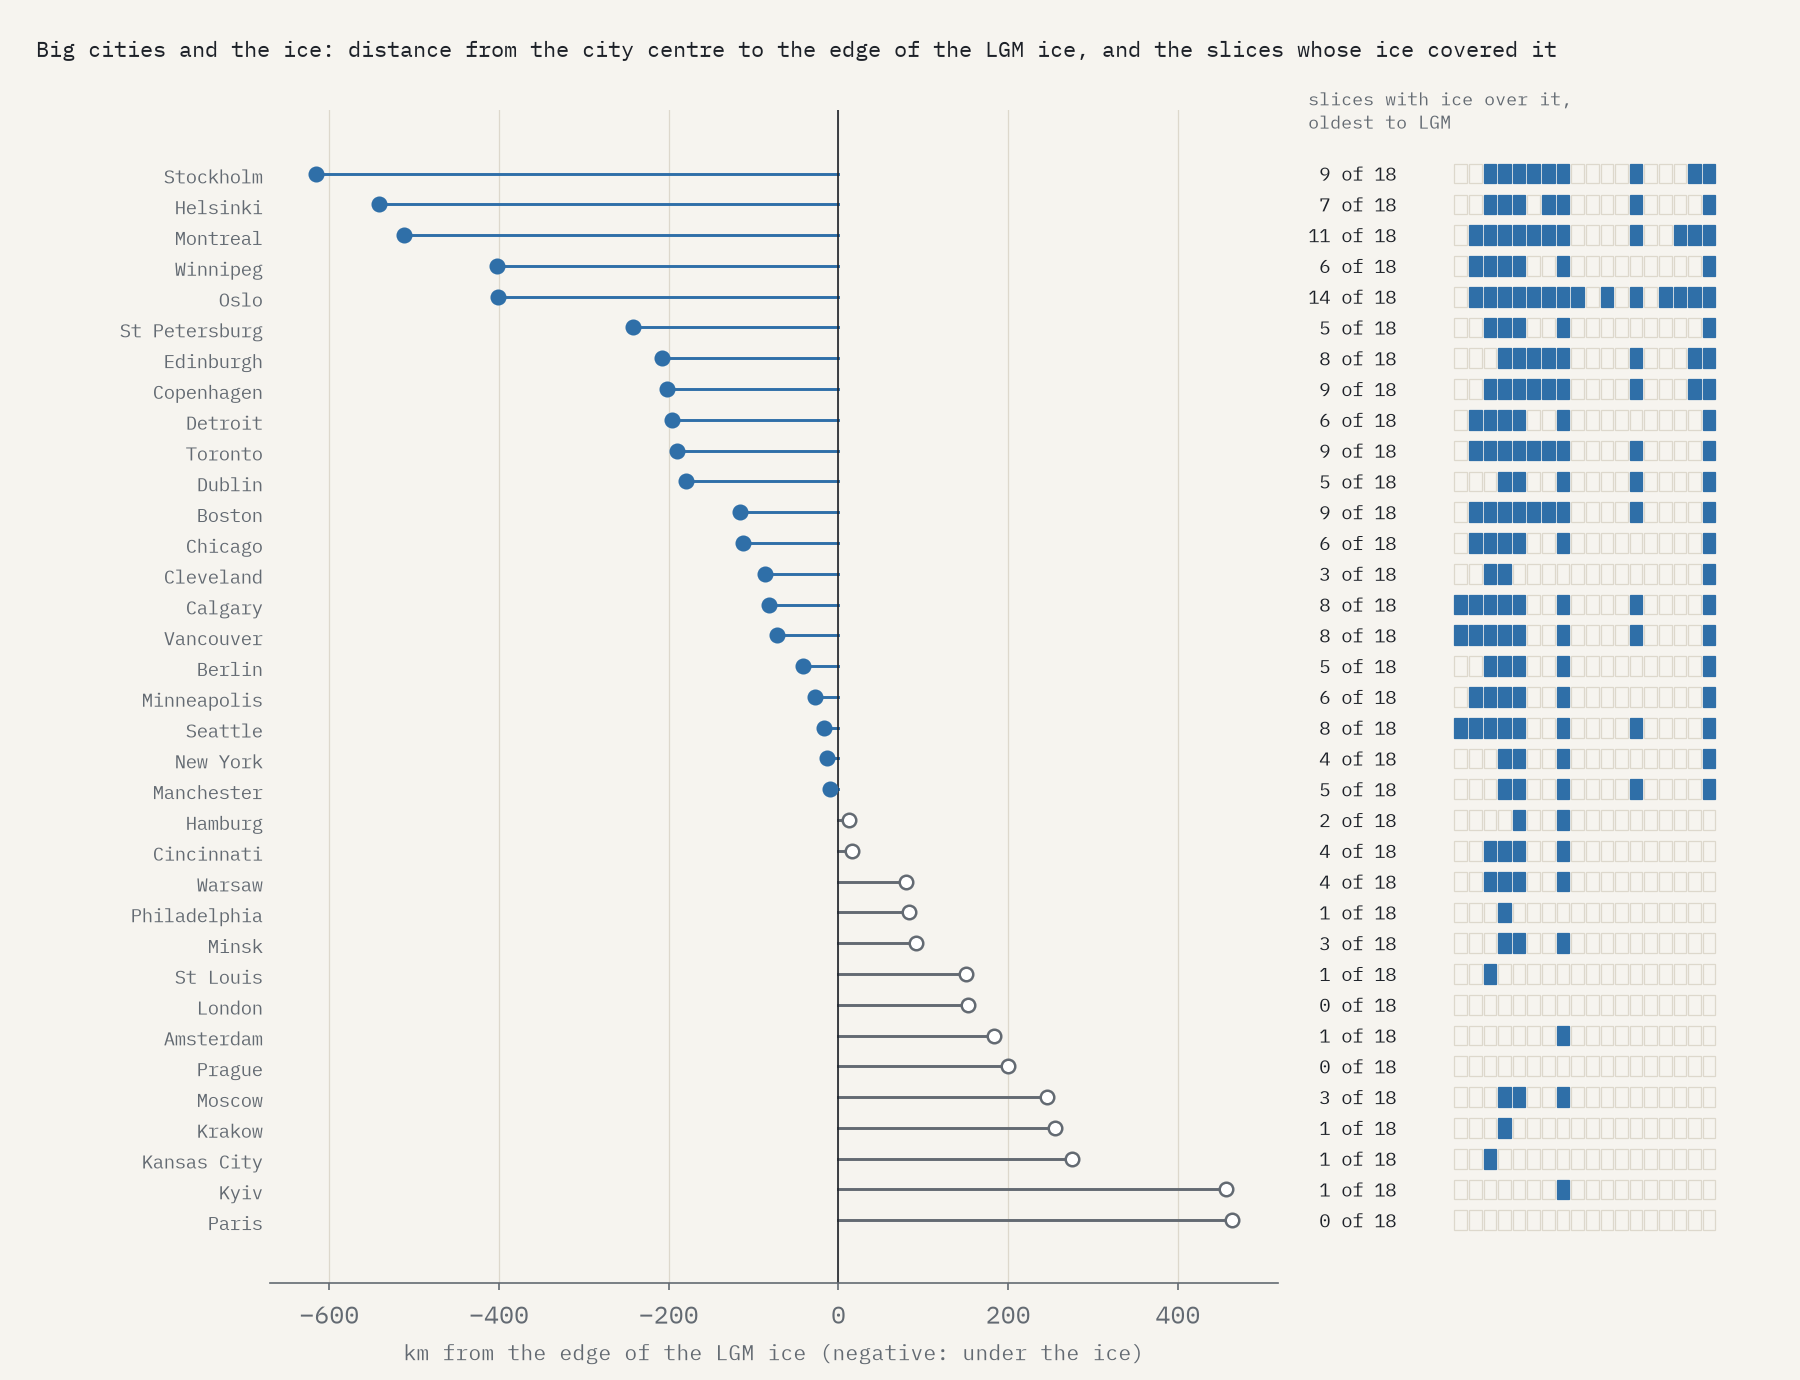
London was never under the ice in any of these outlines, but in MIS 12, the Anglian glaciation, the edge came within 16 km of the centre. Moscow lay 246 km beyond the LGM ice and under three older ones. Counting every slice, the ice reached 95% of Poland, 60% of the Netherlands and 47% of Germany.
Land from the sea
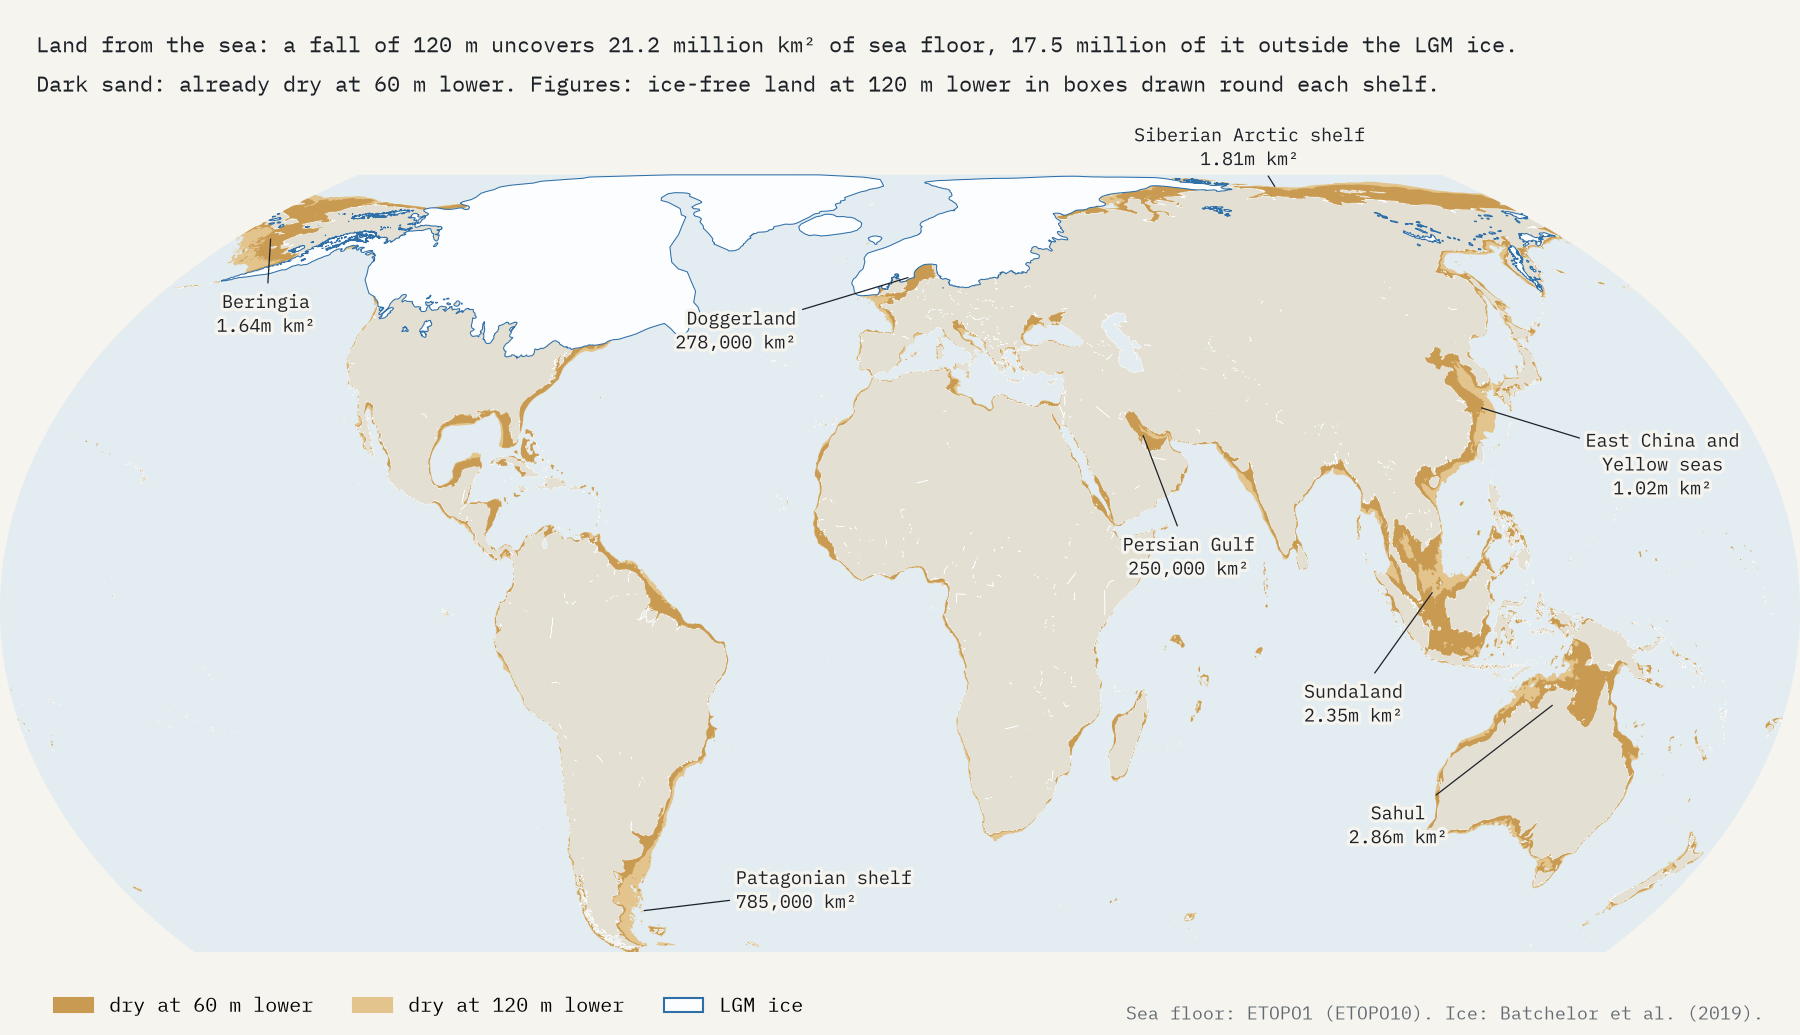
The water in all that ice came out of the oceans, which stood around 120 m lower at the LGM. On NOAA’s ETOPO1 sea floor, a fall of 120 m uncovers 21.2 million km², 14.2% more land than the world has now; 17.5 million km² of it lies outside the LGM ice. The biggest new lands were in the tropics: the Sahul shelf joining New Guinea and Tasmania to Australia (2.9 million km² in my box) and Sundaland joining Sumatra, Java and Borneo to Asia (2.3 million). Beringia joined Asia to America, and Doggerland joined Britain to the continent. On my grid every one of those bridges is already there with the sea only 60 m down.
How I did this
The outlines are the best estimates of Batchelor et al. (2019), from their repository on the Open Science Framework. I put them all in the same polar equal-area projection, repaired invalid shapes, dropped present-day glaciers south of the equator that two files carry, and measured each slice there. Countries and places are Natural Earth’s; distances to the ice edge are true distances on the globe. Sea-floor depths come from ETOPO10, a coarse version of NOAA’s ETOPO1, and the lower sea levels are a simple fill on today’s sea floor, as the authors draw their ice on today’s land. The paper has every step and caveat.
Notes and sources
- Batchelor, C.L., Margold, M., Krapp, M., Murton, D.K., Dalton, A.S., Gibbard, P.L., Stokes, C.R., Murton, J.B. and Manica, A. (2019) The configuration of Northern Hemisphere ice sheets through the Quaternary, Nature Communications 10, 3713. Data: osf.io/7jen3, CC BY 4.0.
- Amante, C. and Eakins, B.W. (2009) ETOPO1 1 Arc-Minute Global Relief Model, NOAA, doi:10.7289/V5C8276M (public domain), via ETOPO10. Relief on the map: AWS Terrain Tiles.
- Natural Earth countries, land and populated places (public domain). Context from Wikipedia (CC BY-SA 4.0).
- I wrote the text, with drafting and editing assistance from Claude (Anthropic), which also helped prepare the analysis code. I reviewed and checked all text and results.

