
Tag: Ice ages and sea level
-
When the ice came south: the ice ages mapped, and what lies under them today
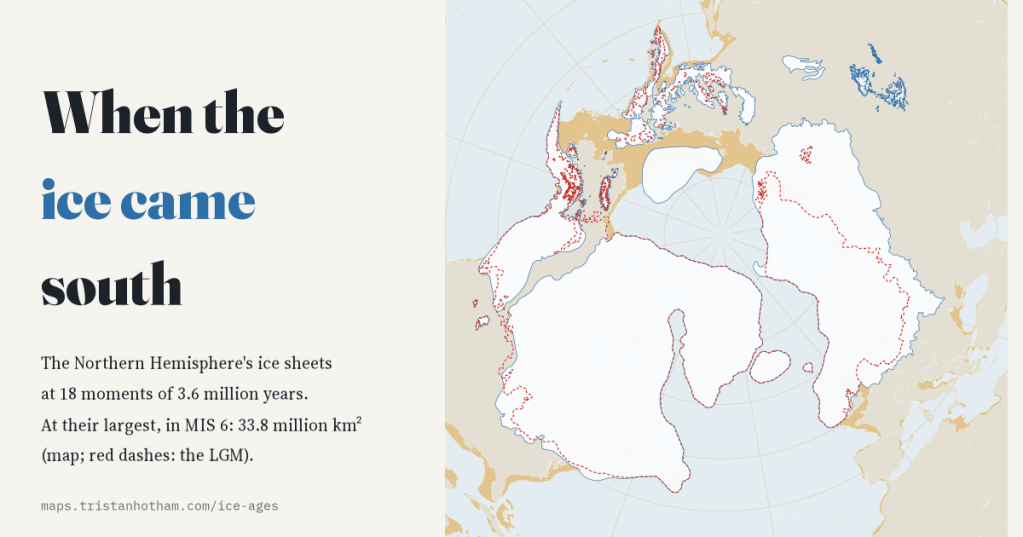
I mapped the Northern Hemisphere’s ice sheets at 18 moments of the last 3.6 million years. The last ice age was only the 4th largest; 709 of today’s cities and towns, New York among them, stand on ground its ice covered.
-
Drowned and rising: Britain and the world at every sea level
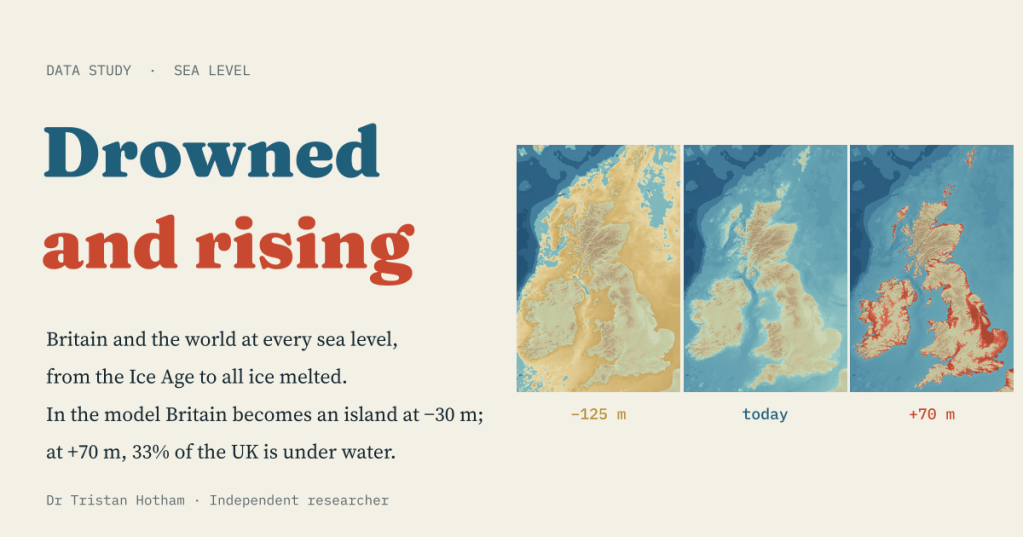
A bathtub model of every sea level from the Ice Age to an ice-free world. In the model Britain becomes an island at −30 m; at +70 m, 33% of the UK is under water.

