
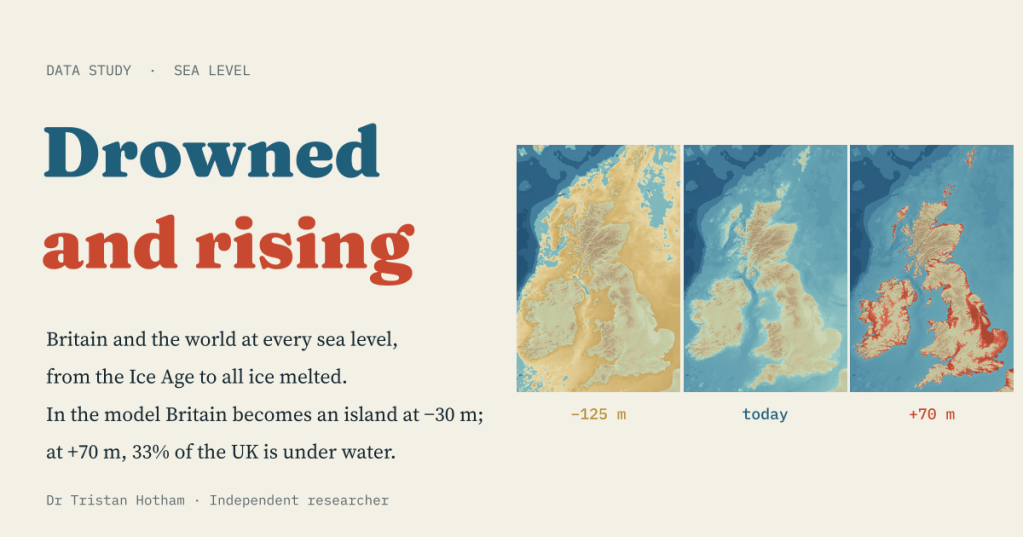
Twenty thousand years ago you could walk from Yorkshire to Denmark. If all the ice on Earth melted, the sea would cover a third of the UK. I built a simple model of every sea level in between, and a map you can drag from the Ice Age to an ice-free world.
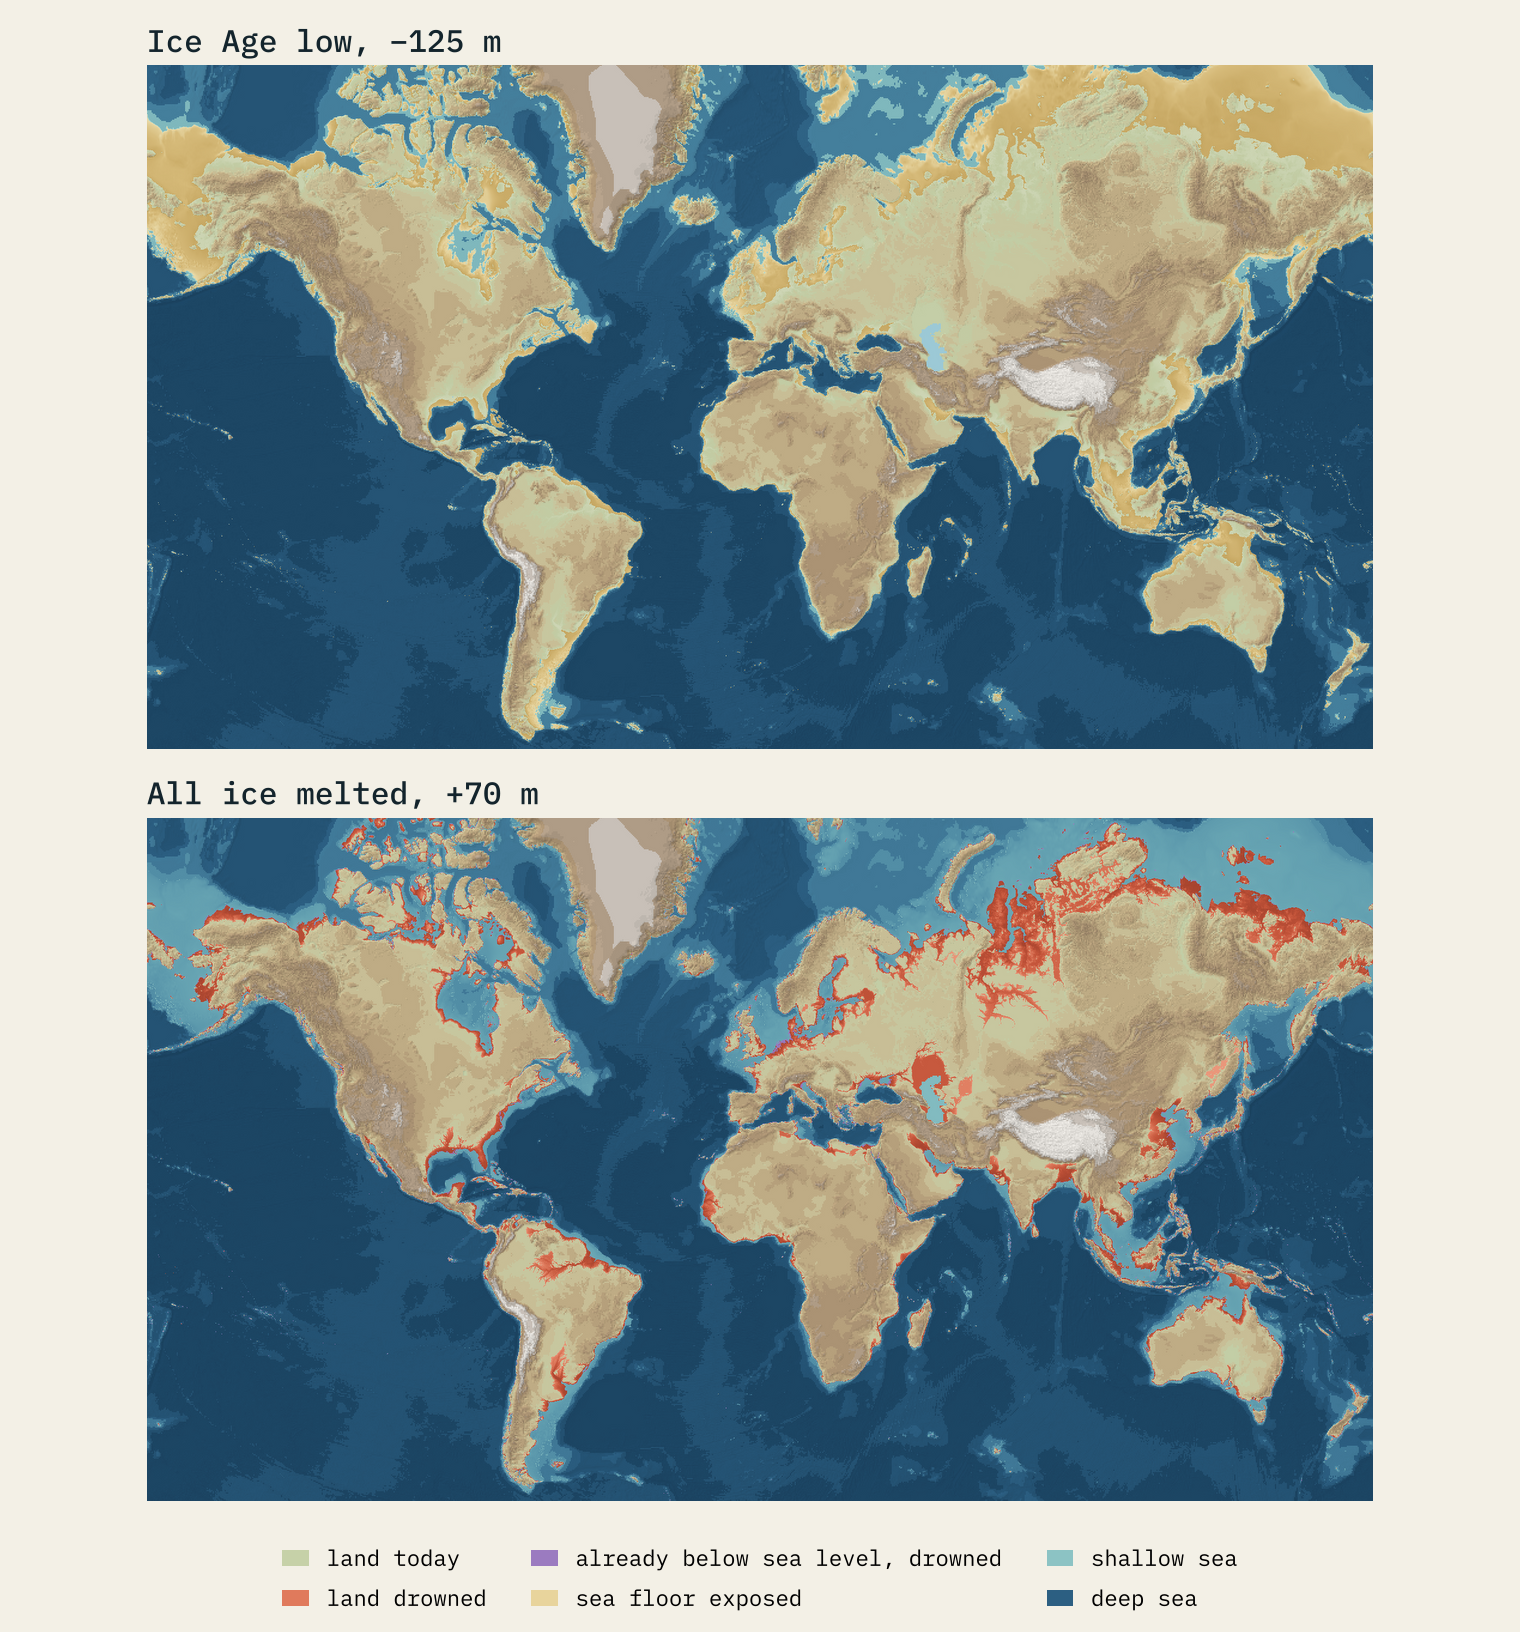
We think of the coast as the fixed edge of the country. It is not. At the height of the last Ice Age, between about 26,000 and 20,000 years ago, so much water was locked up in ice sheets that the sea stood about 120 m lower than it does today. The southern North Sea was dry: a land of hills, rivers and marshes that archaeologists call Doggerland. Britain was not an island but the north-western corner of Europe.
The ice that is left still holds a great deal of water: about 7.4 m of global sea level in Greenland and about 58 m in Antarctica. I wanted a way to see that whole range at once, from the Ice Age low to a world with no ice, for Britain and for the world. So I built a bathtub.
A bathtub for the planet
A bathtub model is the simplest flood model there is. Take a map of the height of the land and the depth of the sea, choose a sea level, and flood every place that is lower than that level and that the ocean can reach. I used the open AWS Terrain Tiles, which combine many elevation and sea-floor datasets, at three sizes of grid: about 10 km for the world, 700 m around Britain and the North Sea, and 190 m for the UK numbers. Today’s coast comes from Natural Earth, so at zero the map looks like the world we know.
The interactive page has a slider from −130 m to +70 m and a play button. As the sea moves, the map redraws and the numbers under it change: land gained and lost, Doggerland’s area, UK towns and people below the line, and cities around the world.
When Britain was joined to Europe
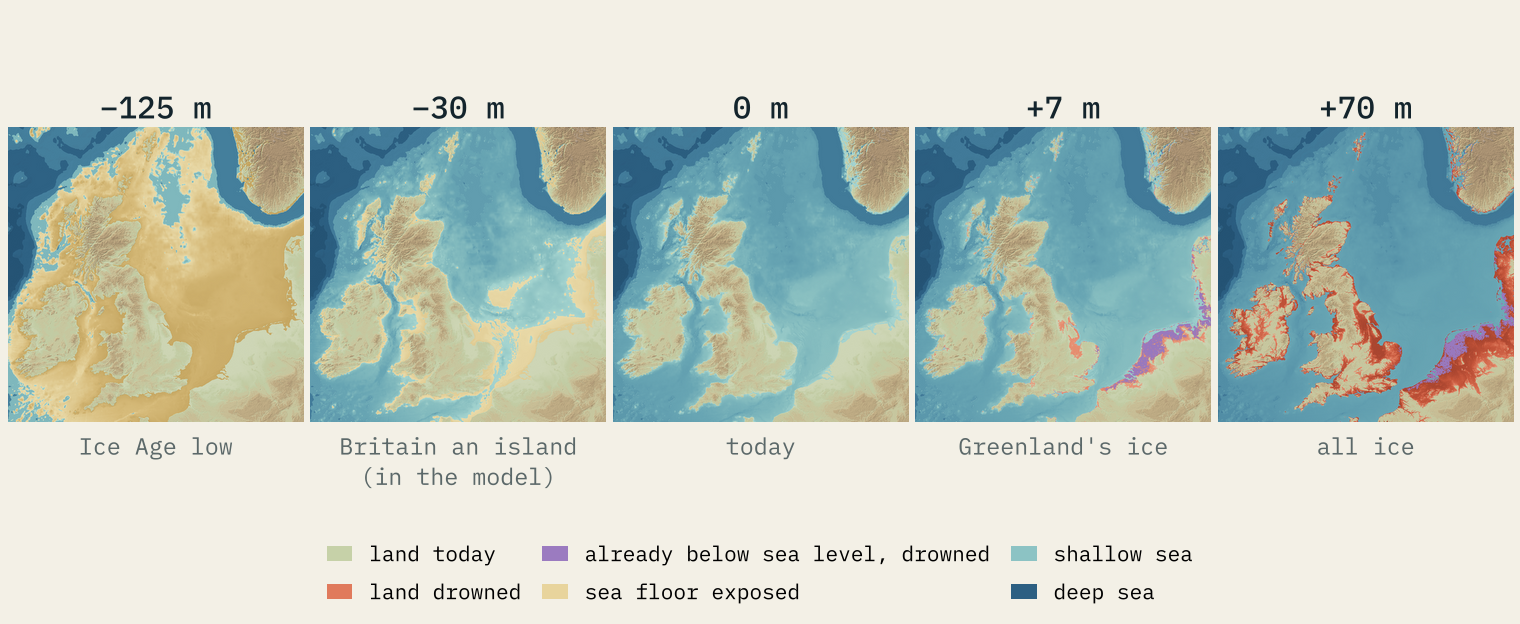
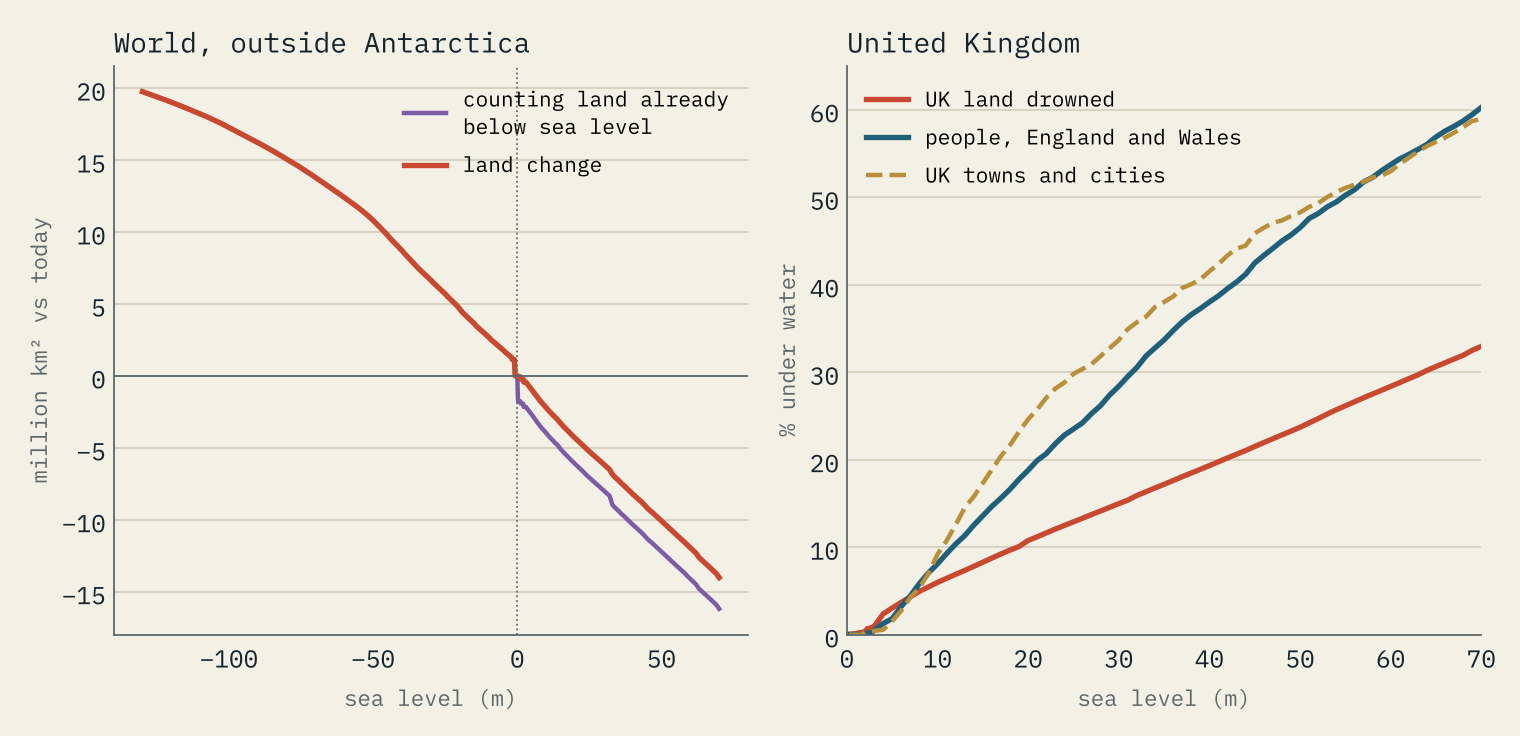
Drop the sea to the Ice Age low and the whole southern North Sea comes up. In a box from 51.0° to 57.5° N and 3.0° W to 9.0° E, the model has 340,713 km² of dry land, almost all of it. Worldwide, outside Antarctica, it exposes 19.4 million km² of sea floor, an area 14% the size of today’s land: the plain between Siberia and Alaska, the shelf that joined Borneo and Java to Asia, the land between New Guinea and Australia.
As the sea rises, Doggerland shrinks slowly at first and then fast. At −40 m there are still 180,256 km² of it; at −20 m only 42,627 km², mostly thin strips along today’s coasts. The Dogger Bank, the high ground in the middle, goes under in the model at −22 m.
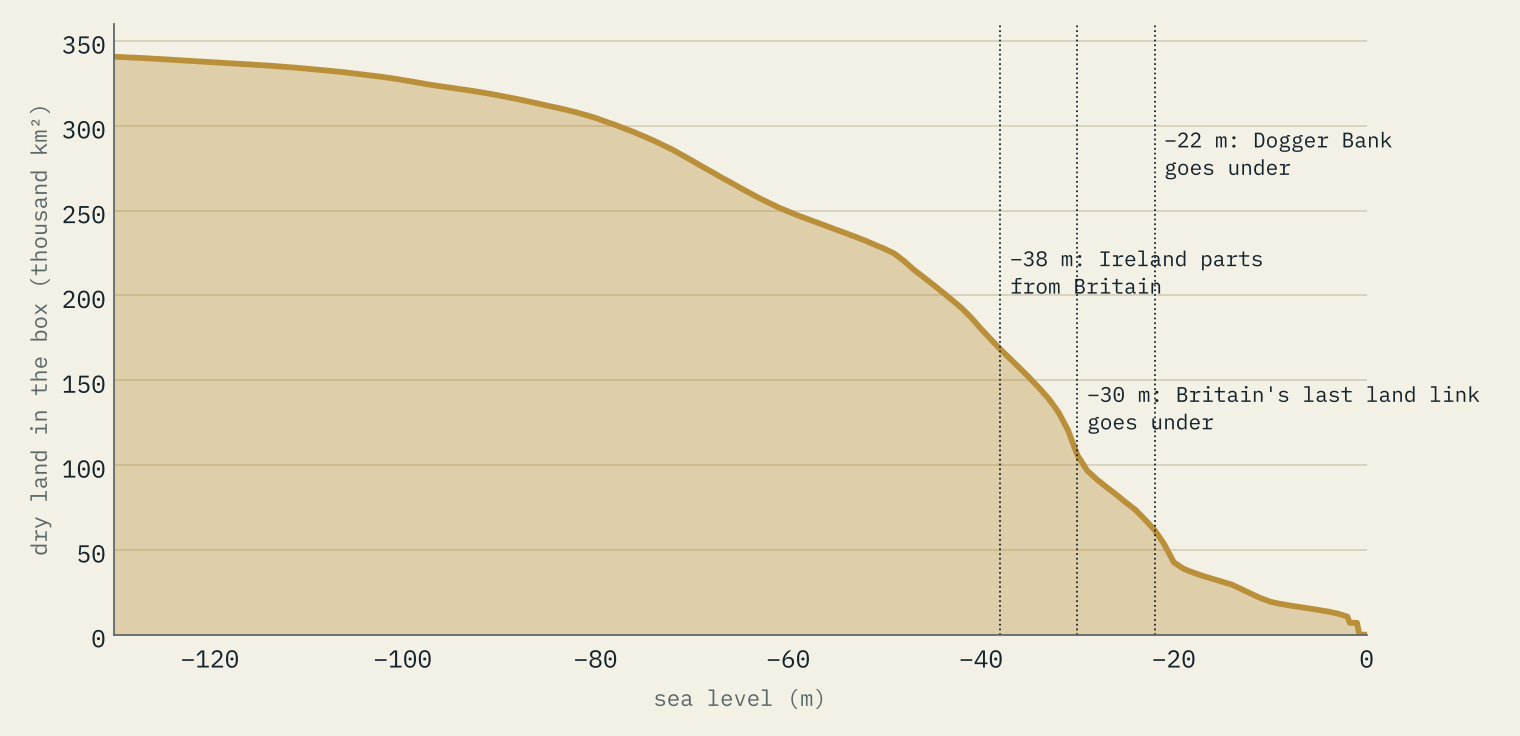
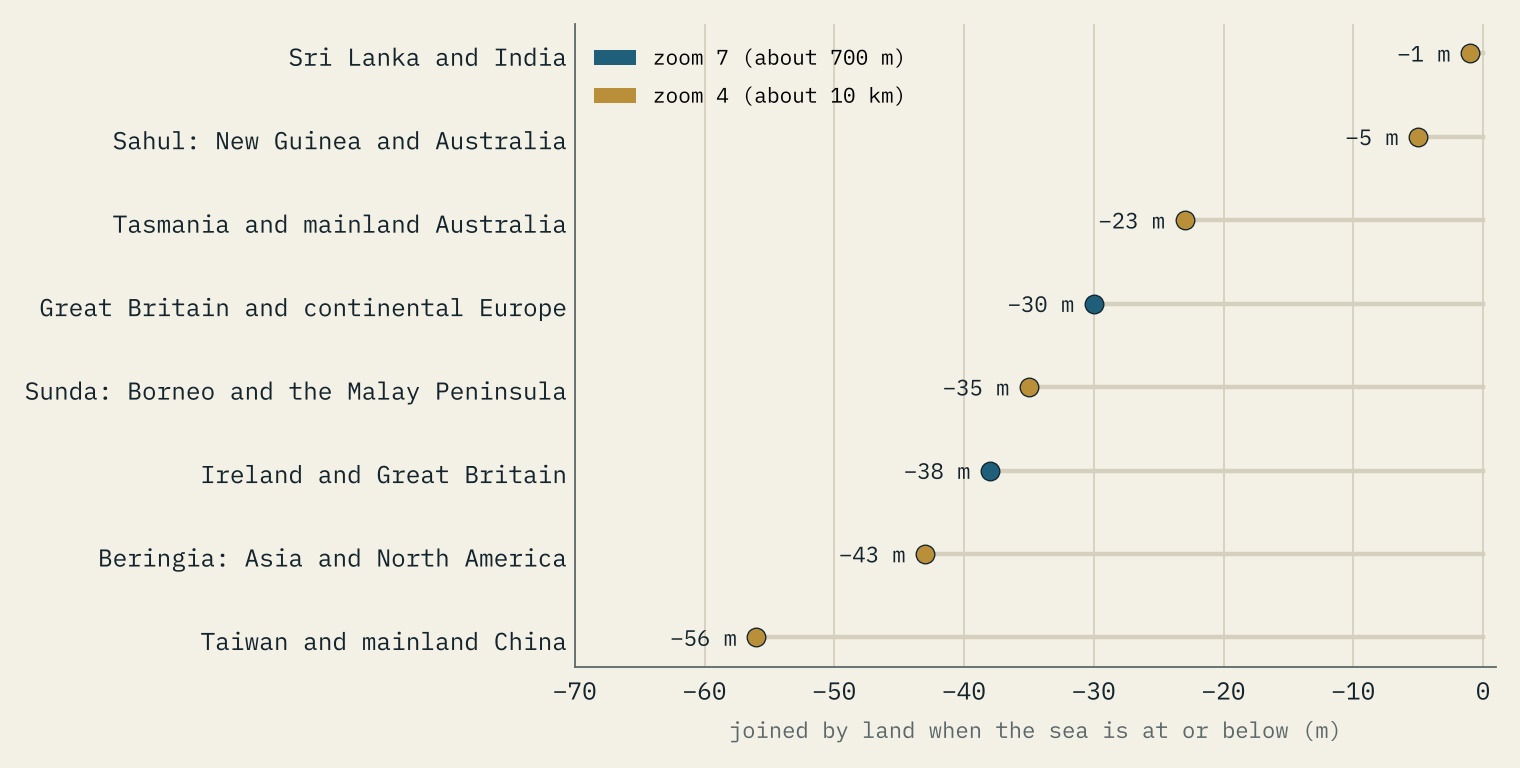
The moment that matters for British history is when the last land link to the continent goes under. Using today’s seabed, the model puts it at −30 m. Ireland parts from Britain earlier, at −38 m. Wikipedia’s article on Doggerland says it was inundated between 10,000 and 7,000 years ago, and that the tsunami from the Storegga landslide off Norway, about 8,200 years ago, may have flooded much of what was left.
In the model, Britain becomes an island when the sea reaches −30 m.
I am careful not to turn that into a date. The seabed of 8,000 years ago was not today’s: tides and rivers have moved sediment, coasts have worn away, and the land itself has moved since the ice melted, rising in the north of Britain and sinking in the south. What the model gets right is the order of things: Ireland first, then Britain, with most of the southern North Sea already under water by the time the last link went. The same sum for other famous land bridges, on the coarse world grid, gives Beringia between Asia and Alaska at −43 m and Borneo to the Malay Peninsula at −35 m.
The first metre
Now raise the sea. The Intergovernmental Panel on Climate Change’s latest assessment gives a likely rise by 2100, compared with 1995 to 2014, of 0.28 to 0.55 m if emissions are cut very fast and 0.63 to 1.01 m if they stay very high. Over the next 2,000 years it expects about 2 to 3 m if warming stays at 1.5 °C, 2 to 6 m at 2 °C, and 19 to 22 m with 5 °C of warming.
Here a bathtub is at its weakest, and I would rather say so. At +1 m my UK grid drowns 275 km² of land above today’s sea level, plus 574 km² that is already below it and kept dry by banks, pumps and sea walls, which the model does not have. No OS town centre is under water until between +1.5 and +2 m. The real risk from the next metre comes from storms, tides and failing defences, which a still bathtub cannot show. For your own street, use the official flood maps, not this.
Greenland, Antarctica and everything
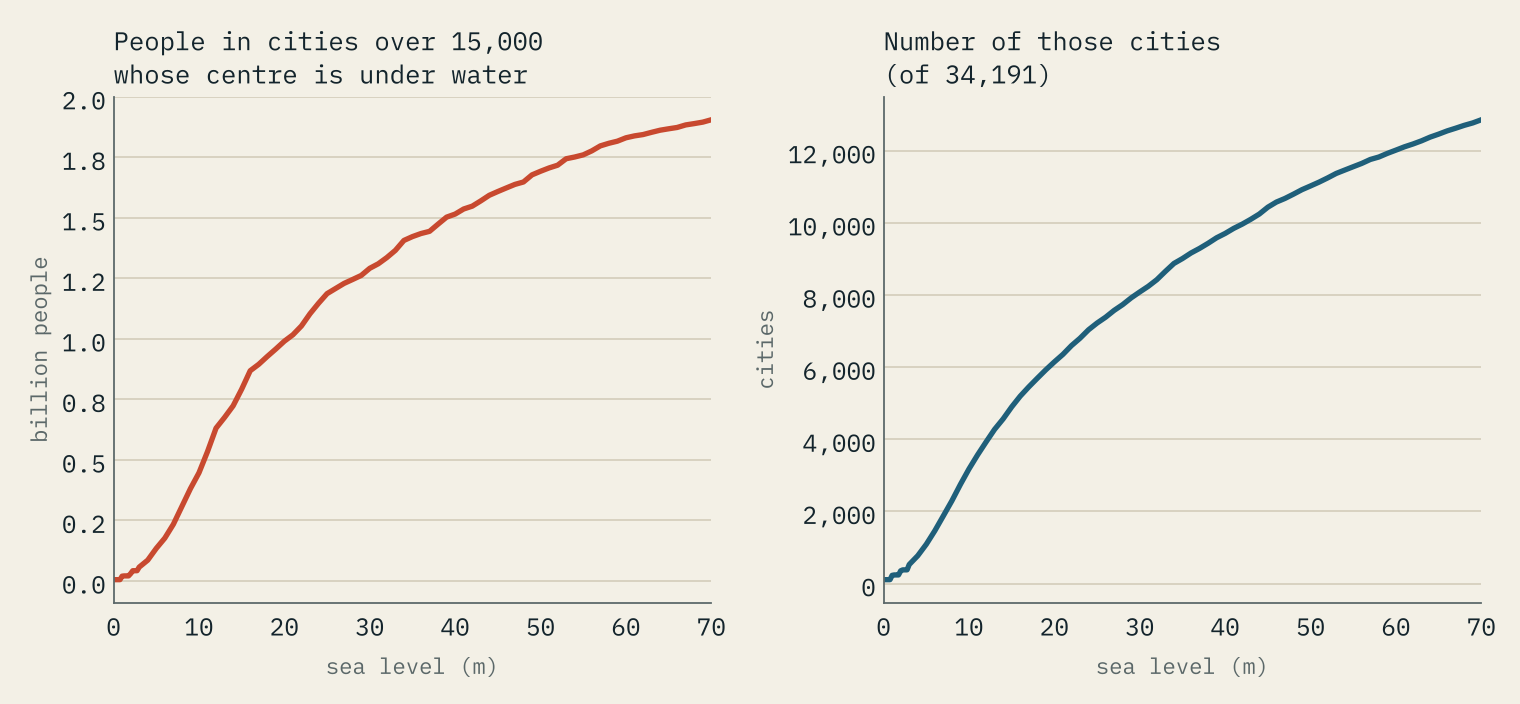
Higher up, the shapes are clear. At +7 m, about what the Greenland ice sheet holds, the model drowns 10,509 km² of the UK (4.3% of its land) and reaches the centre points of 61 towns and cities, from Great Yarmouth and Skegness to Canvey Island and Gosport. Neighbourhoods home to 2,645,000 people in England and Wales have their centre under water. Worldwide, 1,877 cities of more than 15,000 people are below the line, with 234 million people.
At +70 m, roughly every ice sheet and glacier melted, 33% of the UK’s land is sea. London, Hull, Norwich, Cambridge, York and Cardiff are all under. The people of England and Wales live lower than their land does: 60% of them live in neighbourhoods whose centre is under water. The world loses 10.2% of its land outside Antarctica, the Netherlands almost all of it, Denmark and Bangladesh about nine tenths, and 12,857 cities with 1.91 billion people go under. Nothing like this is expected for many centuries. It is a measure of what the ice holds, not a forecast.
How I did this
For each of 216 sea levels, a cell is sea if it is below the level and joined to the ocean through other cells below it. Today’s land never floods when the sea falls, today’s sea never dries when it rises, and the Caspian is a lake. Land the elevation model already puts below sea level is counted separately, because only defences keep it dry. A town counts as under water when its centre point is below the level and the modelled sea comes within one grid cell; people are counted by Census 2021 neighbourhoods in England and Wales. Worldwide figures leave out Antarctica.
The model has no tides, storms, defences or rivers, and it does not move the land or the seabed. It is good for broad shapes and bad for single places. The interactive version lets you drag the sea, switch between the world and Britain, zoom in for finer terrain, look up a town, and see which land bridges and cities come and go.
Notes and sources
- Elevation and sea-floor depth: AWS Terrain Tiles (Mapzen and Tilezen), built from ETOPO1, GMTED2010, SRTM, EU-DEM and other sources listed in its attribution.
- Coast and countries: Natural Earth (public domain). Cities: GeoNames cities15000 (CC BY 4.0).
- UK places: OS Open Names, contains OS data © Crown copyright and database right 2026. Census 2021 and neighbourhood centroids: Office for National Statistics. Both Open Government Licence v3.0.
- Projections: IPCC Sixth Assessment Report, Working Group I (2021) and Synthesis Report (2023). Antarctic ice: BedMachine Antarctica (Morlighem et al. 2020).
- History: Wikipedia, Doggerland, Last Glacial Maximum and Greenland ice sheet (CC BY-SA 4.0).
- Text and figures are CC BY 4.0; the code is MIT.
- I wrote the text, with drafting and editing assistance from Claude (Anthropic), which also helped prepare the analysis code. I reviewed and checked all text and results.

