
Tag: Prehistory
-
When the ice came south: the ice ages mapped, and what lies under them today
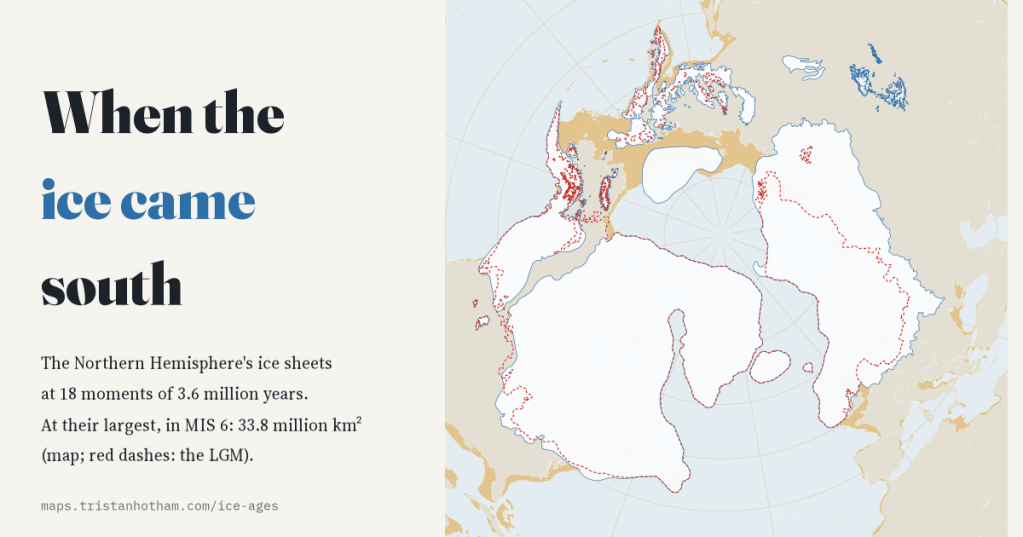
I mapped the Northern Hemisphere’s ice sheets at 18 moments of the last 3.6 million years. The last ice age was only the 4th largest; 709 of today’s cities and towns, New York among them, stand on ground its ice covered.
-
Ancient DNA on the map: 16,496 ancient genomes, placed where and when they lived
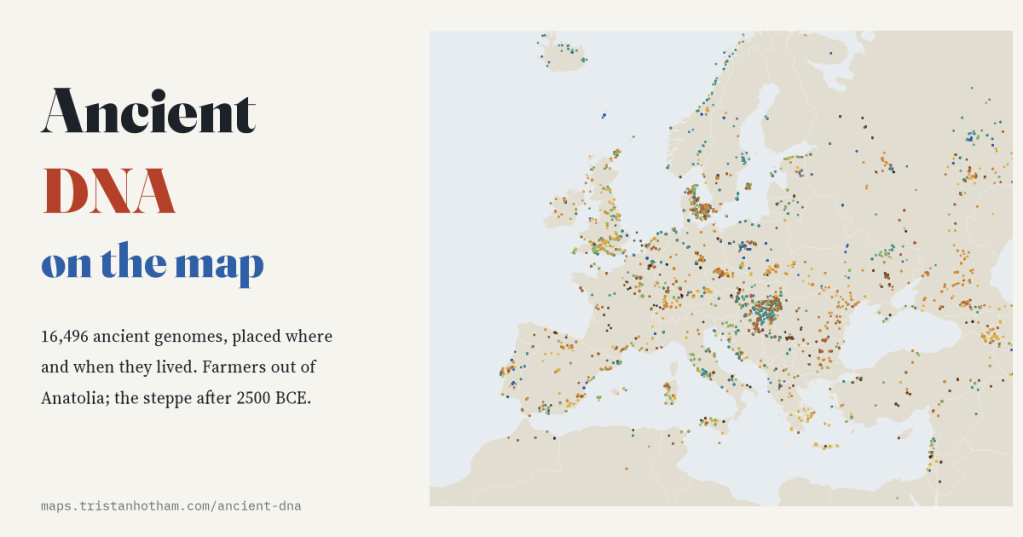
I mapped every ancient human genome in the Allen Ancient DNA Resource, 16,496 people, by where and when they lived. 68% come from Europe; the first farmers spread out of Anatolia at about a kilometre a year; and in Britain, none of 76 men before 2500 BCE carried the Y line R1b.
-
Where languages come from: every language on one map, with its family tree, its future and its homeland
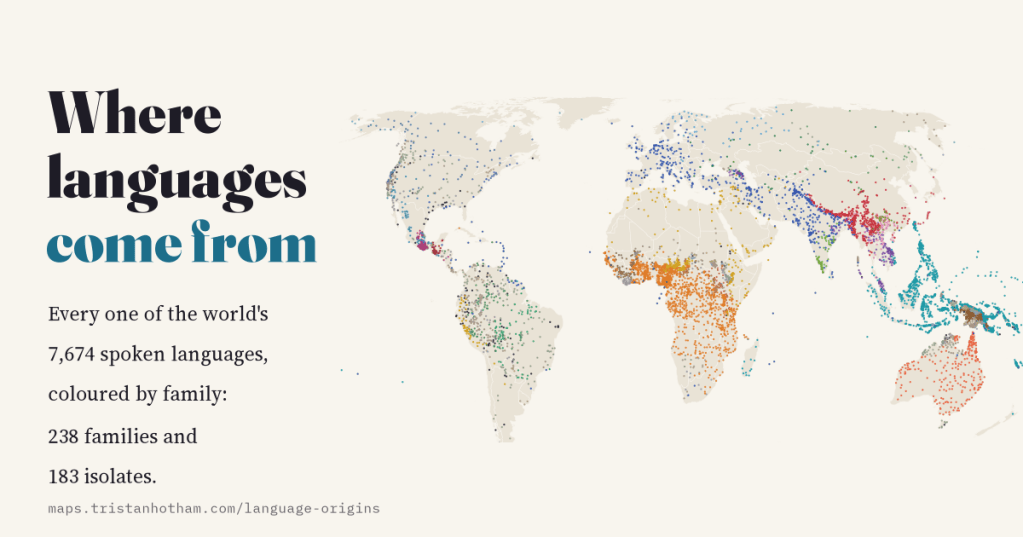
7,674 spoken languages, 421 separate lineages, 52.1% endangered. I mapped every language in Glottolog with its family tree, endangerment, speaker numbers and the proposed homelands of the great language families.
-
Drowned and rising: Britain and the world at every sea level
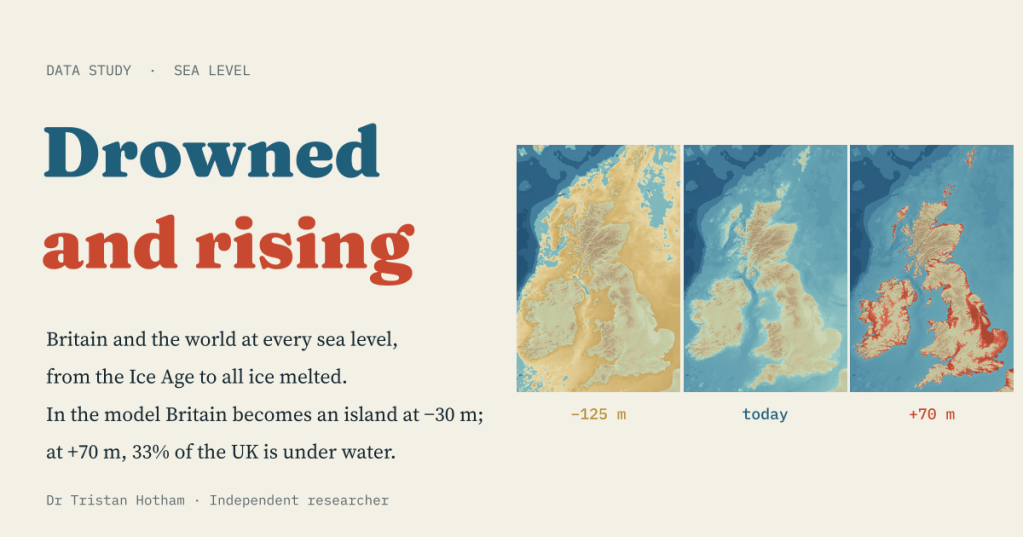
A bathtub model of every sea level from the Ice Age to an ice-free world. In the model Britain becomes an island at −30 m; at +70 m, 33% of the UK is under water.
-
Ley lines, tested: are Britain’s ancient sites lined up more than chance allows?
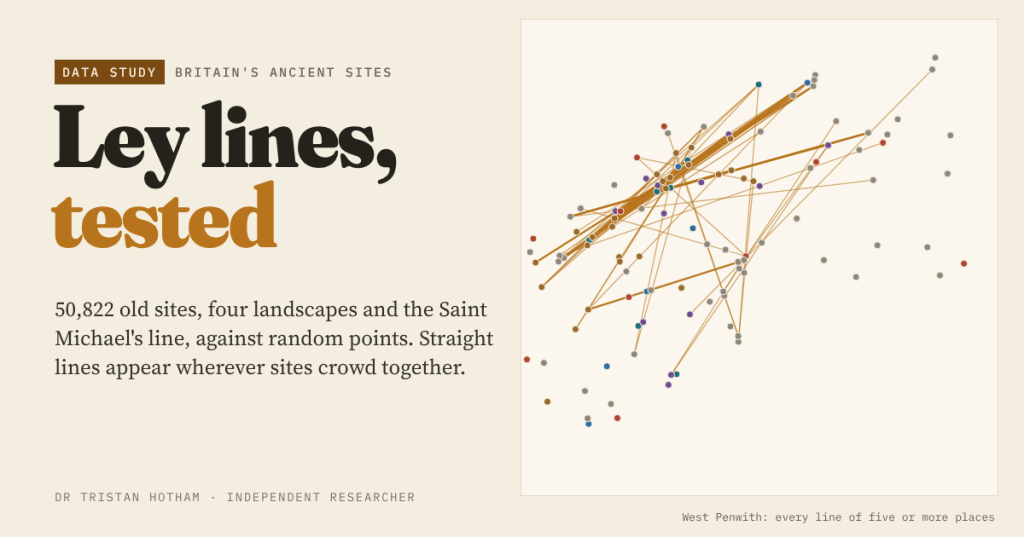
Alfred Watkins saw straight lines of old sites across Herefordshire in 1921. I mapped 50,822 churches, barrows, stones, hillforts and holy wells and compared every alignment with random points: crowding, not planning, explains the leys.

