
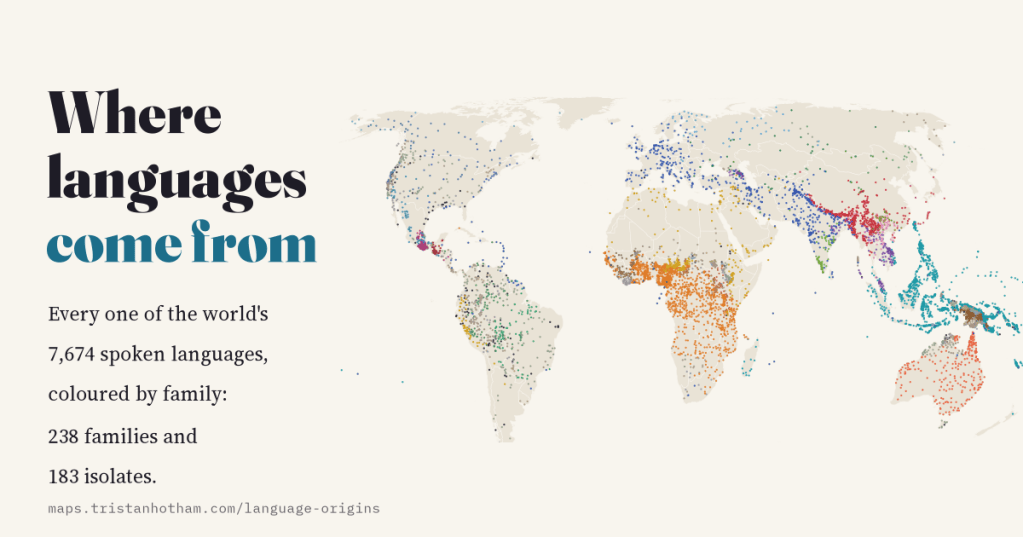
There are 7,674 spoken languages in the world’s most careful catalogue, and they fall into 421 separate lineages that nobody has been able to connect. I put every one of them on a map, with their family trees, how endangered they are, how many people speak them and where the great families may have begun.
Ask how many languages there are and you will get a range of answers, because nobody agrees exactly where one language ends and the next begins. The best open attempt to list them all is Glottolog, run by linguists at the Max Planck Institute for Evolutionary Anthropology in Leipzig. It counts 7,674 spoken first languages, living and dead, and puts nearly all of them on a map. It also does something less obvious: it sorts them into families, the way a biologist sorts species, and only where the evidence of shared descent holds up.
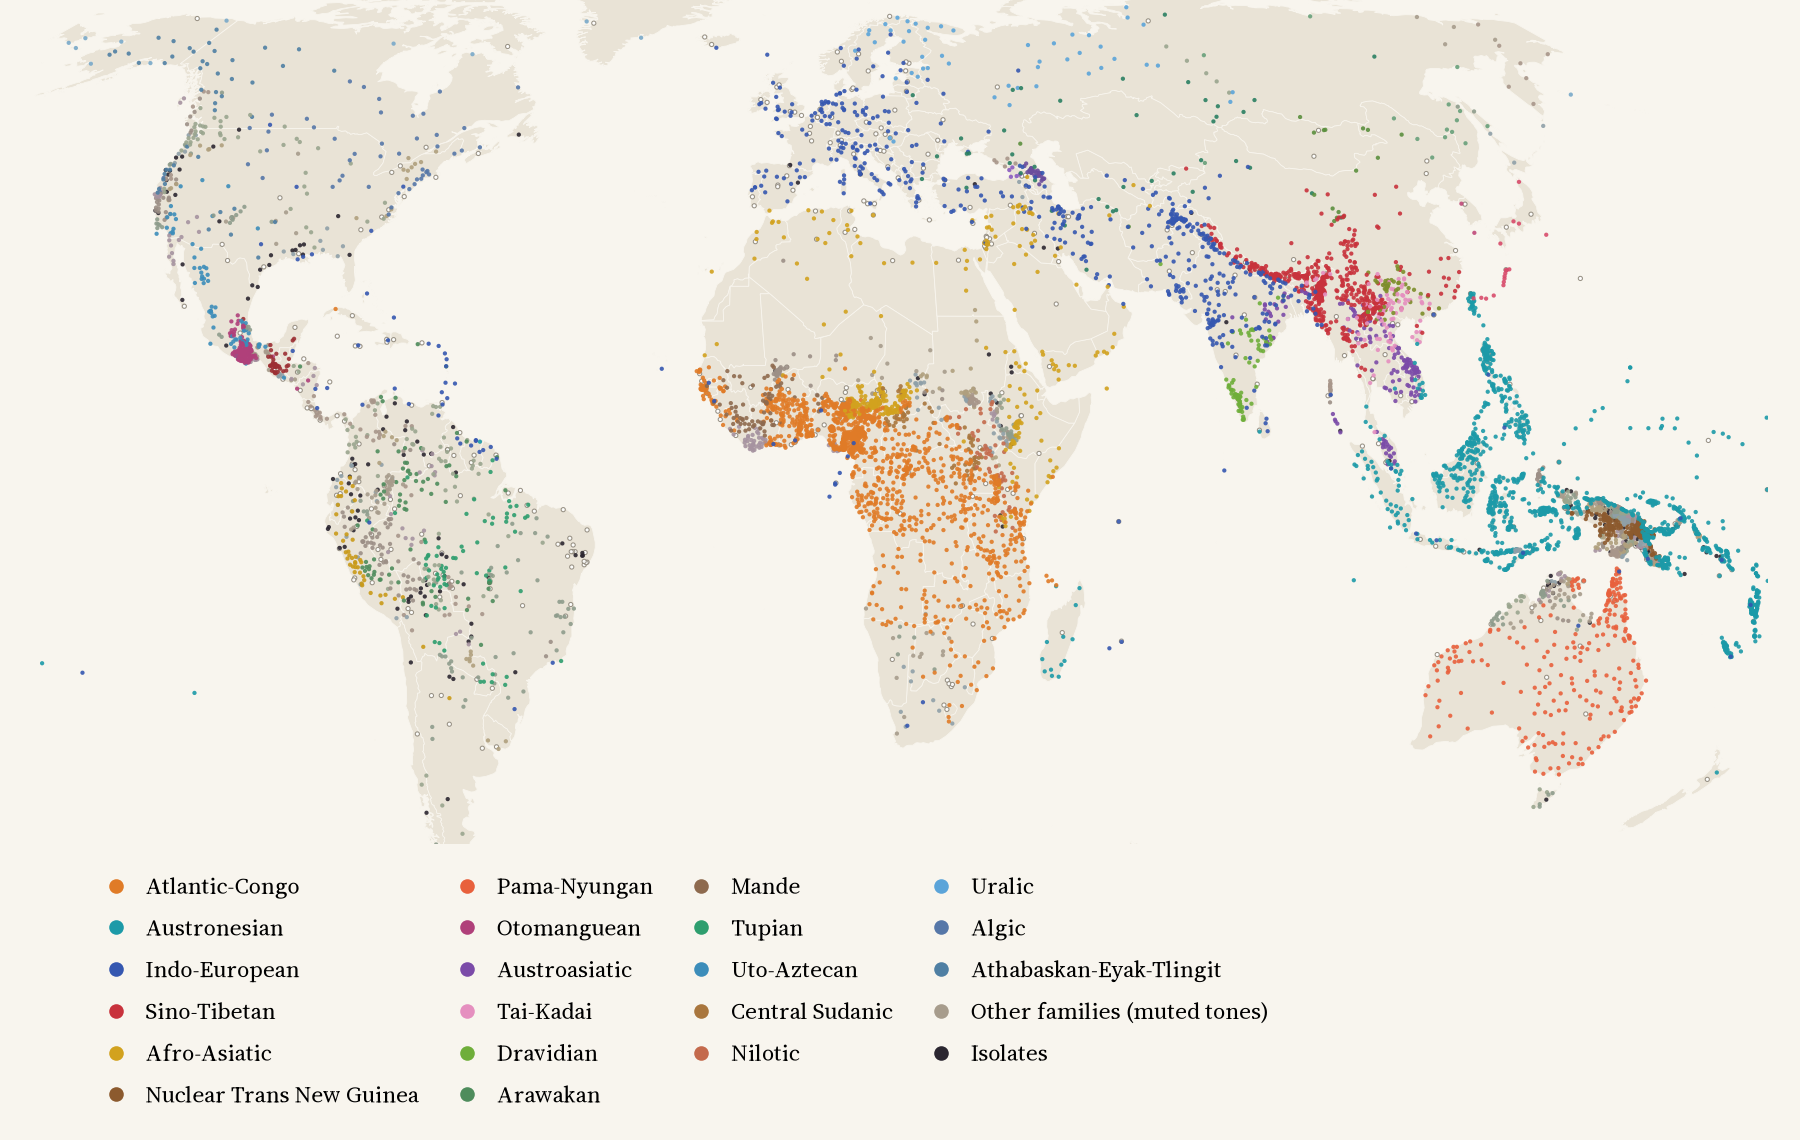
I wanted to see that whole tree at once, so I built a map of it. Every dot below is a language, coloured by its family.
421 family trees, not one
On Glottolog’s strict standard the world’s languages belong to 238 families and 183 isolates: languages such as Basque, Burushaski in the Karakoram and Kusunda in Nepal, which have no relatives anyone has been able to prove. That is 421 lineages, 314 of which still have a living language.
They are wildly unequal. Five families, Atlantic-Congo, Austronesian, Indo-European, Sino-Tibetan and Afro-Asiatic, hold 54.3% of all languages. 135 families have five languages or fewer. And the trees are deep: English sits 11 levels down, inside Anglic, inside Anglo-Frisian, inside West Germanic, inside Germanic, inside Indo-European. On the interactive map you can click your way down that tree and watch each branch light up.
A tropical belt of languages
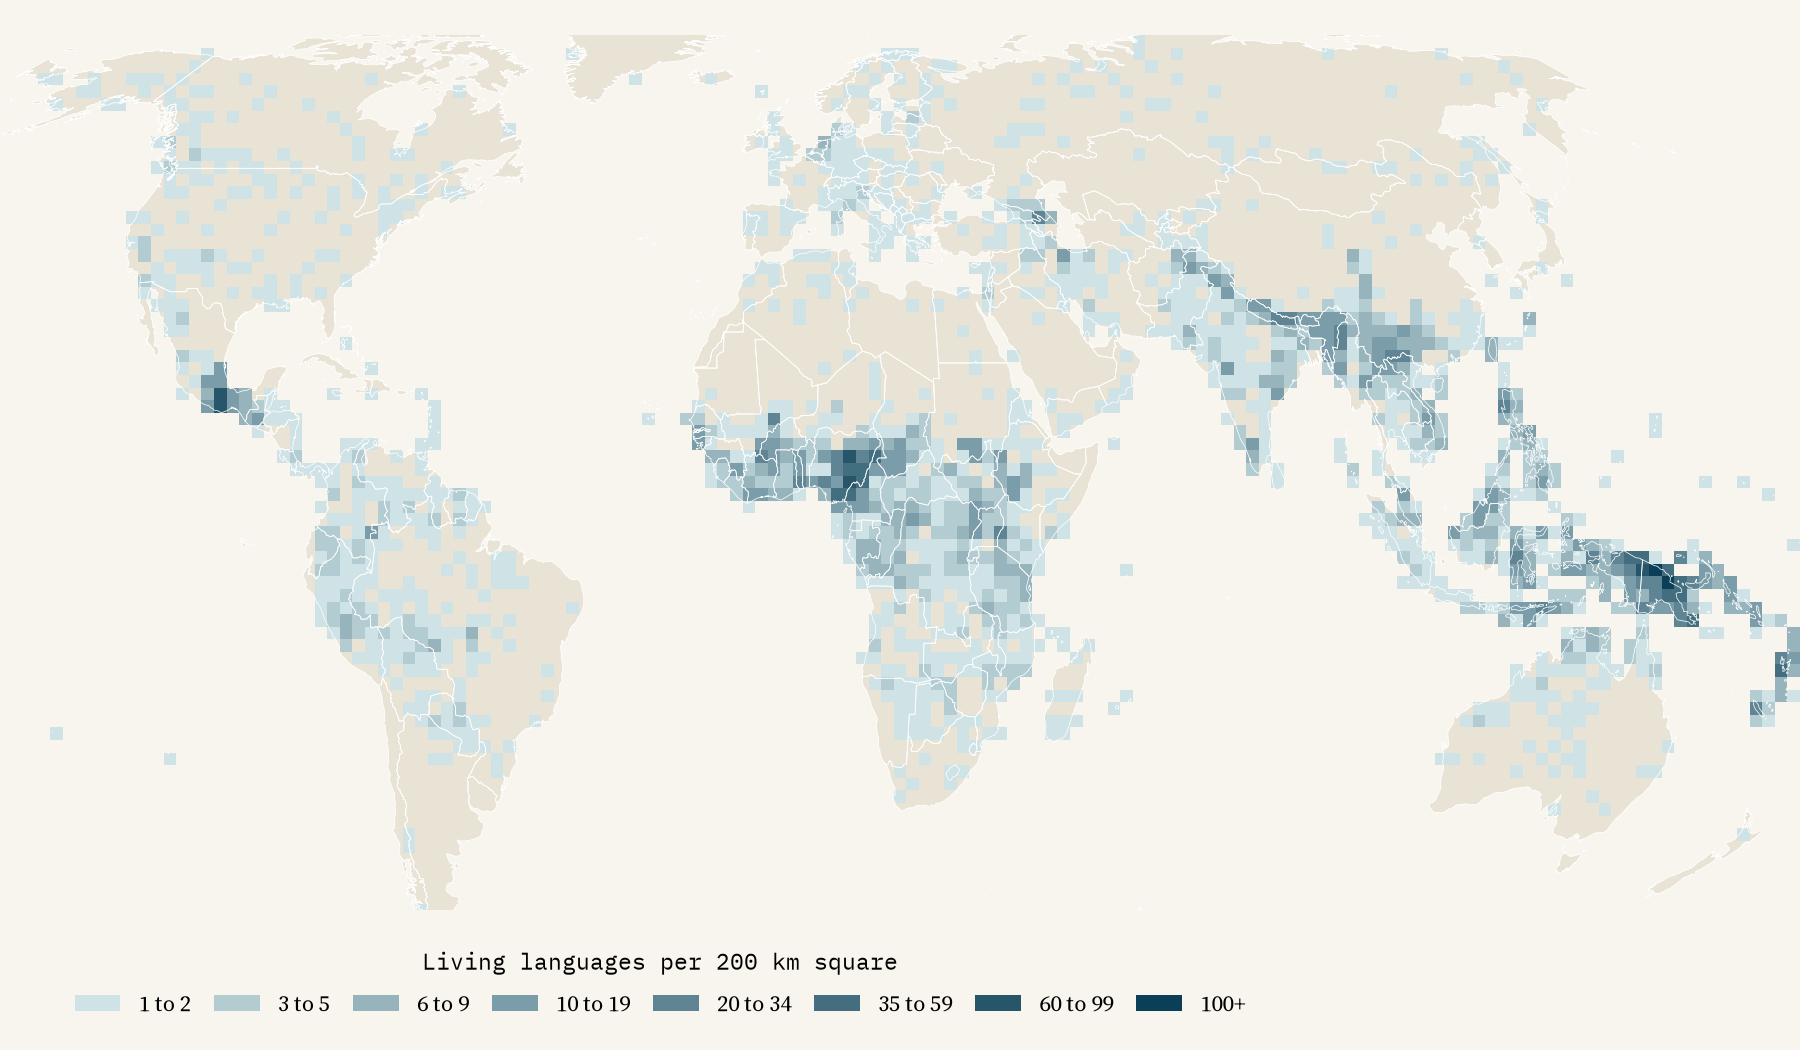
Papua New Guinea is the most linguistically diverse country on Earth by a distance: 850 living languages from 77 separate lineages. Indonesia (702), Nigeria (522), India (450) and China (395) follow. For land area, though, Vanuatu wins: 102.2 languages per 10,000 square kilometres.
To compare places fairly I cut the world into equal-area squares 200 kilometres across. One square in Madang, Papua New Guinea holds 148 living languages. The densest 1% of the world’s land holds 27.6% of all of them, in a belt that runs through New Guinea and Melanesia, the Nigeria and Cameroon borderland, southern Mexico and the eastern Himalaya.
Most languages are in danger
Glottolog combines the endangerment ratings of Ethnologue, UNESCO and the Endangered Languages Catalogue into a single scale. Only 35.0% of the world’s spoken languages are rated not endangered. 52.1% are endangered, from threatened to nearly extinct, and 12.8% are already extinct.
The losses follow colonial history. In Glottolog’s Australia region, 63.9% of languages are extinct; in South America 35.1%, in North America 28.2%. In Africa the figure is 4.2%. Of the 421 lineages, 324 have no language left that is rated safe.
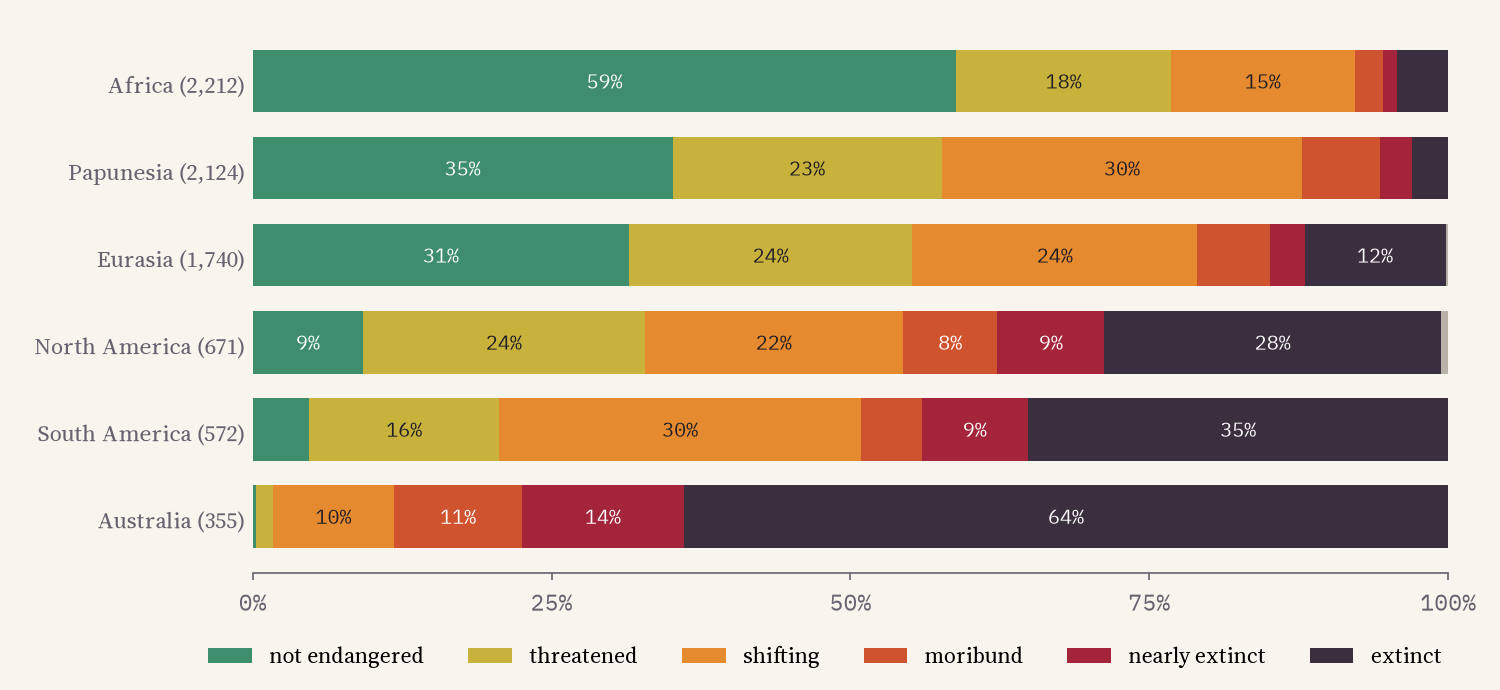
Only 35.0% of the world’s spoken languages are rated safe. In Australia, 63.9% are already extinct.
A few giants
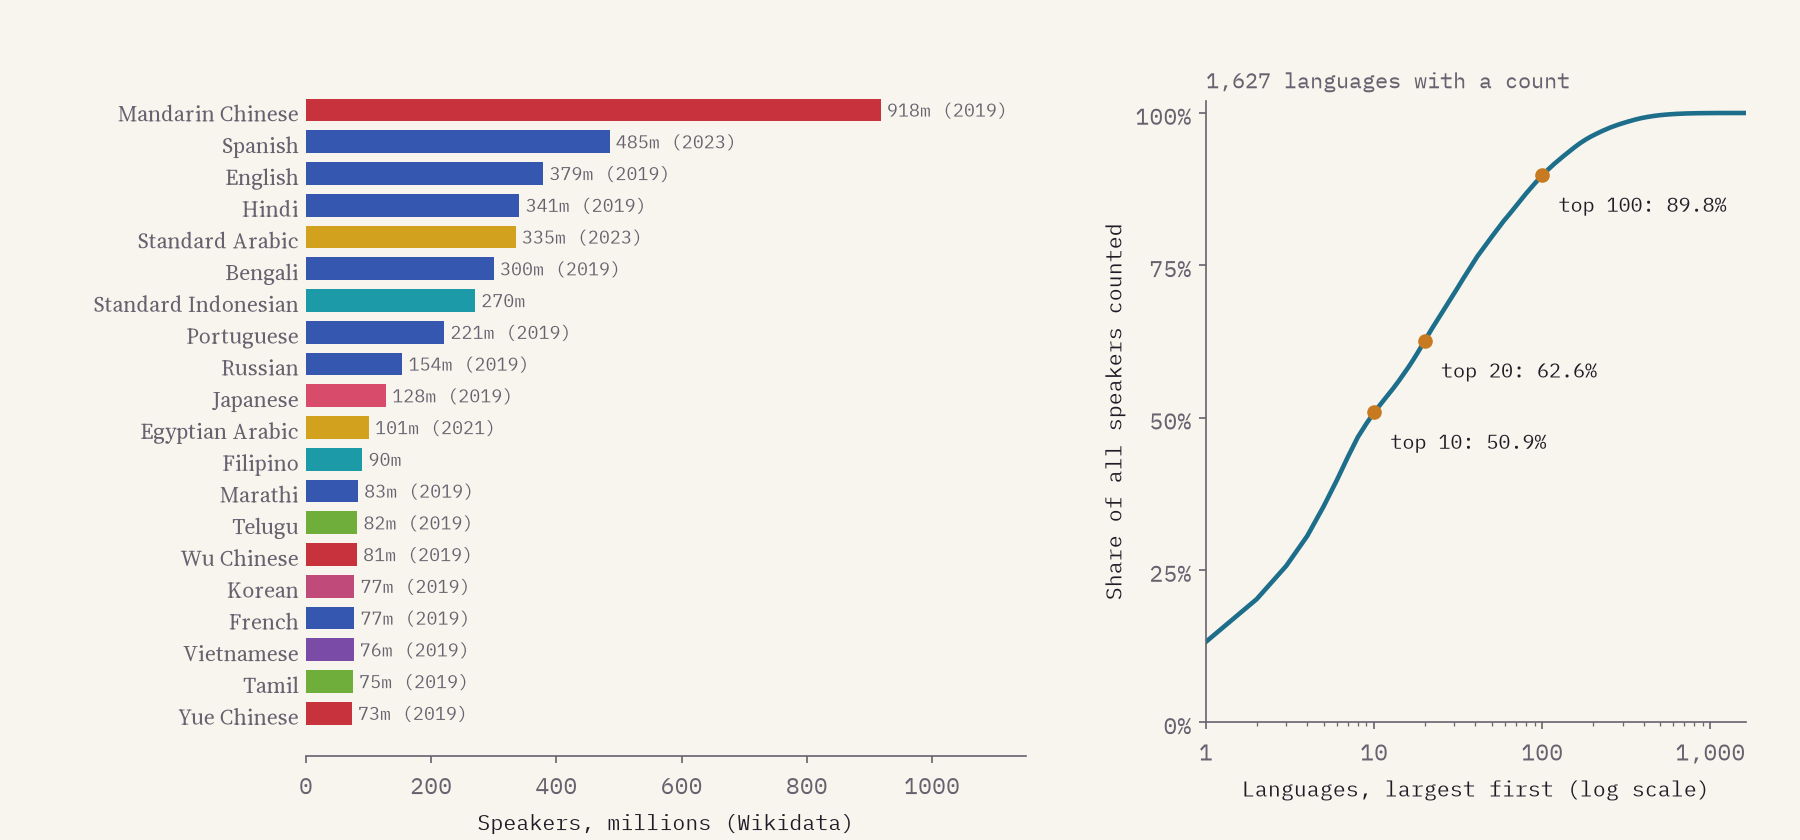
Glottolog does not count speakers, so I took counts from Wikidata, which has one for 1,627 languages. They are a patchwork of years and definitions (some count only native speakers, some everyone), so read them as orders of magnitude. Even so, the picture is stark: the 10 largest languages, led by Mandarin Chinese, account for 50.9% of all speakers counted, and the 20 largest for 62.6%. Half the languages with a count have fewer than 20,000 speakers, and most of those without a count are smaller still.
Where did the families begin?
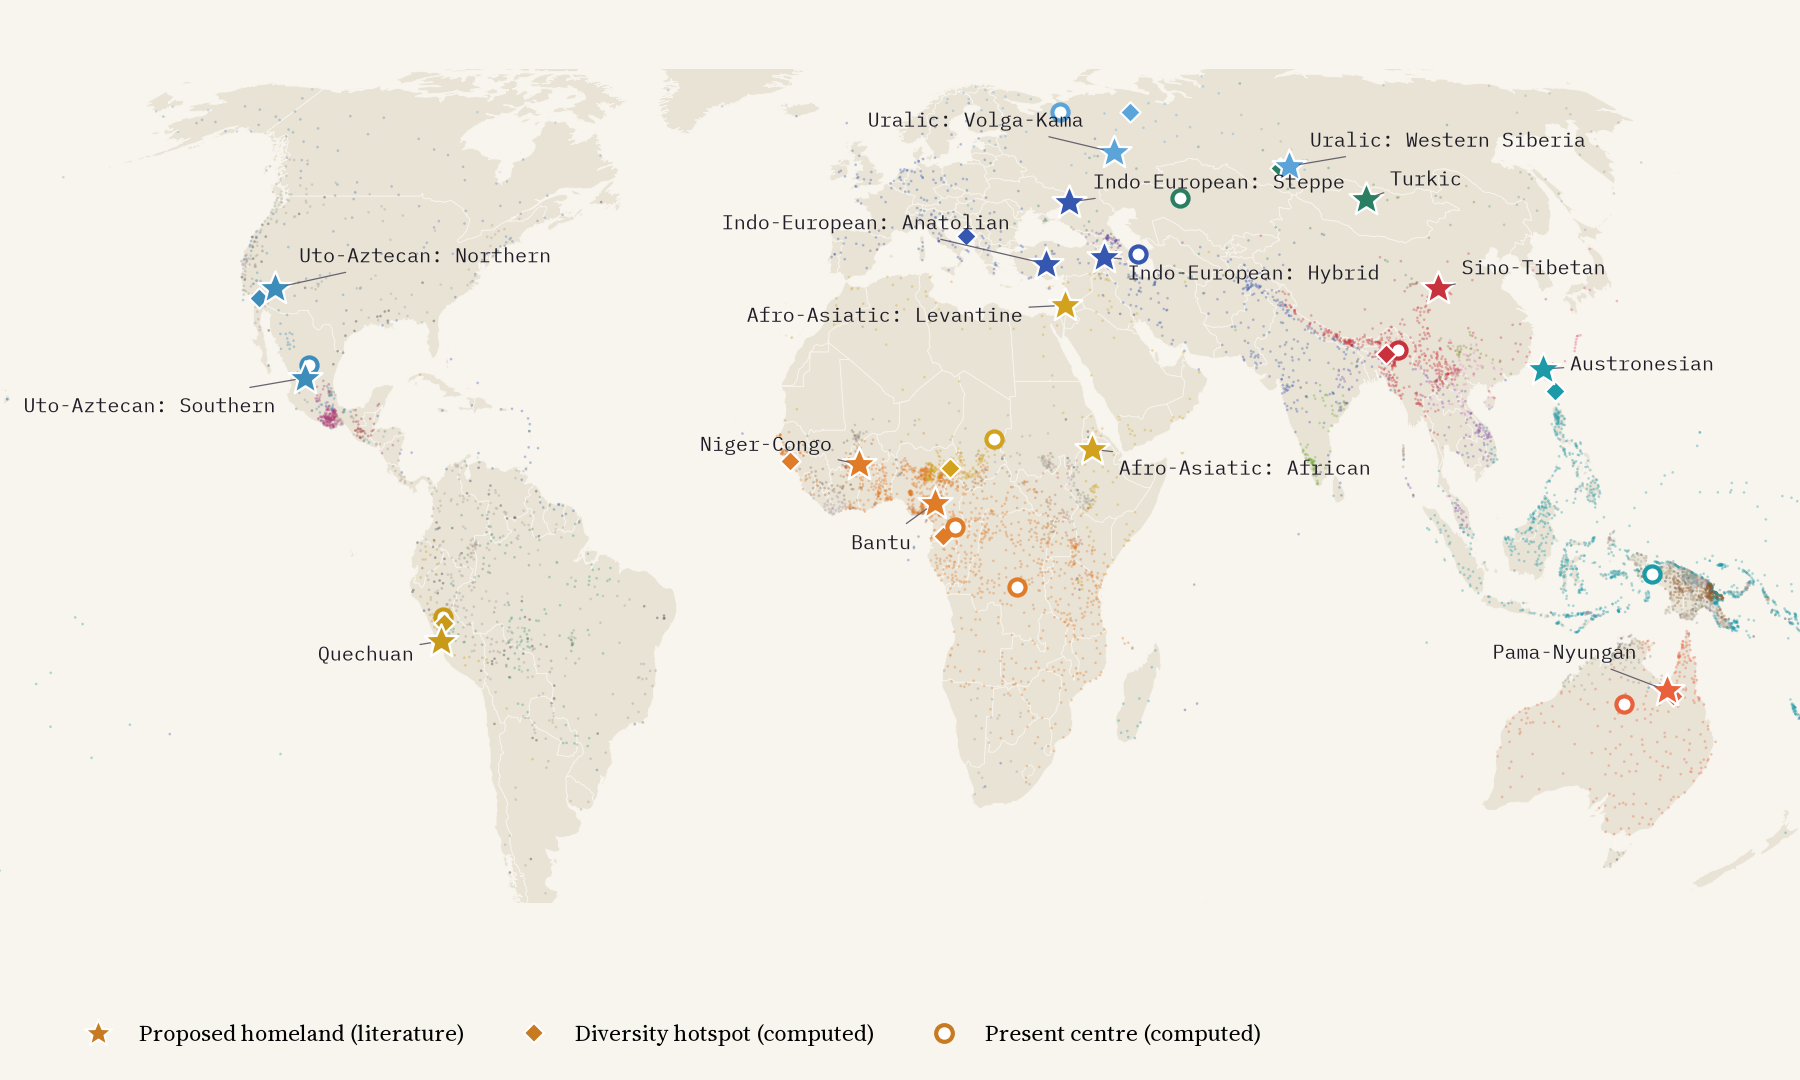
This is the detective story. Every family had a first speech community somewhere, and linguists, archaeologists and geneticists have spent two centuries arguing about where. I collected the main published proposals for 11 large families, with dates: the Pontic-Caspian steppe and Anatolia for Indo-European (and a newer hybrid south of the Caucasus), Taiwan for Austronesian, the Cameroon and Nigeria borderland for Bantu, the Gulf Plains of Queensland for Pama-Nyungan, central Peru for Quechua, and more. They are hypotheses, and some are hotly contested.
Then I asked a simple question of the data. Where do each family’s deepest branches crowd most closely together today? It is an old rule of thumb that a family has usually been longest where its deepest divisions sit side by side. For 5 of 11 families that hotspot lands within 500 kilometres of a proposed homeland. Austronesian’s is on a small island between Taiwan and the Philippines, 340 km from Taiwan, even though the family’s centre today is in New Guinea. Pama-Nyungan’s is 178 km from the Gulf Plains. But Indo-European’s lands in the Balkans, far from the steppe and from Anatolia, because three thousand years of later movement have reshuffled Europe. The rule works for families that left their early branches in place, and fails for those that kept moving.
How I did this
Everything comes from Glottolog 5.2.1’s open data release. I dropped its ‘bookkeeping’ entries (names kept for reference, not languages), and counted families, endangerment and diversity over spoken first languages; sign languages, pidgins and a few others are on the map in grey. Speaker counts come from Wikidata: where a language has several, I took the most recent. Diversity is counted in equal-area squares and by the countries Glottolog lists for each language. The homelands are typed in from the published studies, each one cited on the page and in the paper; the hotspots and centres are my own simple calculations. One dot per language means the map shows where languages come from more than where their speakers live now: English has one dot, in England. The paper sets out every step and caveat.
Notes and sources
- Hammarström, H., Forkel, R., Haspelmath, M. and Bank, S. (2025) Glottolog 5.2.1. Max Planck Institute for Evolutionary Anthropology. CC BY 4.0.
- Wikidata, number of speakers. CC0.
- Natural Earth (public domain).
- Homelands: Anthony (2007); Anthony and Ringe (2015); Haak et al. (2015); Renfrew (1987); Bouckaert et al. (2012); Heggarty et al. (2023); Blust (1999); Gray et al. (2009); Vansina (1995); Grollemund et al. (2015); Honkola et al. (2013); Grünthal et al. (2022); Janhunen (2009); Golden (1992); Savelyev and Robbeets (2020); Zhang et al. (2019); Sagart et al. (2019); Ehret (1995); Ehret et al. (2004); Militarev (2002); Williamson and Blench (2000); Güldemann (2018); Bouckaert, Bowern and Atkinson (2018); Hill (2001); Fowler (1983); Torero (1964); Adelaar and Muysken (2004). Full references are in the paper and on the interactive page.
- I wrote the text, with drafting and editing assistance from Claude (Anthropic), which also helped prepare the analysis code. I reviewed and checked all text and results.

