
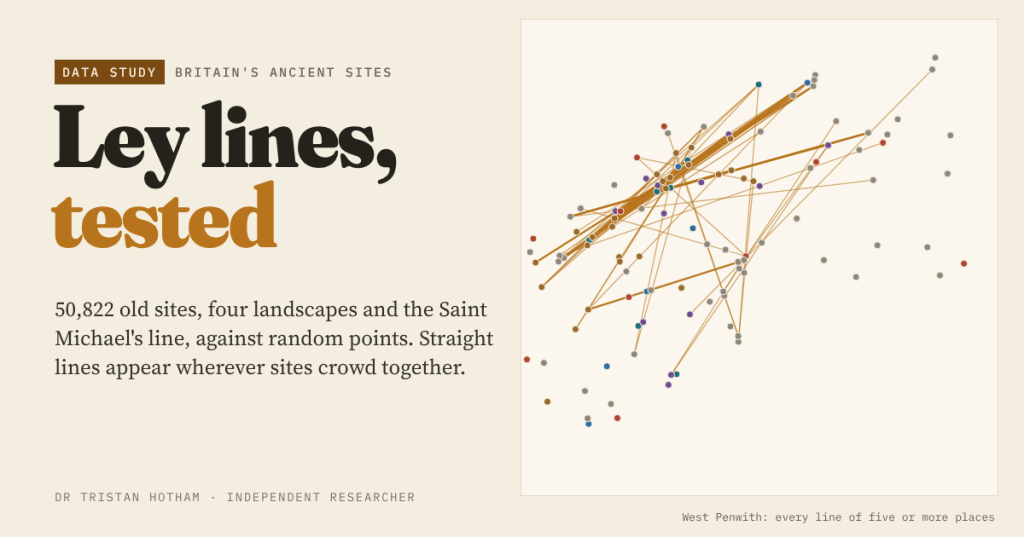
In 1921 Alfred Watkins saw old sites falling into straight lines across Herefordshire and called them leys. A century later I put 50,822 churches, barrows, stones, hillforts and holy wells on one map and asked how many lines chance alone would draw.
Most of my work is about patterns that people see in data and whether they are really there: a surge on social media, a campaign that seems to be everywhere. Ley lines are the oldest version of that problem I know. Watkins, a Hereford businessman and antiquarian, was in the hills near Blackwardine on 30 June 1921 when, as he told it, a church, a mound, a camp and a stone lined up in front of him. He went home, ruled lines across his Ordnance Survey maps, and in The Old Straight Track (1925) argued that prehistoric Britons had walked straight sighted tracks between mark points.
Archaeologists never bought it. The idea came back in the 1960s as lines of earth energy, and John Michell gave us the Saint Michael’s line, a chain of hilltop sites of the archangel from Cornwall towards Norfolk. In 1980 the statistician Simon Broadbent asked the question that matters: how many alignments would you expect if nobody had lined anything up? I wanted to ask it again with today’s open data.
Fifty thousand dots
I gathered every church and chapel in Wikidata (of every date, which is how ley hunters used them too), barrows and cairns, standing stones and other megaliths, stone circles, holy wells from OpenStreetMap and Wikidata, and hillforts from the Atlas of Hillforts. Merging duplicates left 50,822 sites in Great Britain.
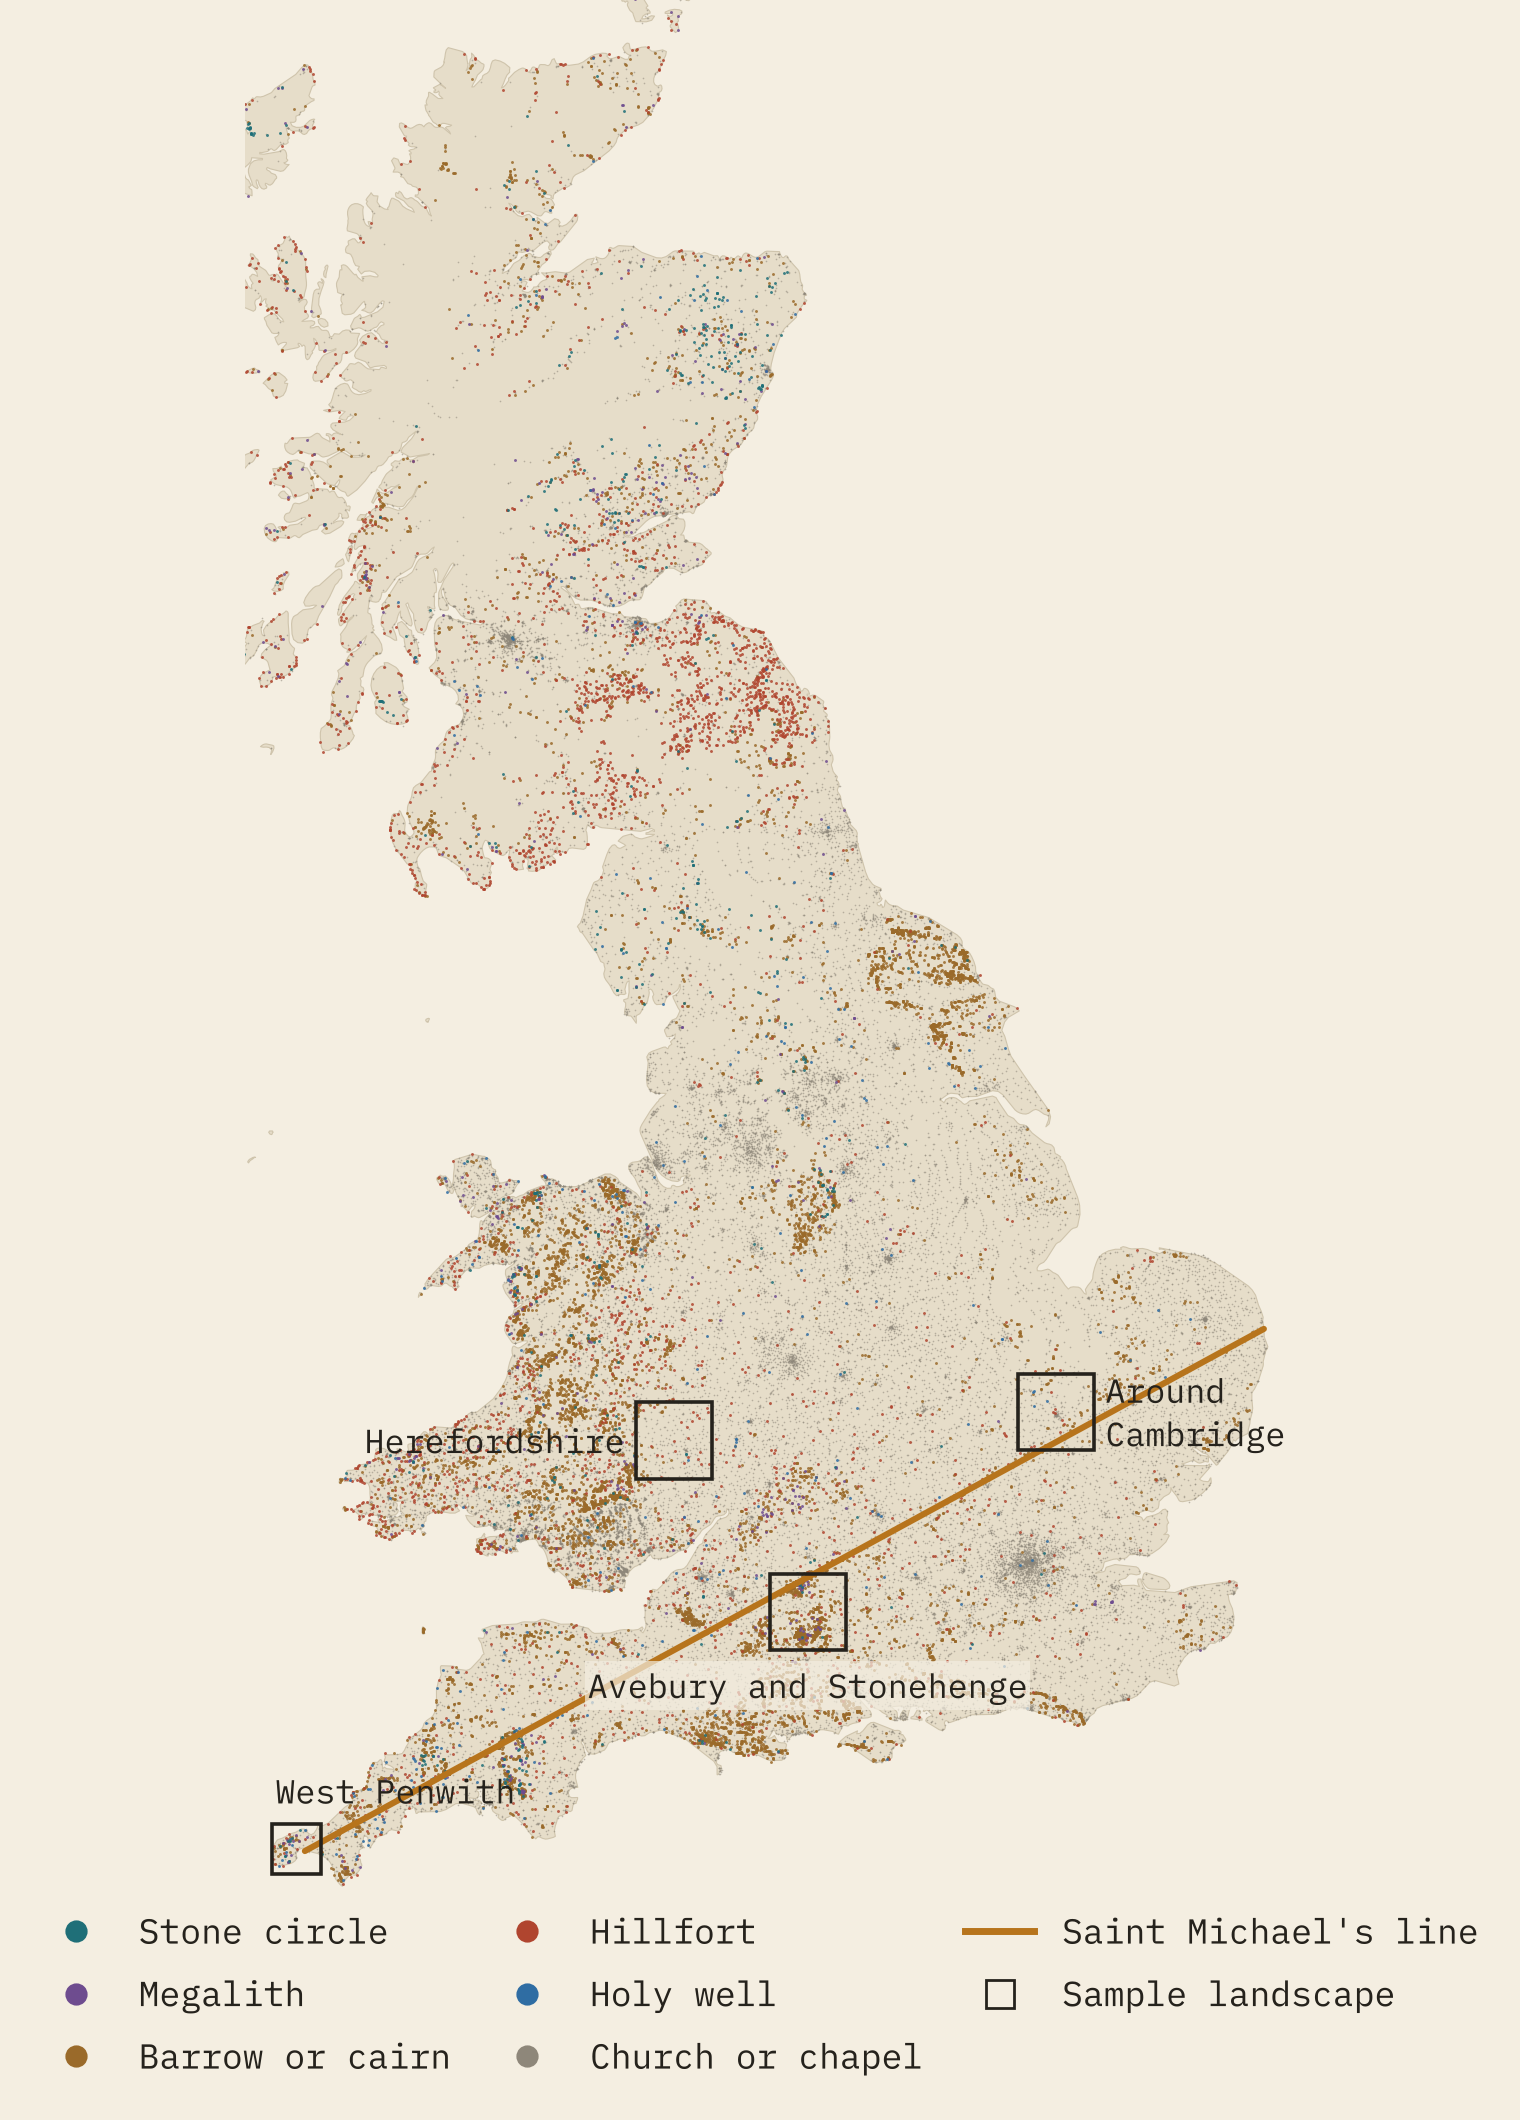
Then I picked four landscapes that made leys famous: Watkins’s own Herefordshire; West Penwith at the tip of Cornwall, which Michell surveyed for leys; the Wiltshire chalk from Avebury to Stonehenge; and the country around Cambridge, subject of Watkins’s last book. In each I counted every straight line of three, four, five and six places, where the two end places are 1 to 20 km apart and everything in between sits within 50 m of the line: a corridor 100 m wide.
Random points make leys too
The key fact about alignments is how fast they multiply. A line of four needs one pair of points to set it up and two more that happen to fall in its thin corridor. So the expected number rises with roughly the fourth power of the number of points and the square of the corridor width. Double the points and you get about 16 times as many lines of four. Two hundred random points in a 40 km square give about 130 of them.
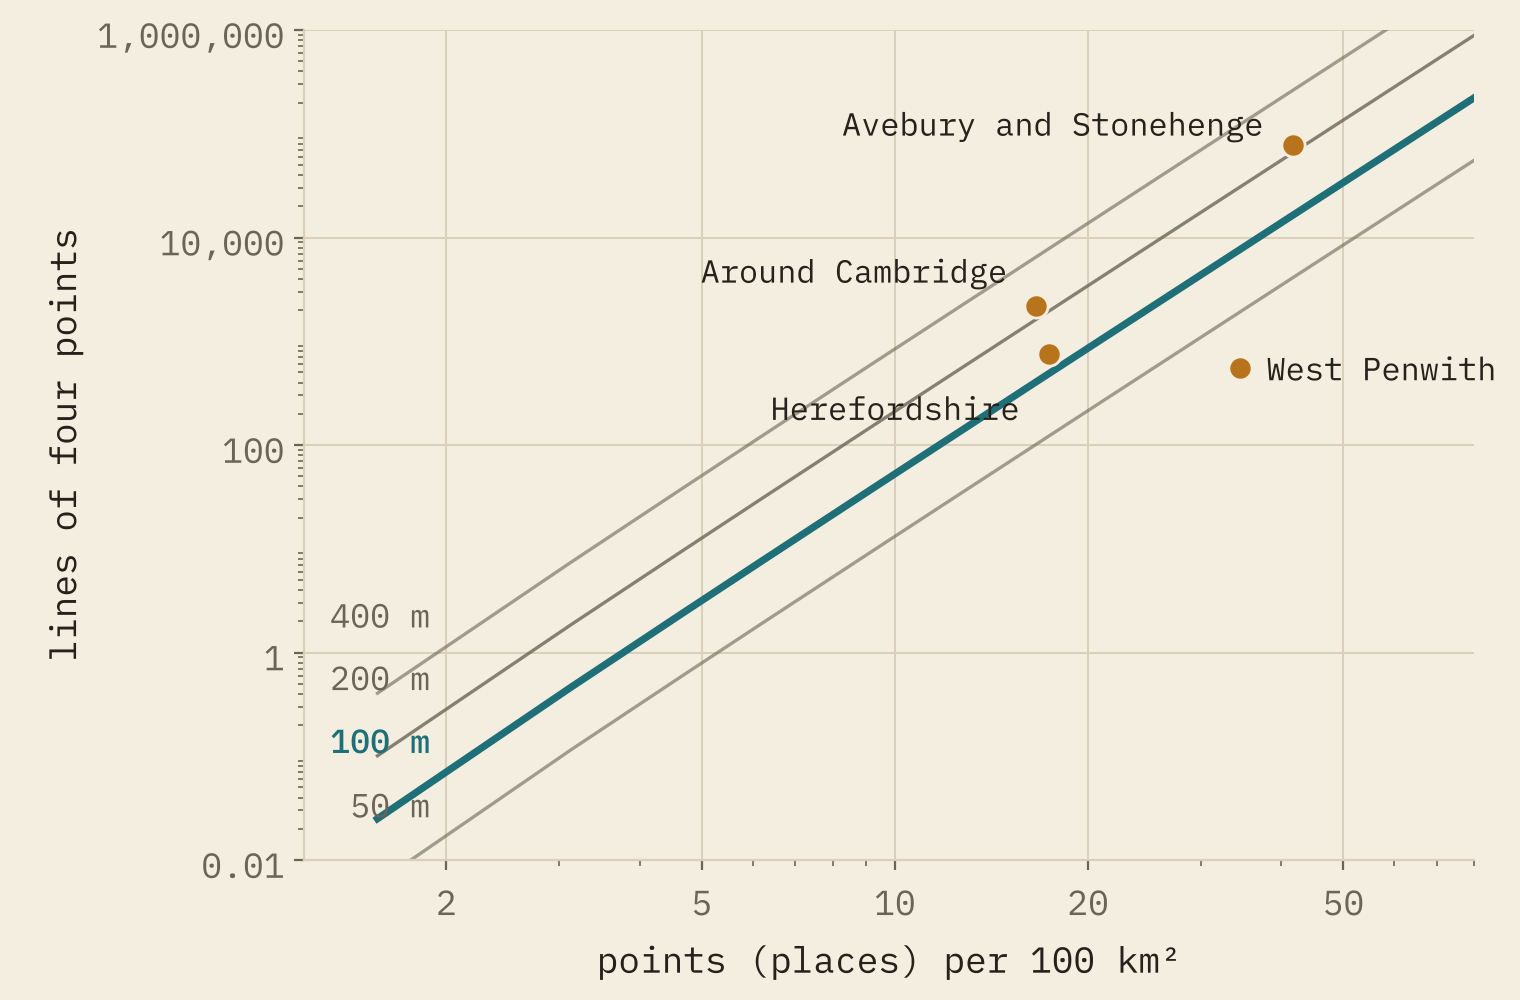
The interactive version has a little box where you can scatter random points yourself and watch the leys appear. It is oddly satisfying.
The real landscapes beat random points…
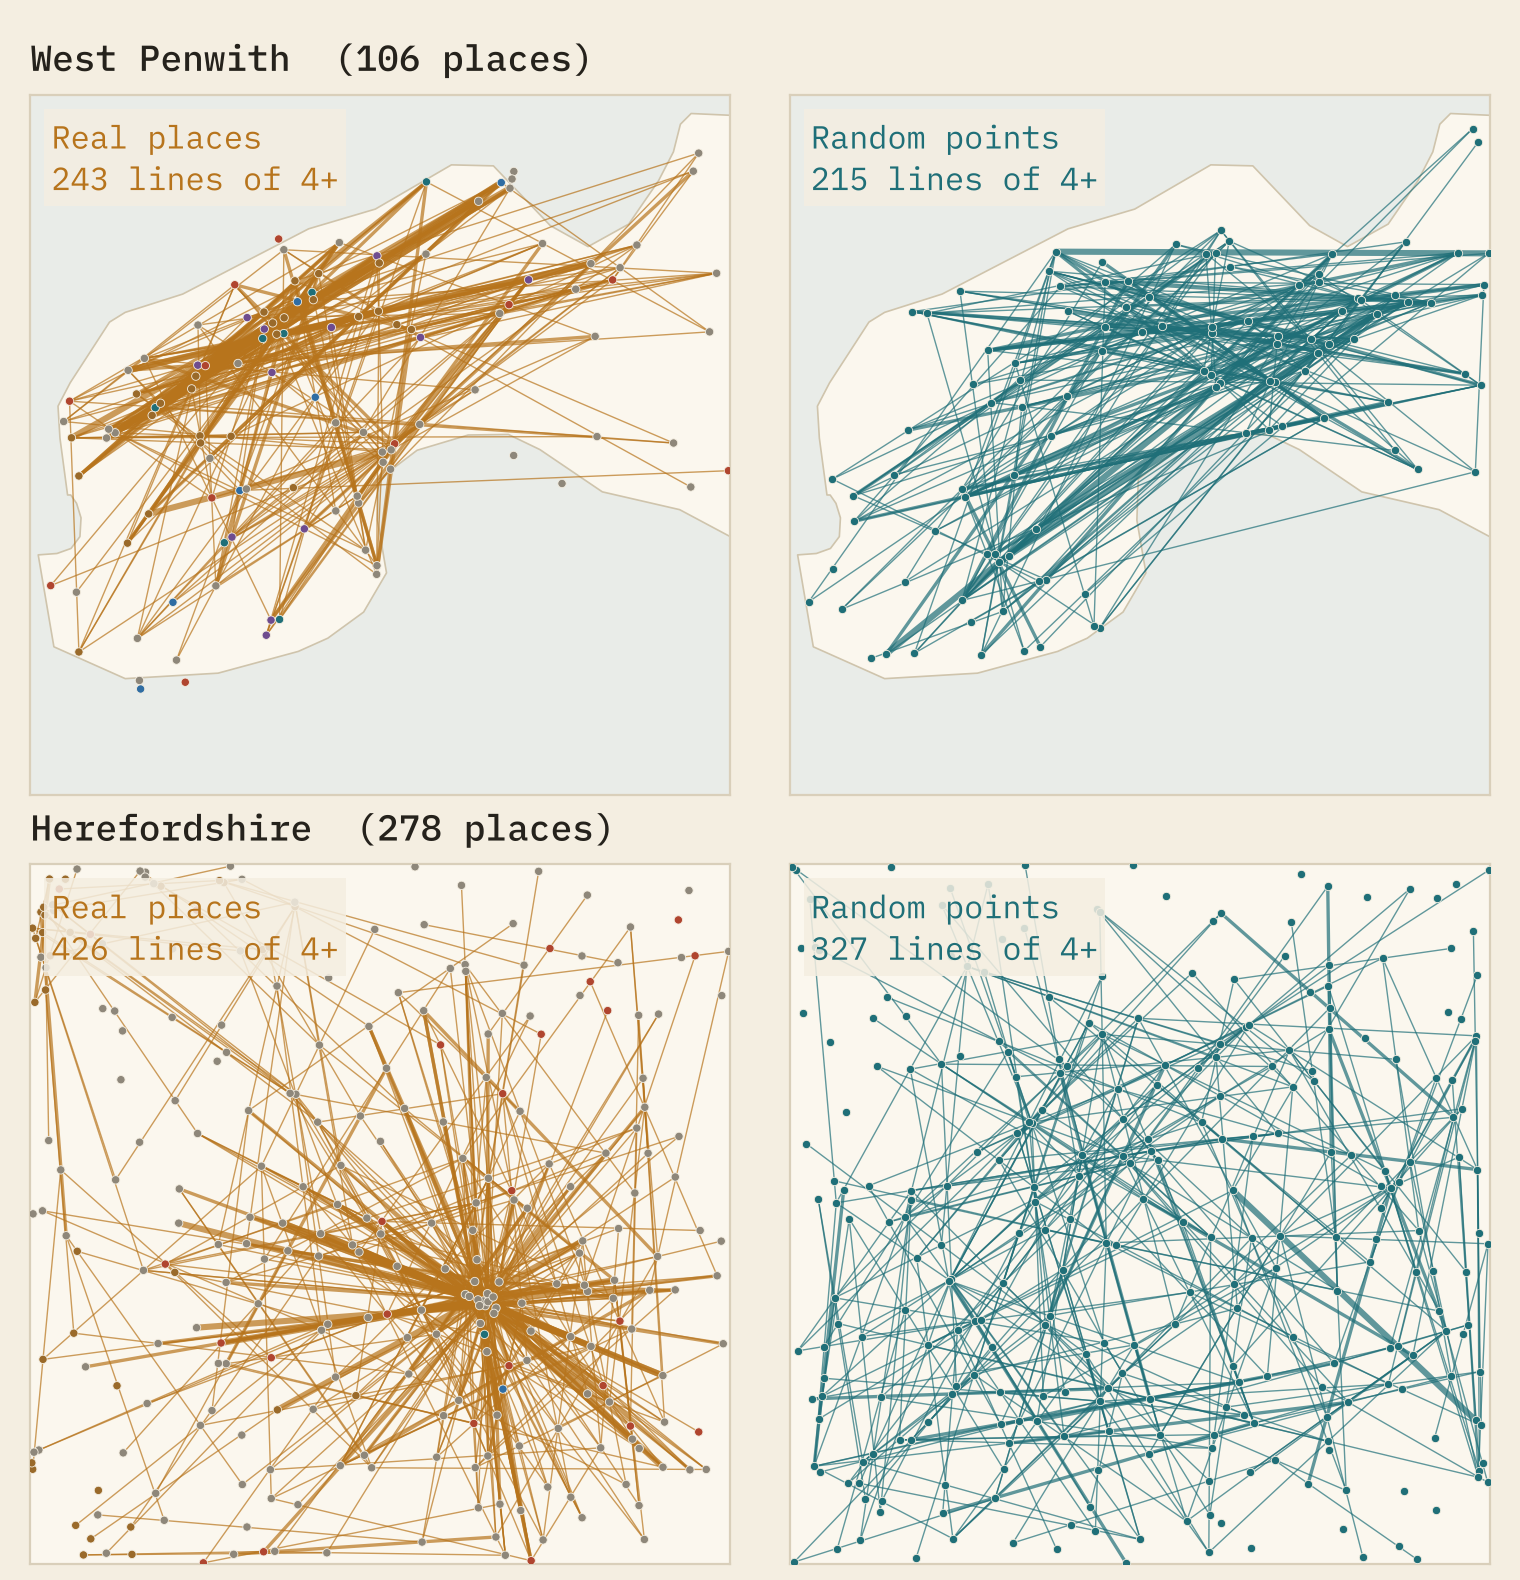
Here is the result that a ley hunter would love. In every landscape, the real sites form more lines than points scattered evenly over the same land: between 1.5 and 5.4 times as many lines of four. In Herefordshire I count 759, against 494 on average from 300 random scatters.
…and random points that crowd do just as well
But real sites are not scattered evenly. Churches gather in towns and villages, villages follow rivers and roads, and barrows crowd onto chalk ridges. Since lines multiply with density, crowding alone creates them. So I made a second kind of random version: take every real place and nudge it up to 1 km in a random direction. That keeps the crowding and breaks any exact line.
Against these nudged versions, the real counts sit between 0.94 and 1.14 times the average, inside the range chance gives in all four landscapes. Herefordshire’s 759 lines compare with 721 on average. The same holds for prehistoric sites alone: West Penwith’s 103 lines of four prehistoric places look remarkable against 19.2 from even scatter, and ordinary against 76.1 from the nudged ones.
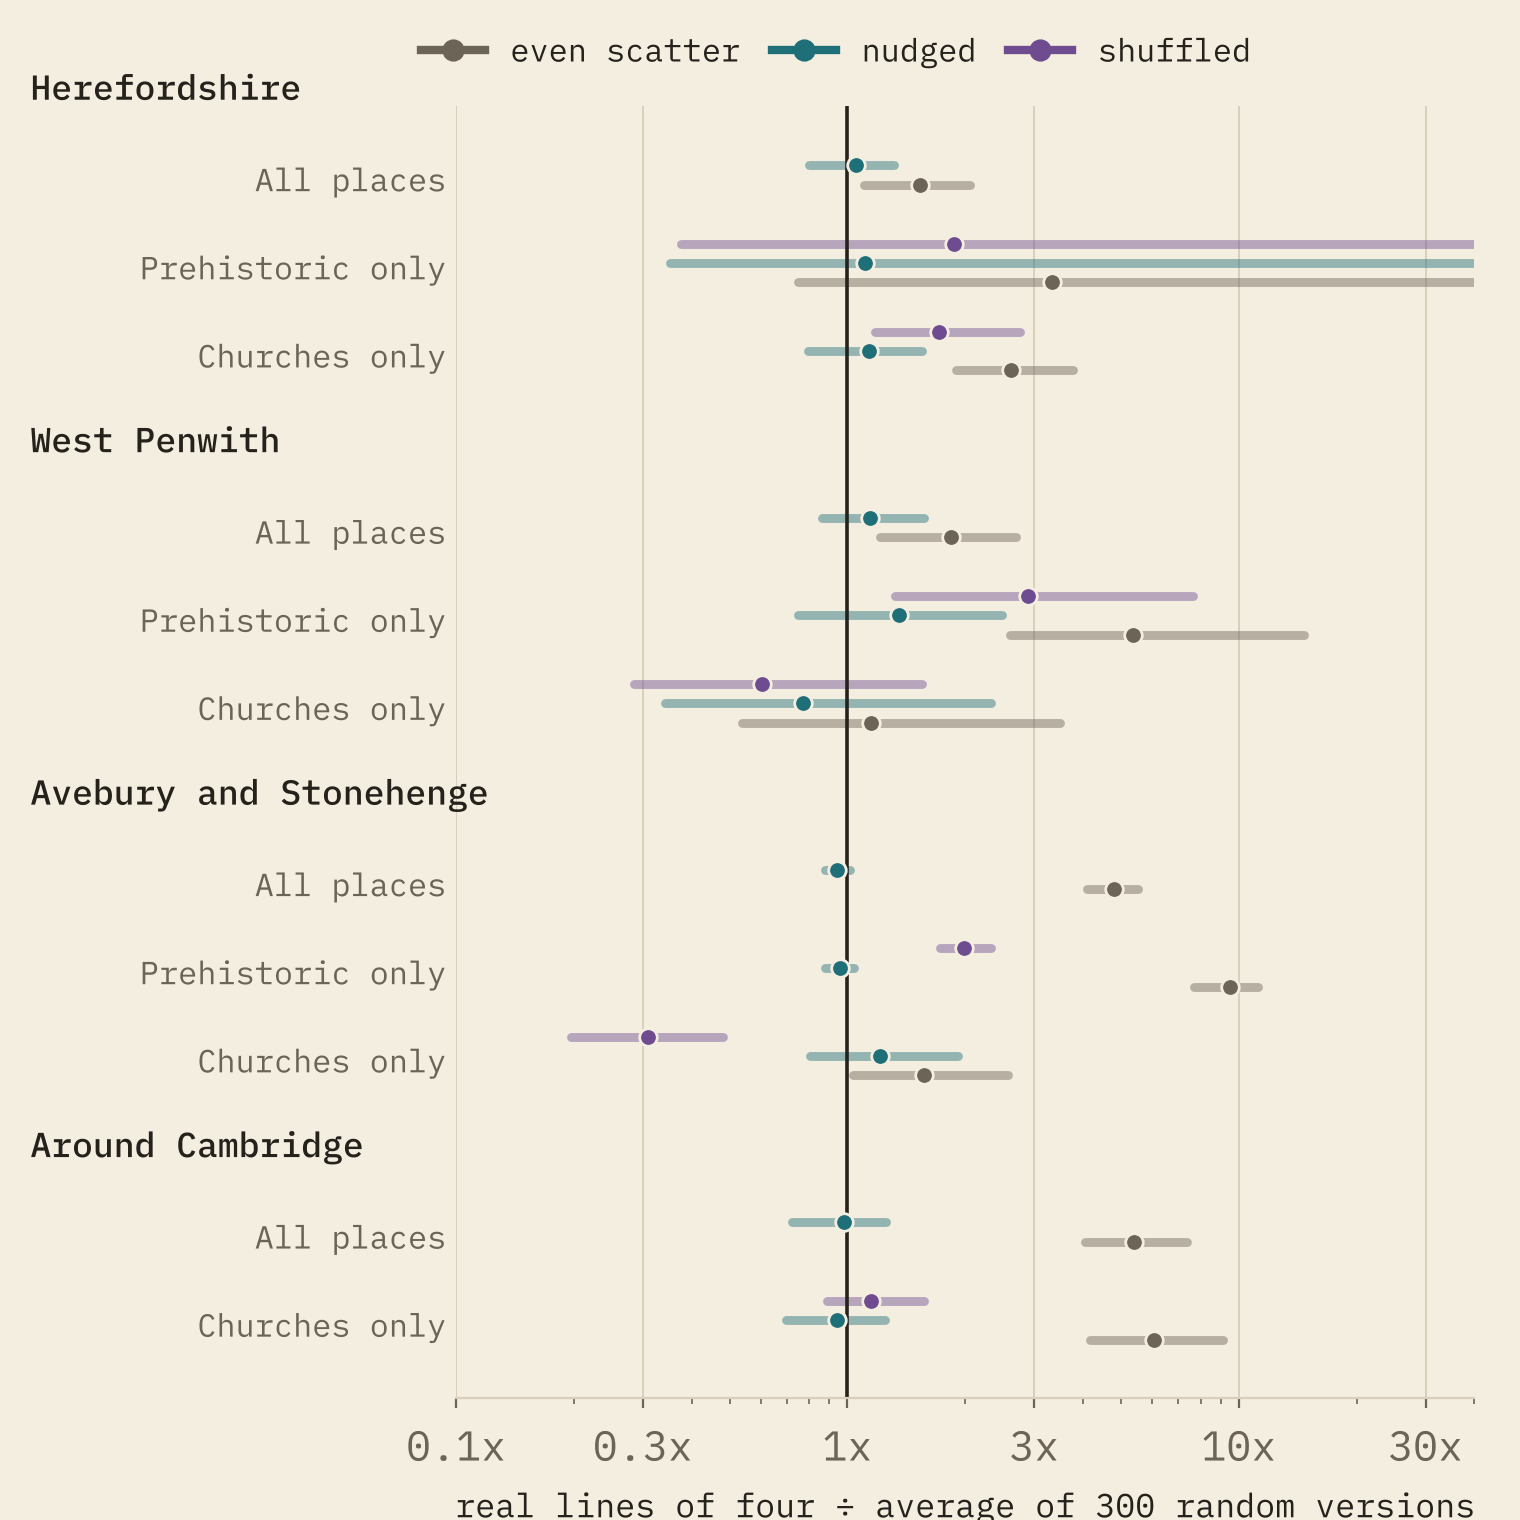
The landscapes are full of straight lines. Random points that crowd where the real sites crowd draw just as many.
The computer does find lovely leys. The longest in West Penwith runs 18.8 km from Ballowall Barrow near the west coast through Chûn Quoit, Mên Scryfa and four barrows to St Ia’s church in St Ives: 8 places in a line. The longest in Herefordshire is 7 churches and chapels, four of them in Hereford itself. The line-finder does not care how old anything is.
The Saint Michael’s line
I drew it as the straight line from St Michael’s Mount through St Michael’s church on Glastonbury Tor and carried on to the coast. It runs 572 km and comes ashore 1.1 km from Gorleston-on-Sea in Norfolk. Burrow Mump and Creech St Michael lie within about 242 m of it, Brent Tor church 1,311 m.
I compared it with 2,000 copies of itself, rotated by up to 20 degrees and shifted by up to 80 km. Within 1 km the real line passes 393 sites; a moved copy of the same length would pass 344 on average. It does better than most copies on prehistoric sites (the 94th percentile), because it crosses barrow-rich Wessex, and on churches of St Michael (16 against 9.2, the 93th). Neither clears the usual 95% bar, and at a tight 100 m it is below average.
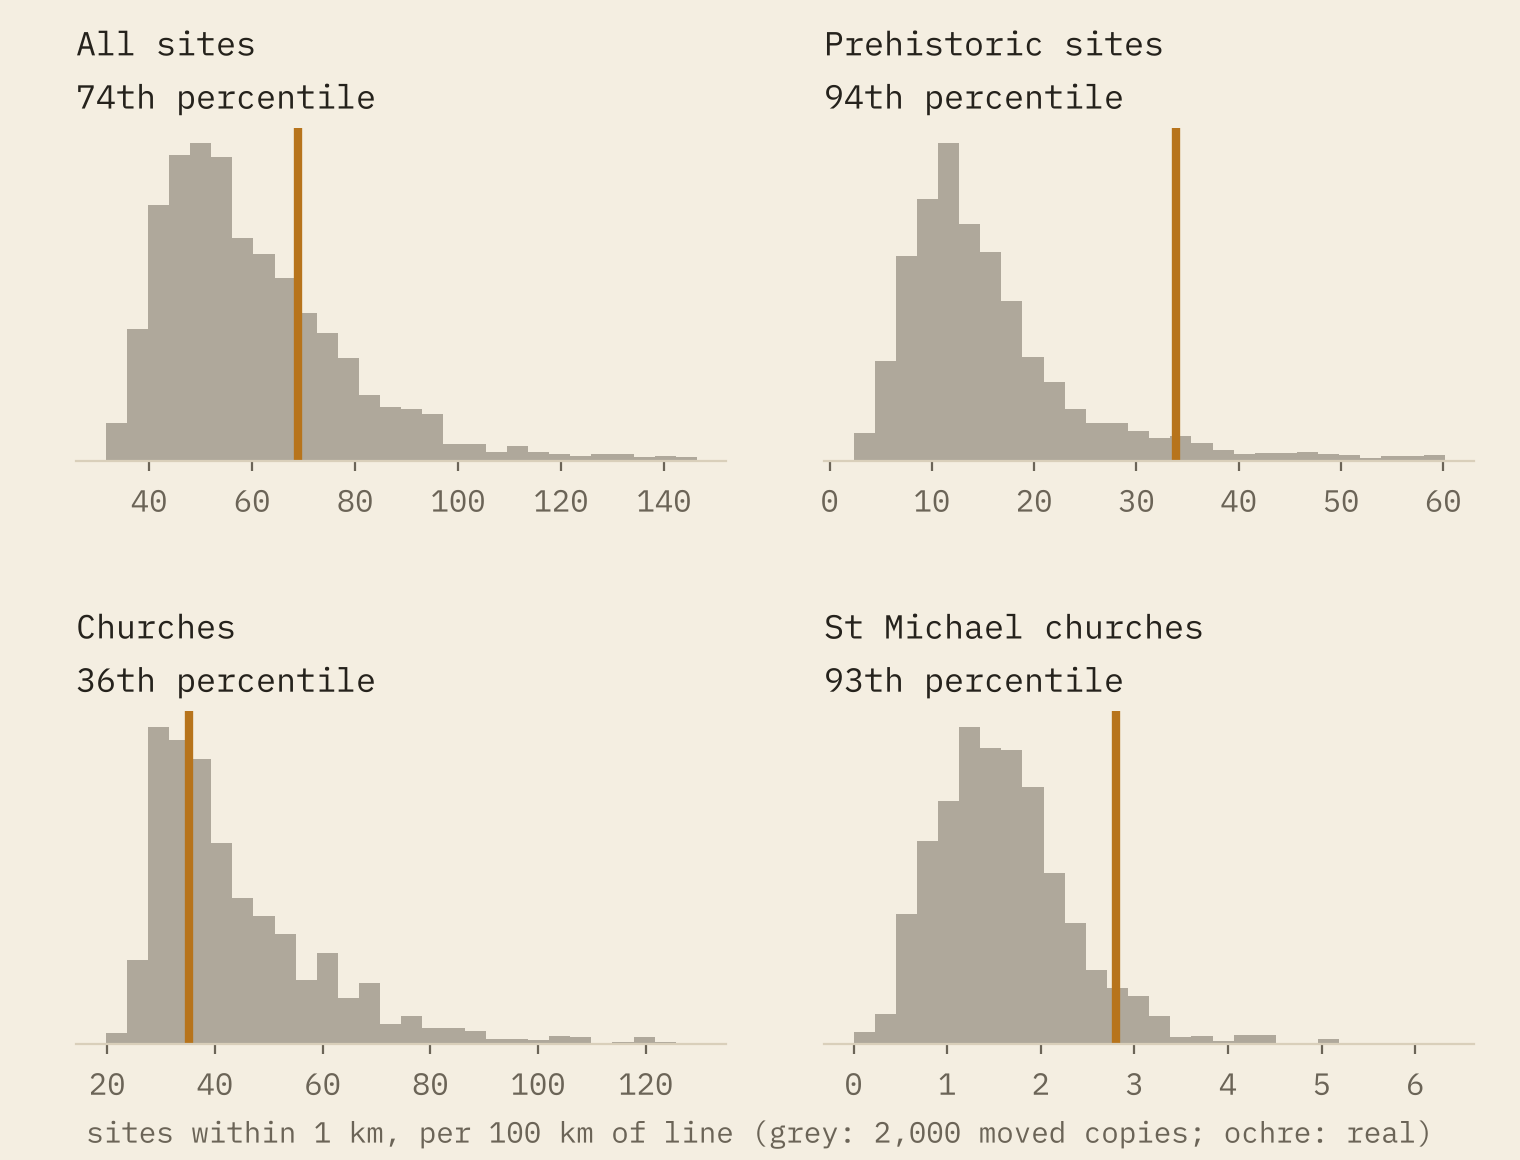
A good line, then, chosen by someone who knew where the archangel’s hilltop churches are. Not an exceptional one.
What a ruler picks up
Finally, the simplest test. I dropped 1,000 random 20 km lines on Britain. On average each passed within 50 m of 0.38 of my sites, and 2.1% passed three or more. On the Wiltshire chalk it was 21%. My list is strict, six kinds of site and a 50 m tolerance; Watkins also used moats, mounds, beacons and castles, and a pencil line on a one-inch map is about 63 m wide.
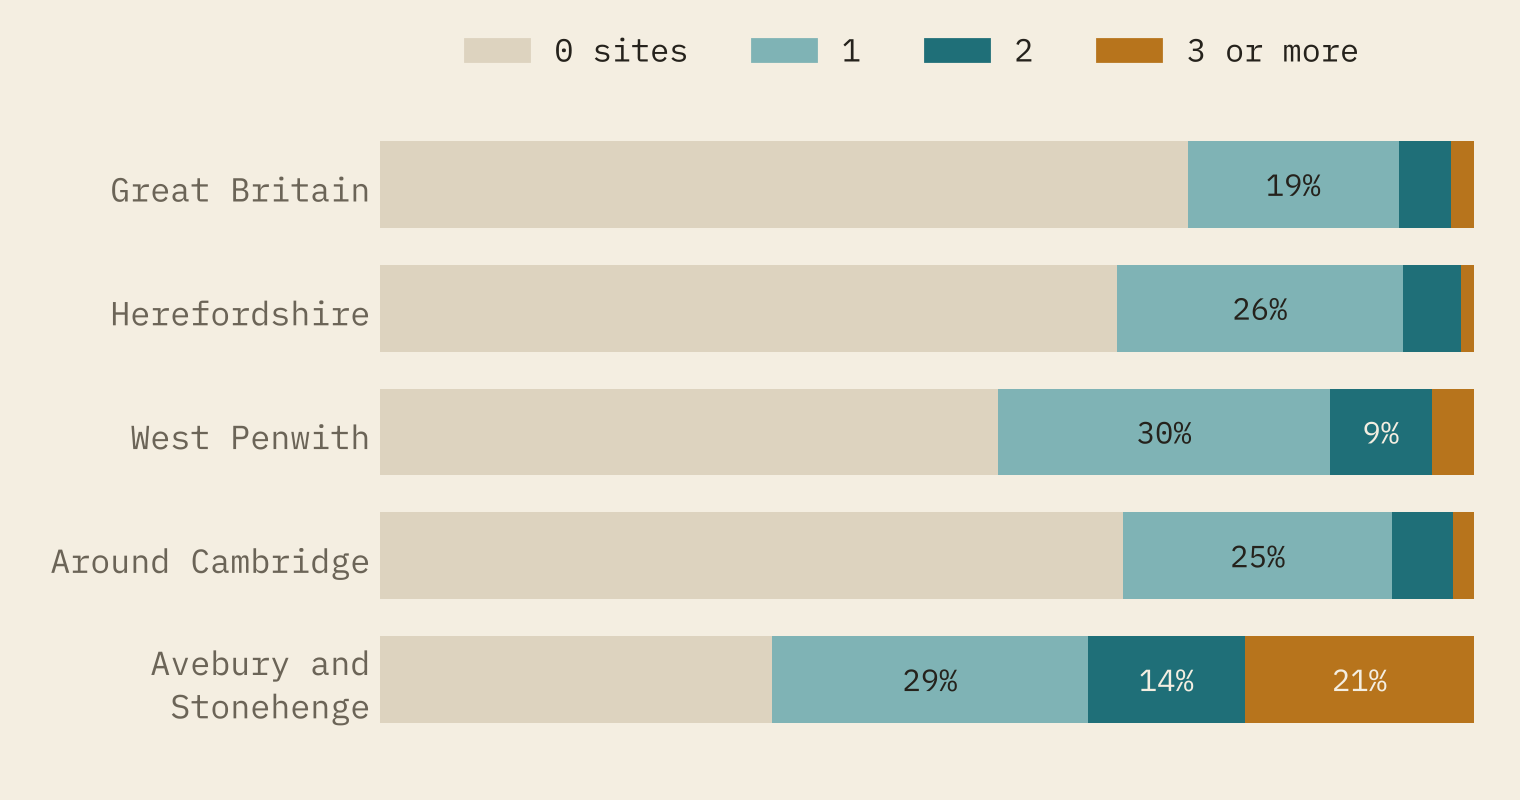
None of this says straight lines meant nothing in prehistory. Stone rows, cursuses and avenues are straight on purpose. But a ley is a long line on a map between sites thousands of years apart, and Britain has so many old sites that such lines are what you should expect. Watkins looked hard at his landscape and saw a real pattern. It was the pattern of a crowded landscape.
How I did this
Sites within 50 m of each other were merged, and sites within 250 m grouped into places, so a barrow cemetery or a town centre counts once. All distances are on the British National Grid. Each test compares the real count with 300 random versions: even scatter over the same land, the real places nudged up to 1 km, and for prehistoric or church places, the same number drawn from all real places. For even scatter I also derived the expected count directly, and it matches the simulations. I chose the Saint Michael’s line’s course myself (the Mount to the Tor, extended), because writers describe it differently, and I read Piper’s 1882 “camp” on Hatterall Hill as Pen Twyn hillfort. The churches are of all dates; coverage in open data is uneven, and some famous sites, including Arthur’s Stone in Herefordshire, are missing (I placed that one from Wikipedia).
Notes and sources
- Churches: Wikidata (CC0). Barrows, megaliths, stone circles and holy wells: OpenStreetMap contributors (ODbL 1.0) and Wikidata, as cleaned in my earlier projects Barrows of Europe, Megalith Highway, Same Shape, Different Millennia and Holy Wells.
- Hillforts: Lock, G. and Ralston, I. 2017, Atlas of Hillforts of Britain and Ireland (CC BY-SA 4.0), via Mike Middleton’s Hillforts Primer.
- Named places: Ordnance Survey OS Open Names (OGL v3, contains OS data © Crown copyright and database right 2026), Wikidata, and the Wikipedia article on Arthur’s Stone, Herefordshire.
- History: English Wikipedia, Ley line, The Old Straight Track and Saint Michael’s line (CC BY-SA 4.0).
- Broadbent, S. 1980, Simulating the Ley Hunter, Journal of the Royal Statistical Society, Series A. Williamson, T. and Bellamy, L. 1983, Ley Lines in Question.
- Paper, data and code: Zenodo and GitHub.
- I wrote the text, with drafting and editing assistance from Claude (Anthropic), which also helped prepare the analysis code. I reviewed and checked all text and results.

