
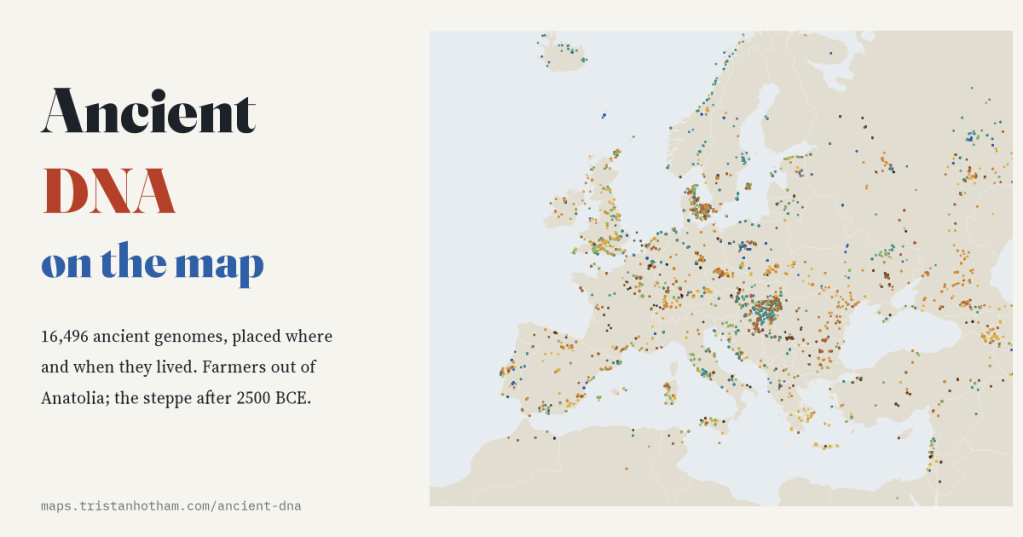
Labs have now read the DNA of 16,496 people who lived between the last Ice Age and the industrial age. I put every one of them on a map, at the place and time they lived, and pressed play.
In 2010 scientists published the first complete genome of an ancient human, a man who lived in Greenland about four thousand years ago. Sixteen years later the field has exploded. The Allen Ancient DNA Resource, curated by Swapan Mallick, David Reich and colleagues at Harvard, gathers every published ancient genome into one free file. Its release v66.p1 describes 17,629 ancient individuals, and 16,496 of them pass its quality checks. Each comes with a date, a burial place, an archaeological label and, where the DNA allows, the branches of the family tree that their father’s and mother’s lines belong to.
Put them all on one map and the first thing you notice is not prehistory. It is the scientists.
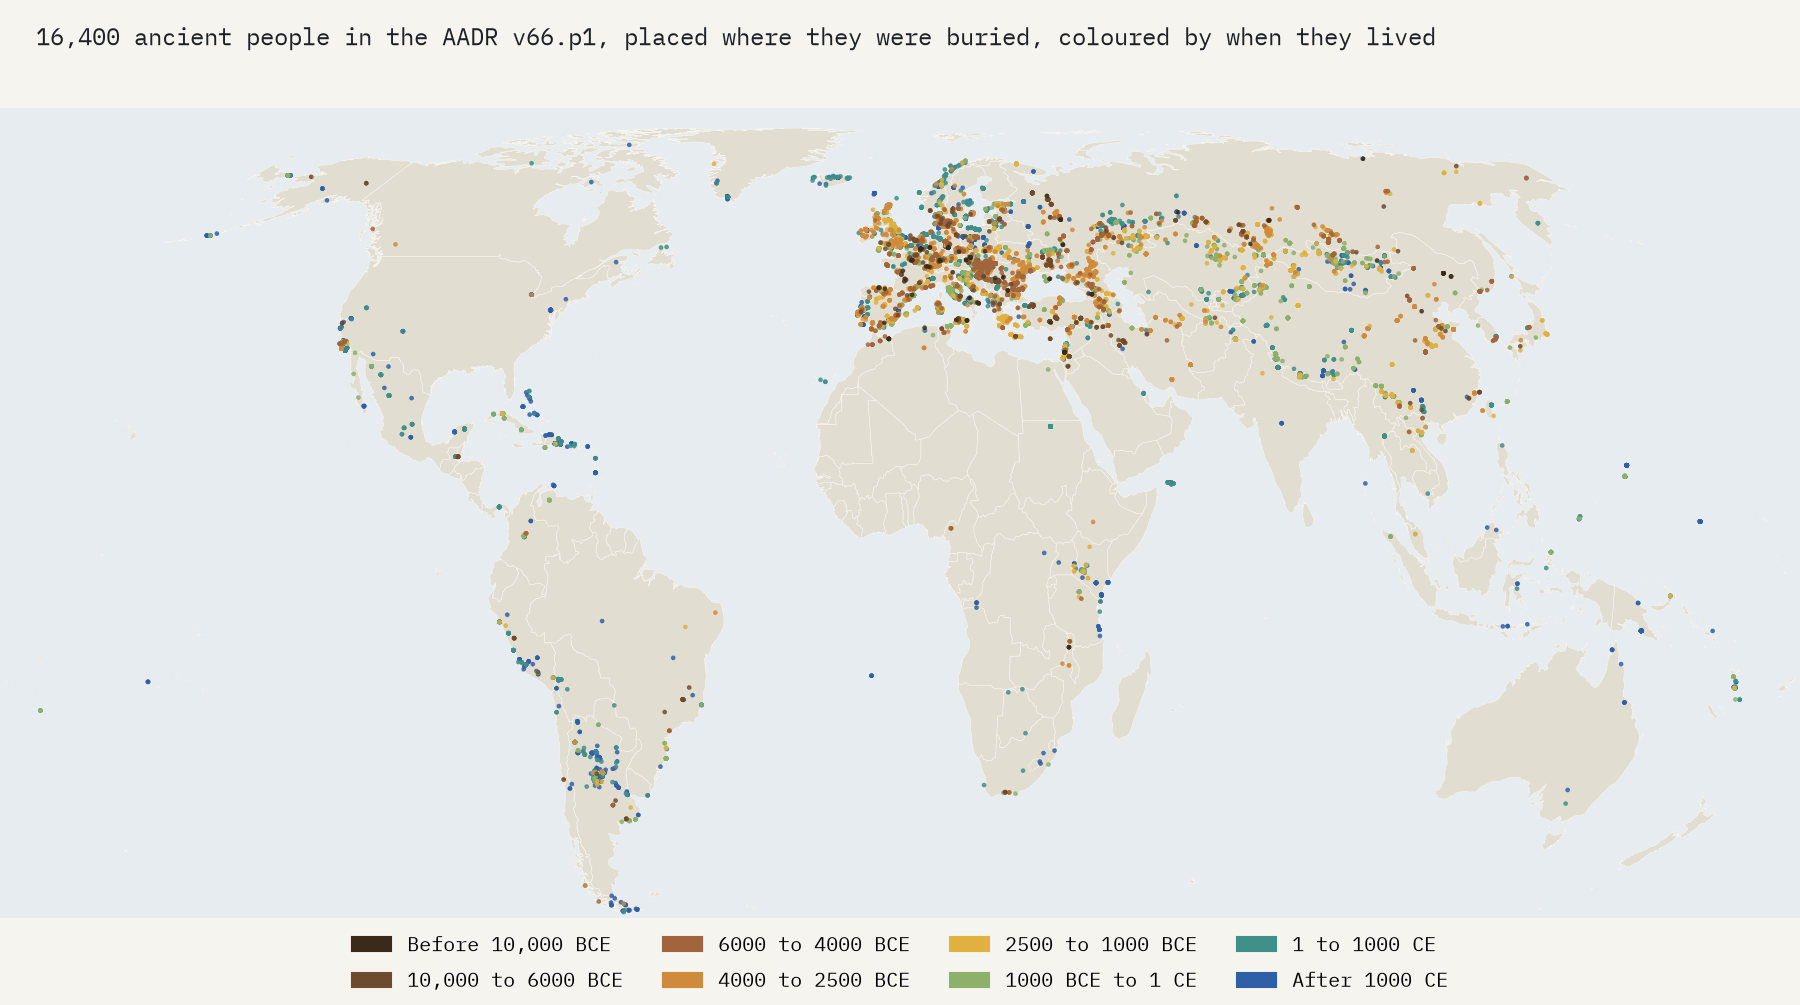
A map of where geneticists have looked
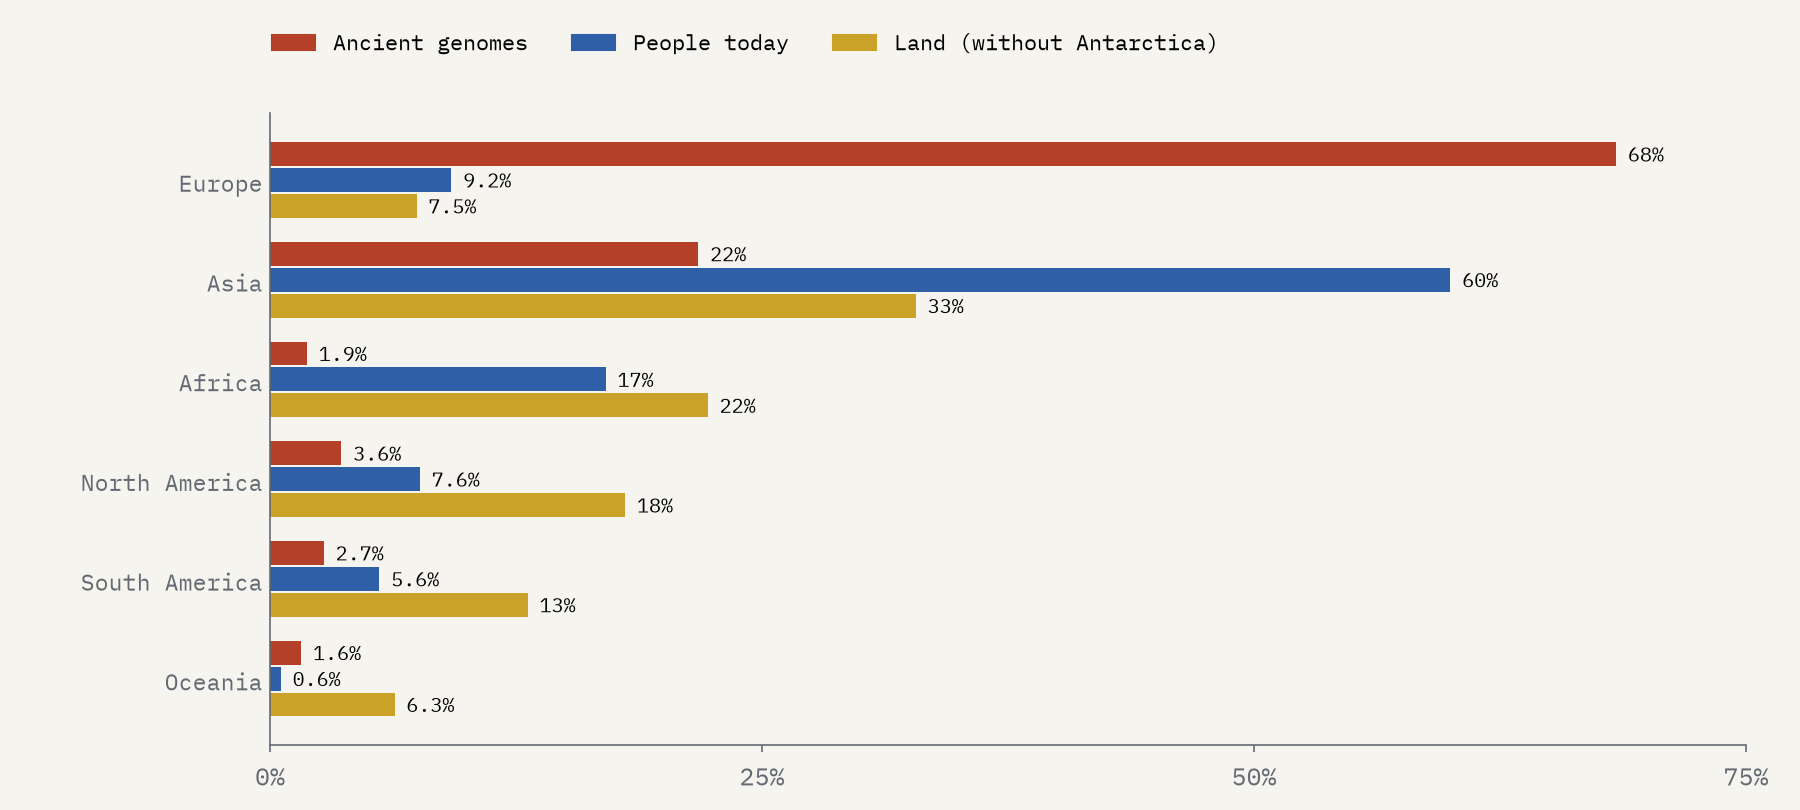
68% of the people on the map were buried in Europe, a continent with 9% of the world’s people and 7% of its land. Africa, where our species began, supplies 1.9%, for 17% of the world’s people. Per head of today’s population, Europe has about 66 times as many ancient genomes as Africa. Some of that is chemistry, since DNA survives best in cold ground. Much of it is money, laboratories and a long tradition of digging. The countries with the most people in the archive are Russia (1,394), Hungary (1,317) and the United Kingdom (1,151).
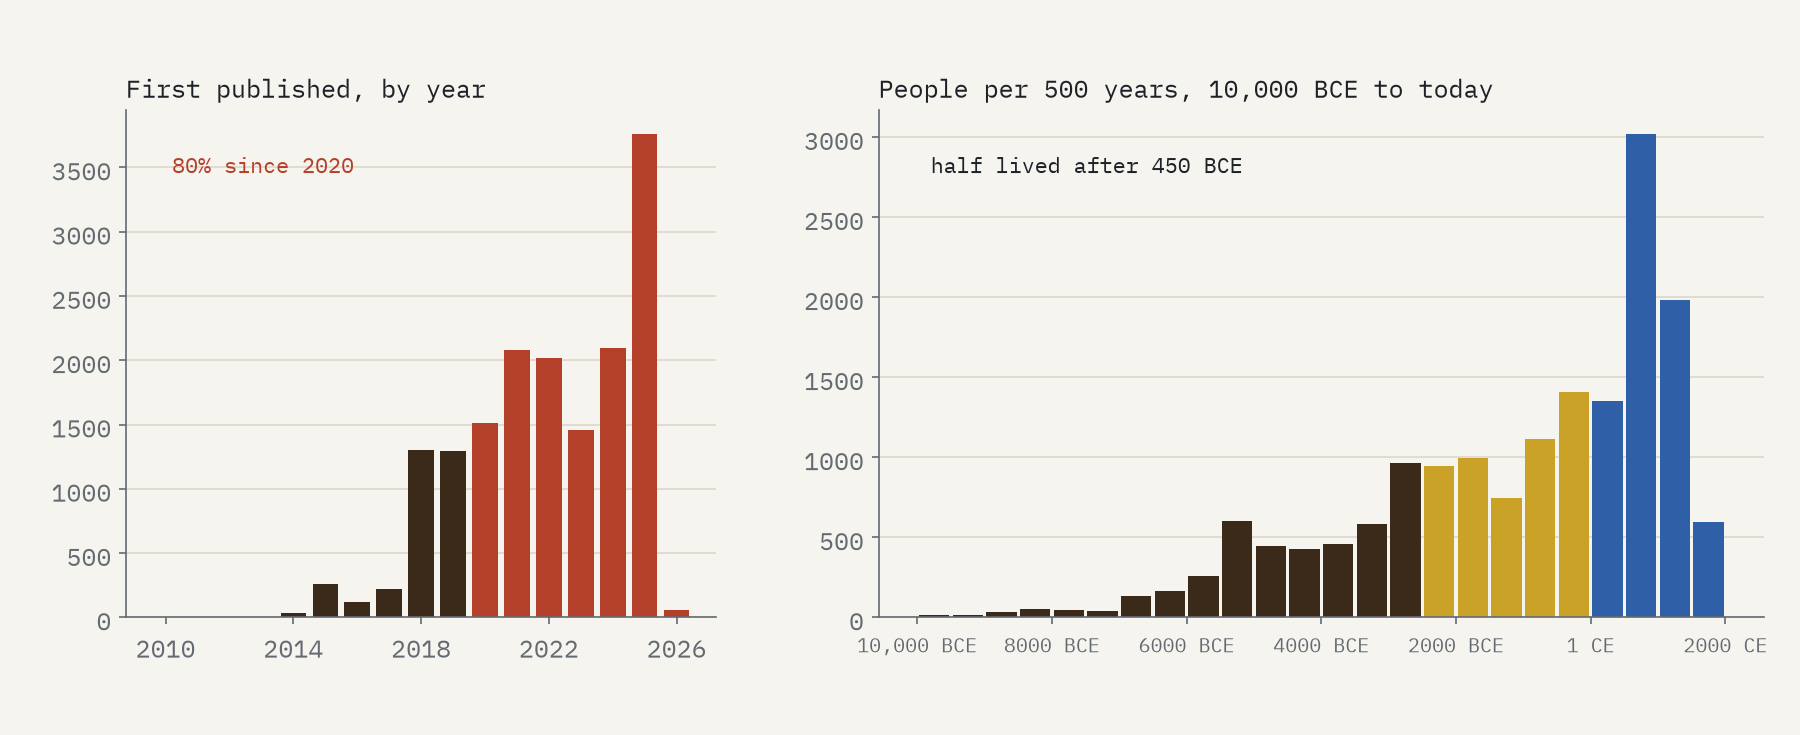
The archive is also young, in two senses. 80% of these genomes were first published in 2020 or later, and 3,757 in 2025 alone. And most of the people in it lived recently: half lived after 450 BCE. The oldest modern humans, from the cave of Ranis in Germany and from Zlatý kůň in Czechia, are dated to around 43,925 BCE, but only 102 people in the whole archive lived before 10,000 BCE.
The first farmers
Press play on the map and the first big movement is farming. The earliest people the archive labels Neolithic are in Turkey, from 8750 BCE. Country by country, the first Neolithic burials get later the further they are from Anatolia: Greece 6366 BCE, Hungary 5990 BCE, France 5413 BCE, Britain 3981 BCE, Ireland 3796 BCE. Across 24 countries, the date of the first sampled Neolithic burial falls about 0.88 years later for every kilometre from Çatalhöyük in central Anatolia. That is a farming frontier moving at about 1.1 km a year: slow enough that nobody alive would have noticed it, fast enough to cross a continent in a few thousand years.
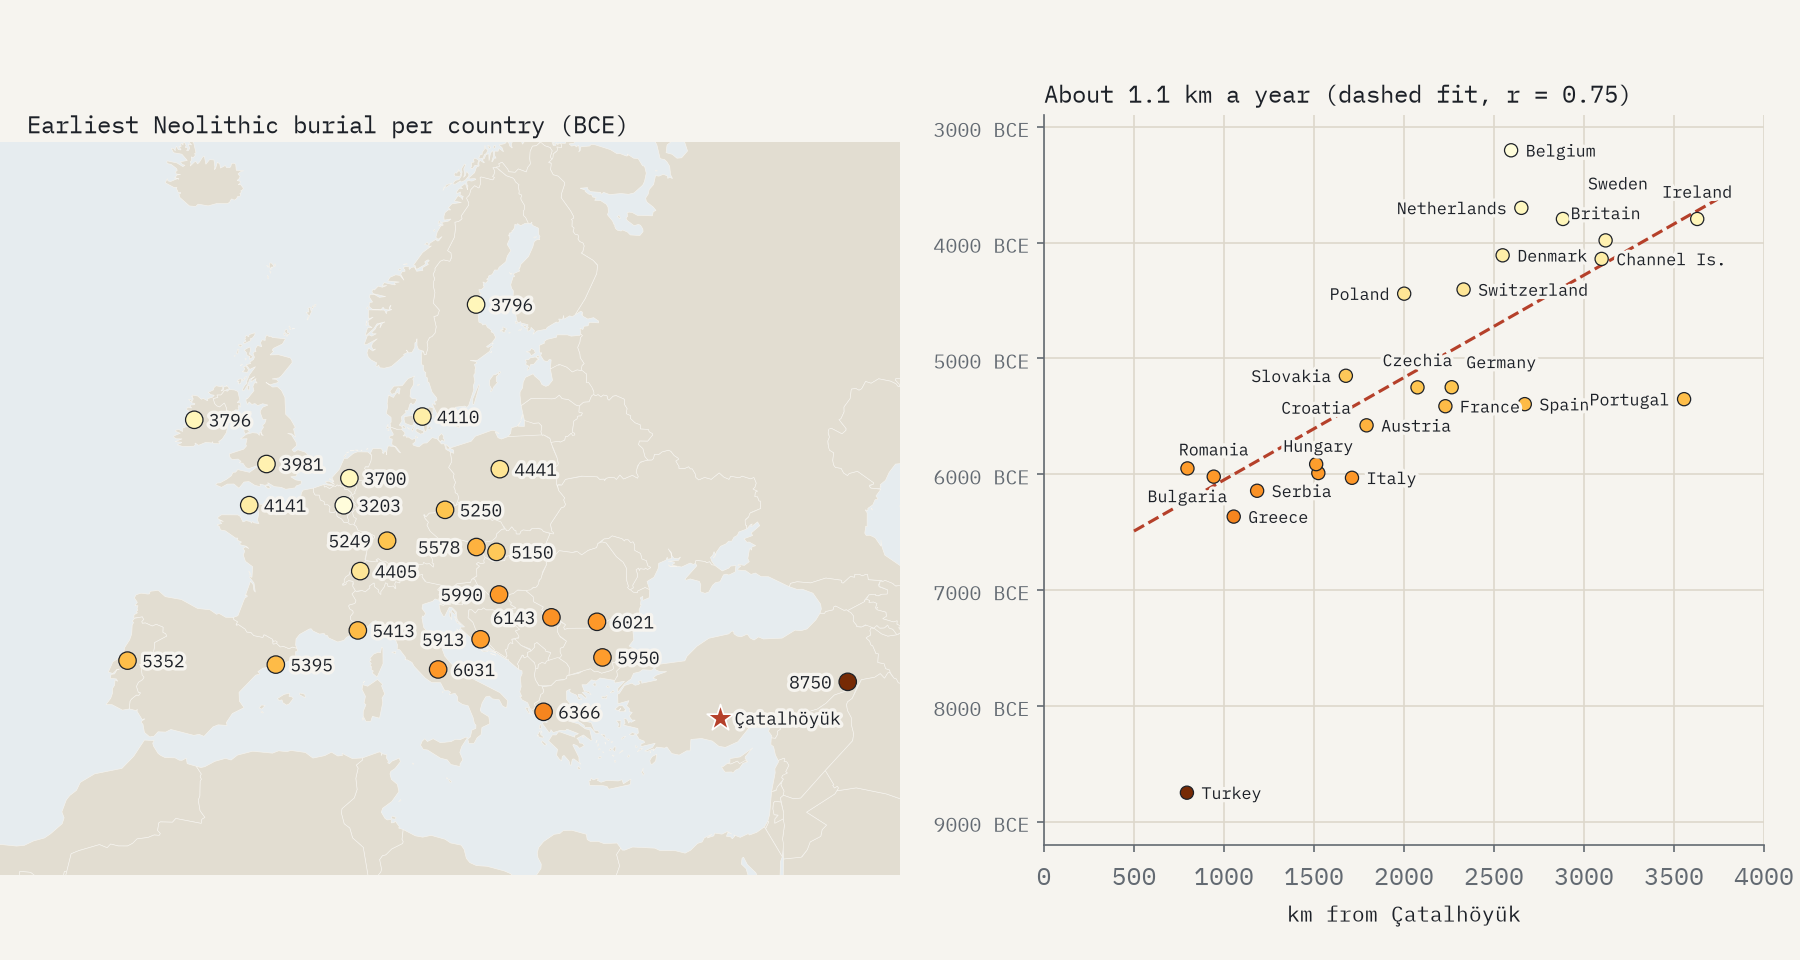
A caution: the earliest sampled burial is not the moment farming arrived, only the earliest one that has been dated and sequenced. And “Neolithic” is the archive’s label. In the Baltic, Russia and Ukraine it often marks hunter-gatherers who made pottery, so I left those countries out.
After 2500 BCE
Then something stranger happens. The Y chromosome passes from father to son almost unchanged, so its branches trace male lines. Colour the map by them and watch western Europe around 2500 BCE. Before then, men across the continent carry a mix of lines, mostly I2 and G2. Within a few centuries most carry R1b or R1a: in a box covering Europe, 8% of 761 men from 5000 to 3000 BCE, against 65% of 639 from 2500 to 1500 BCE.
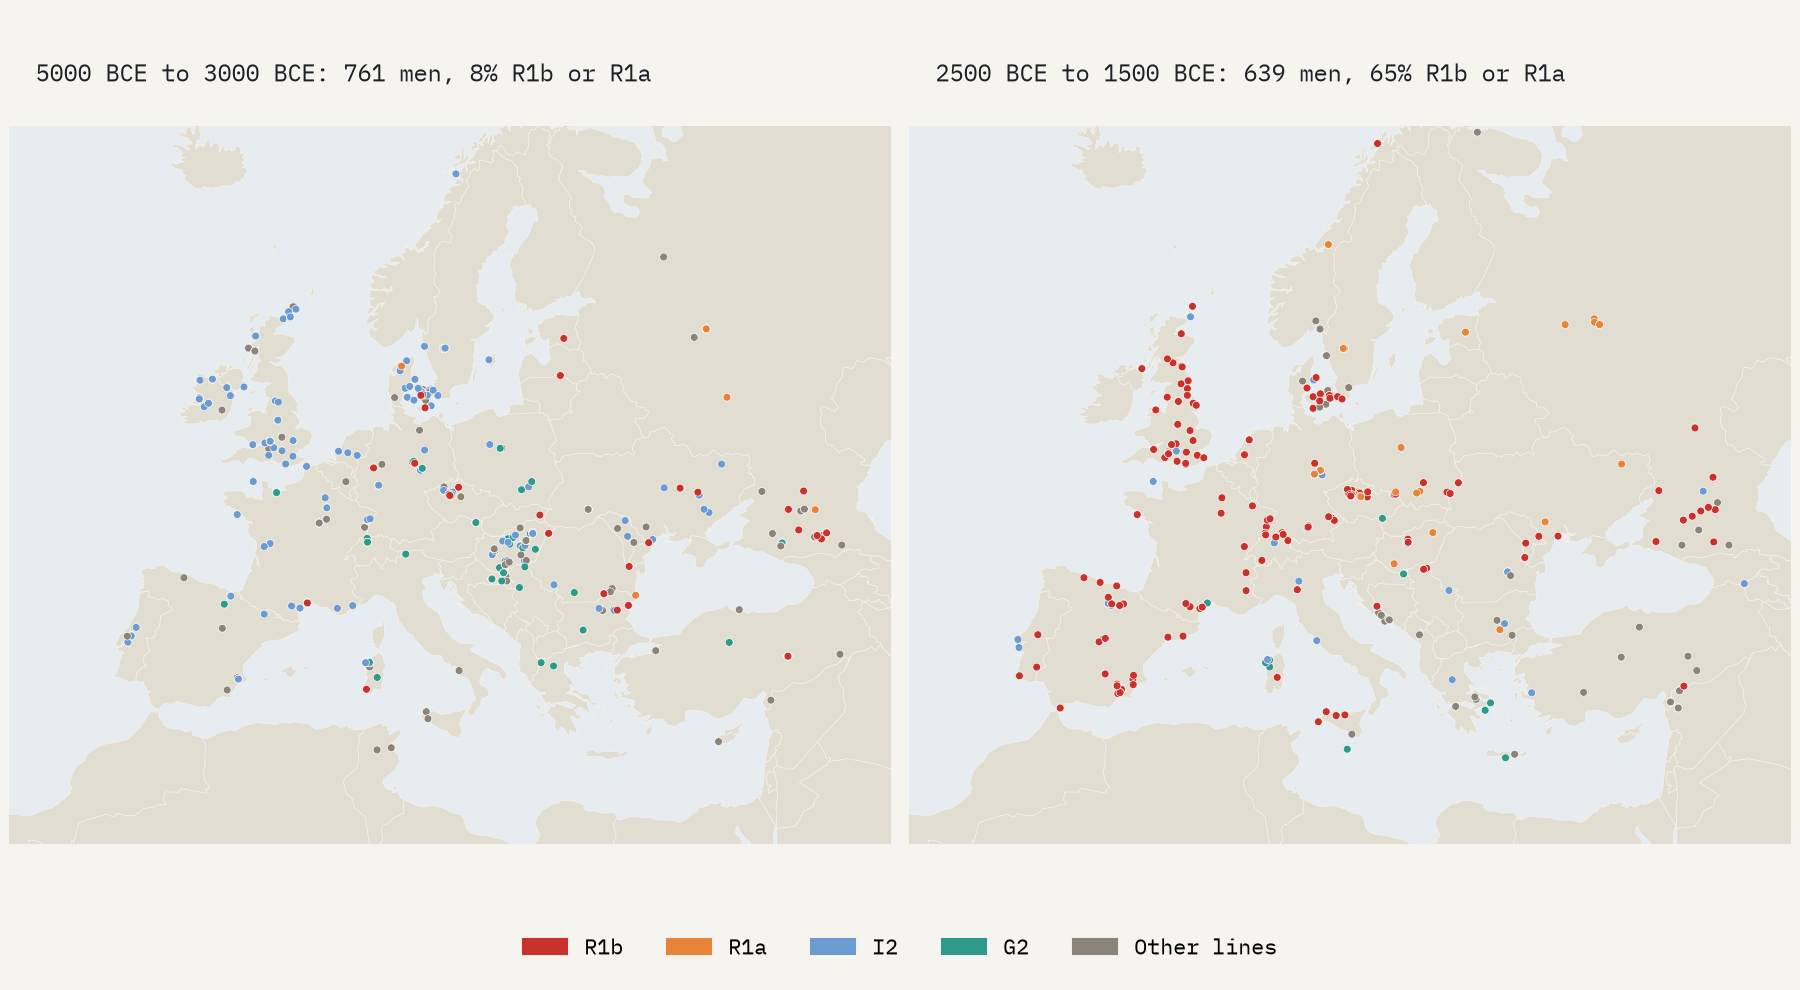
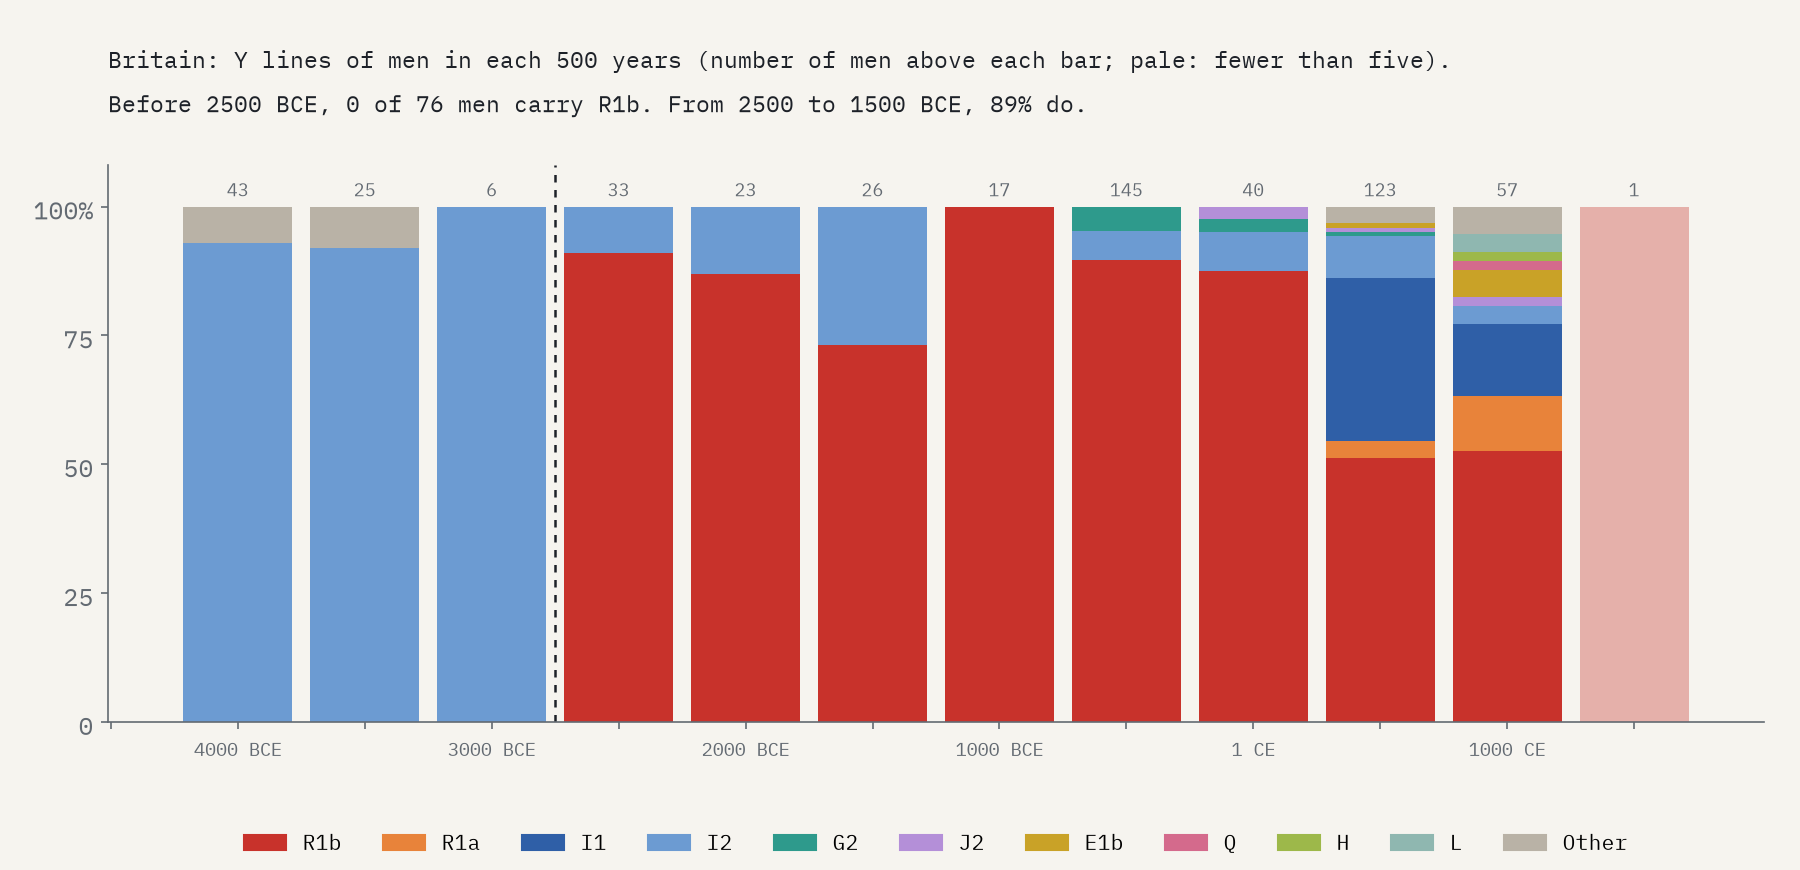
In the archive, men of the Yamnaya culture of the Pontic and Caspian steppe mostly carry R1b (79%), men of the Corded Ware culture carry R1a (50%) and R1b (41%), and men buried with Bell Beaker pots carry R1b (95%). Britain shows the turn most starkly. Of the 76 men in Britain before 2500 BCE whose Y line is known, not one carried R1b. Of the 56 from the next thousand years, 50 did.
In Britain, none of 76 men before 2500 BCE carried R1b. In the thousand years after, 89% did.
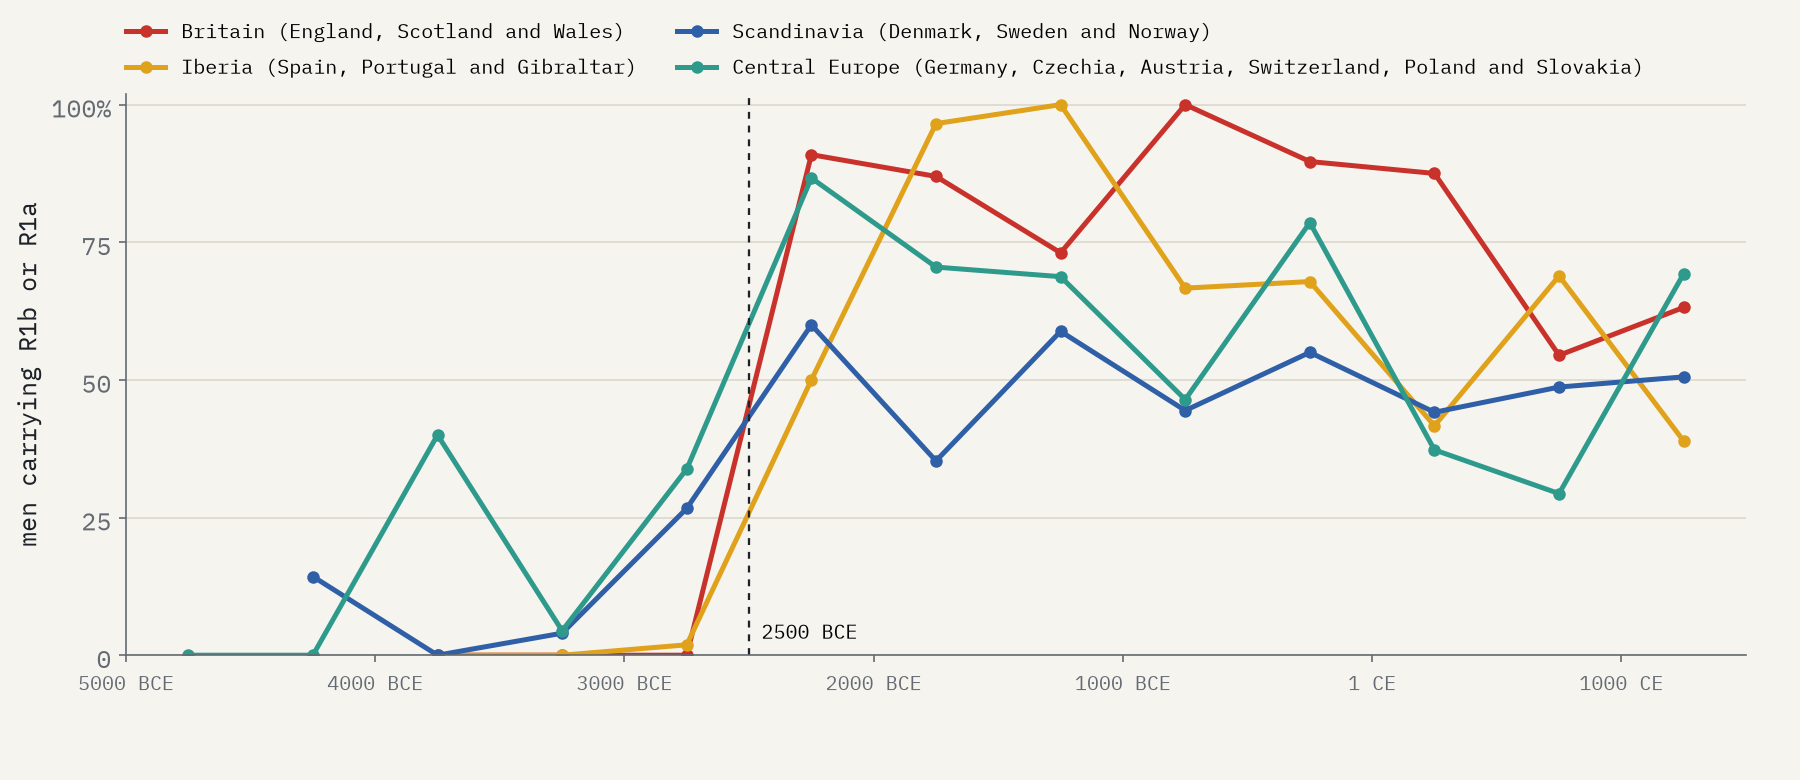
The same turn happens in Iberia, central Europe and Scandinavia, all in the same few centuries. In each, the first 500 years in which at least half of men carry R1b or R1a is 2500 to 2000 BCE.
One important caveat. A Y haplogroup is one line of descent out of thousands; it is a proxy for ancestry, not ancestry itself. A change in Y lines can happen because some men had more sons than others, without a whole population being replaced, and R1b is an old branch with some earlier forms too. The genetic studies behind the archive measure whole-genome ancestry to tell how much changed. Here I only count branches.
Famous faces
Some of the people on the map are famous. Ötzi the Iceman, found in an Alpine glacier in 1991, is there under the ID “Iceman”, dated 3371-3103 calBCE (4550±27 BP; ETH-8345.1-2); his Y line, G2a2a1a2a1a1, sits in G2, the commonest branch among Neolithic men in Anatolia in the archive. Ust’-Ishim man, from Siberia, lived around 42,416 BCE. Not everyone famous passes the checks: Kennewick Man and the Anzick child are in the archive but graded “Questionable”, so they are only on the map if you switch on the layer for people who did not pass. The single most sampled place is an Avar period cemetery at Mödling, near Vienna, with 447 people.
The interactive map lets you scrub through time, colour people by period, culture, father’s line or mother’s line, search for a person, group or site, and click any dot for the details and the paper that published it. The data and code are open, and the archive itself is free for anyone to use.
Data: Allen Ancient DNA Resource (AADR) v66.p1, Mallick, S. et al., Harvard Dataverse, doi:10.7910/DVN/FFIDCW (CC0 1.0); described in Mallick et al. (2024), Scientific Data, doi:10.1038/s41597-024-03031-7. Population and outlines: Natural Earth. Paper: https://doi.org/10.5281/zenodo.23872993. I wrote the text, with drafting and editing assistance from Claude (Anthropic), which also helped prepare the analysis code. I reviewed and checked all text and results.

