
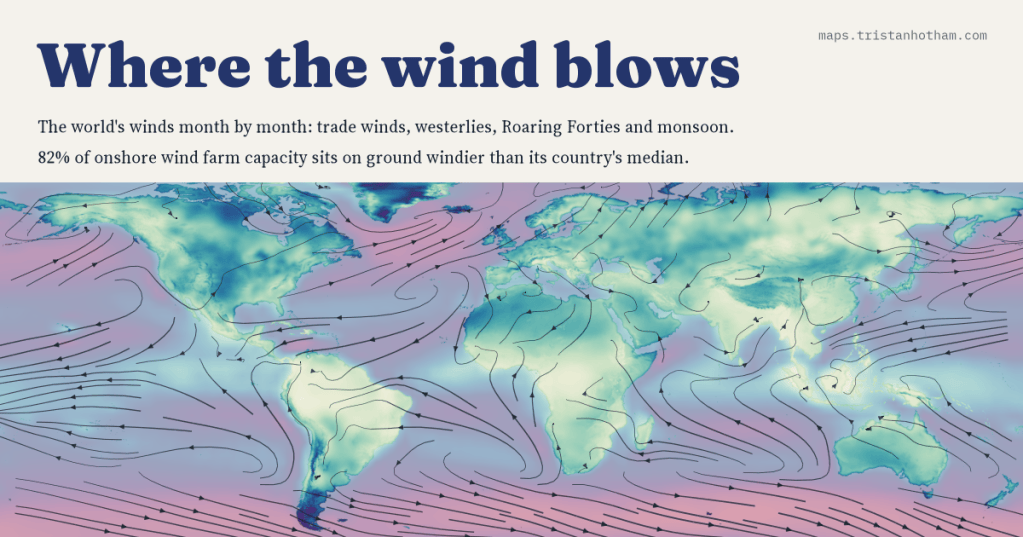
I mapped the world’s winds month by month: the trade winds, the westerlies, the Roaring Forties and the monsoon that turns around every year. Then I asked whether the world’s wind farms actually stand where the wind blows. Mostly they do: 82% of onshore wind farm capacity sits on ground windier than its country’s median.
Anyone who lives in Britain gets to know the wind. It comes, more often than not, from the south-west, wet from the Atlantic, and it is strongest in winter. But I had never seen the whole pattern it belongs to, so I drew it. Over land I used WorldClim, a set of monthly climate maps built from weather stations, which gives the average wind 10 m above the ground for every 9 km square. For the oceans and for the direction of the wind I used the NCEP/NCAR reanalysis, a weather model fed with three decades of observations.
Belts around the world
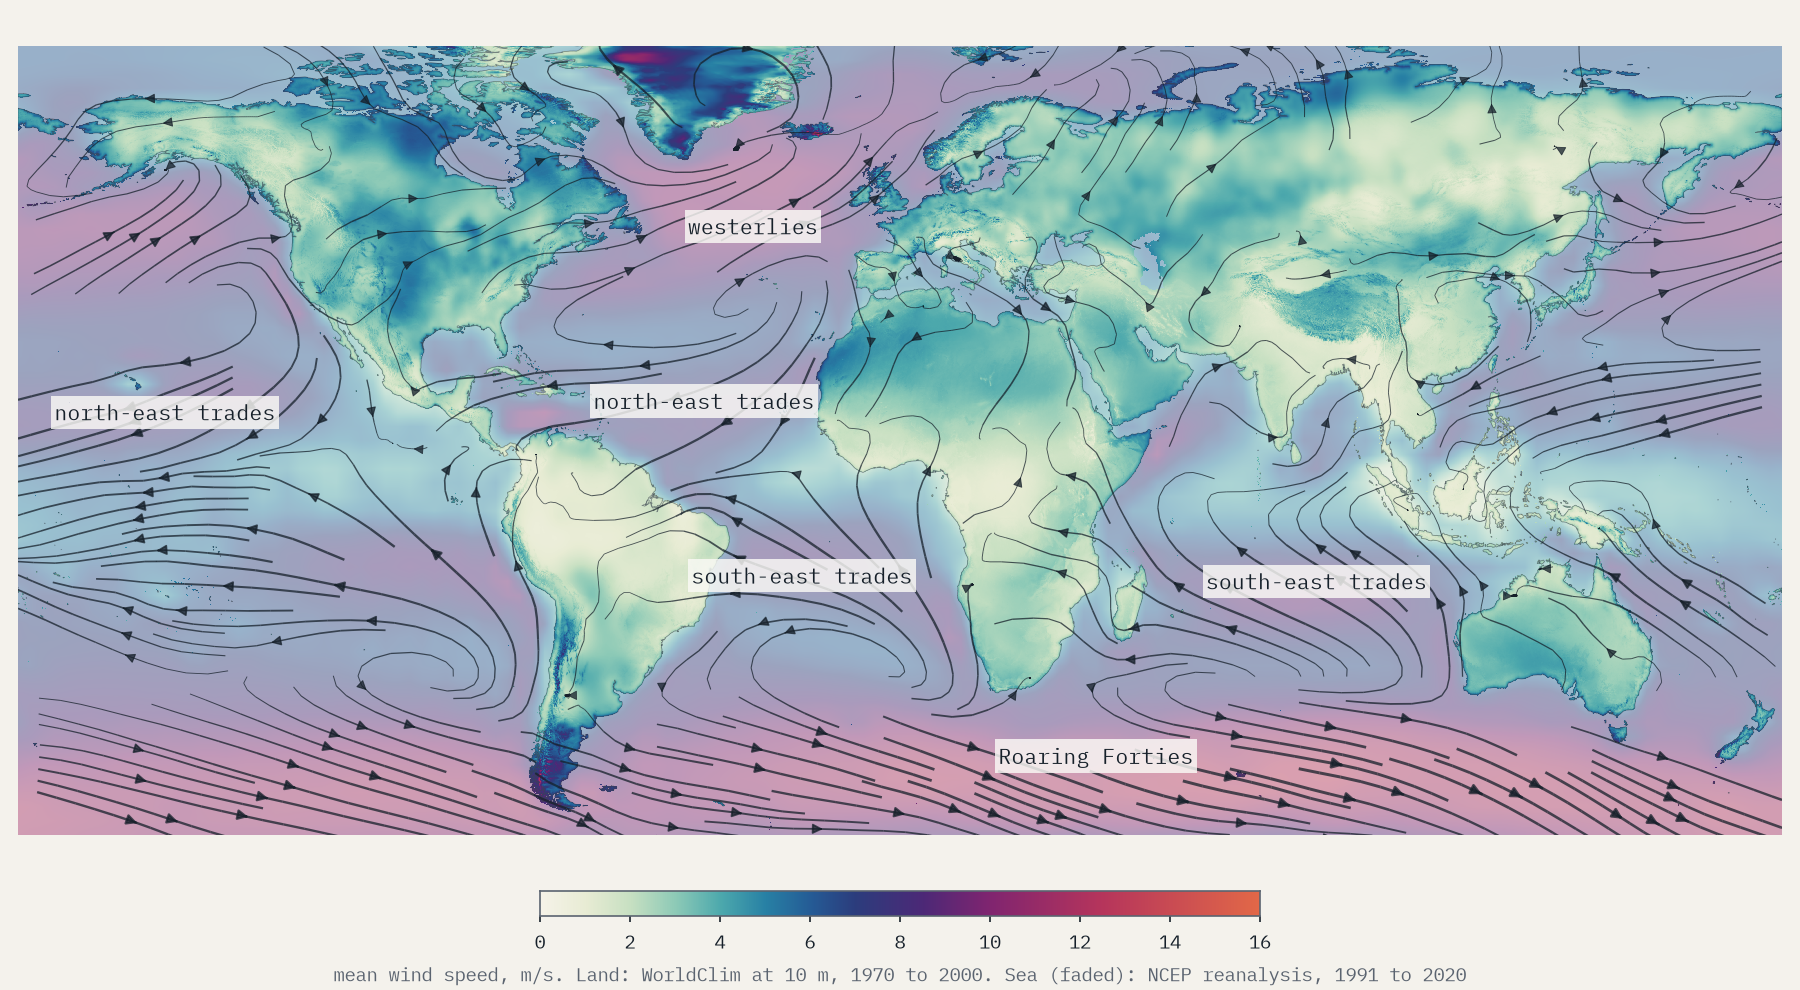
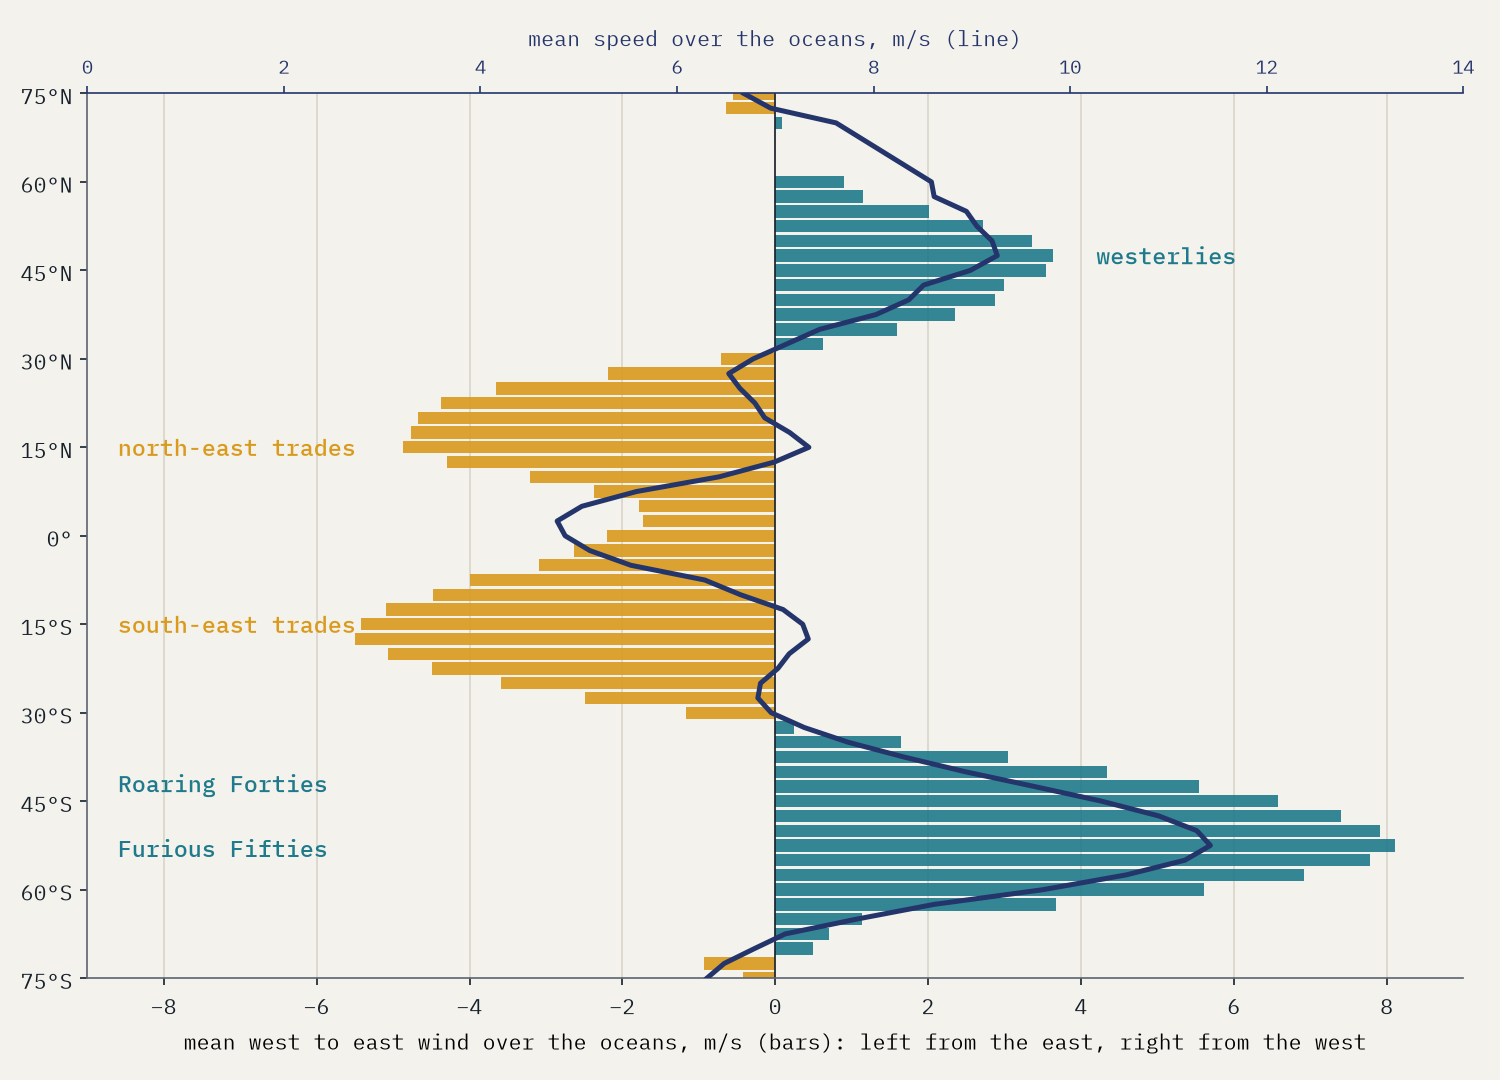
Seen from far enough away, the winds are a set of belts. Either side of the equator the trade winds blow towards it and to the west, from the north-east in the northern hemisphere and the south-east in the southern, at around 6.7 to 7.0 m/s over the oceans. They are astonishingly steady. If the wind always blew from exactly the same direction, its average as an arrow would equal its average speed; in the trades the arrow keeps 76% of it. In the northern westerlies, where storm after storm swings the wind round, it keeps 38%.
The strongest belt is in the far south. Between 40° and 50° S, the Roaring Forties, nothing but the tip of South America stands in the way of the westerlies, and over the ocean they average 10.2 m/s, against 8.8 m/s at the same latitudes in the north. Further south, in the Furious Fifties, the band around 52.5° S averages 11.4 m/s. And the southern belt keeps going all year: in July the northern oceans at 40° to 50° N drop to 6.9 m/s while the Forties blow at 10.9.
The wind that turns around
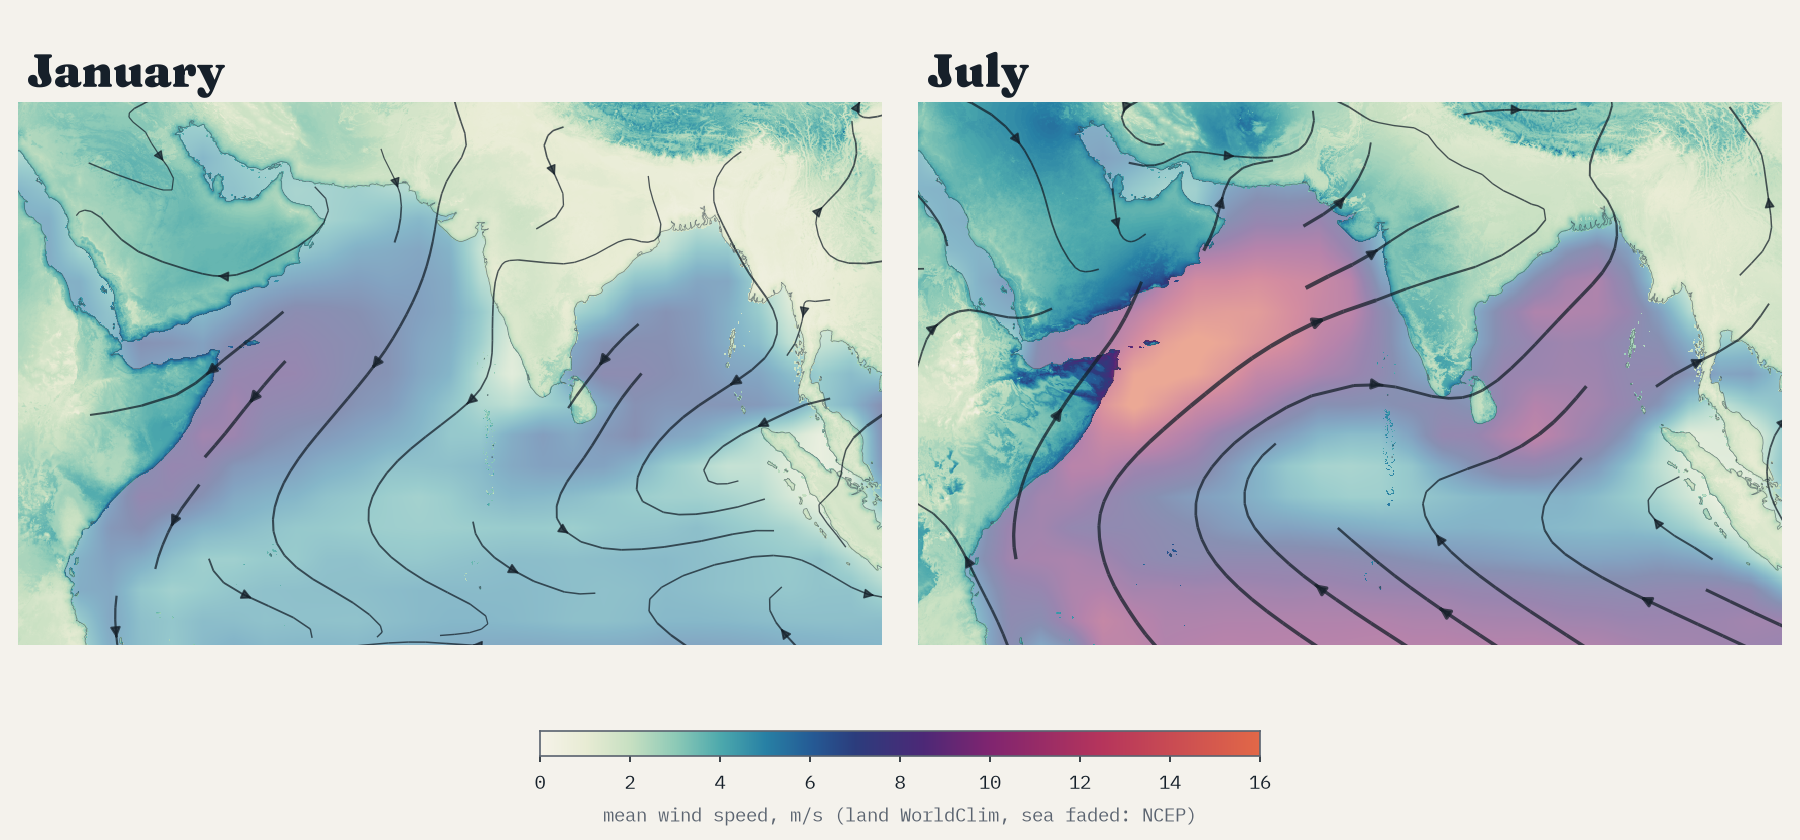
Over the Arabian Sea the wind changes sides with the seasons. In January it comes from the north-east at 6.3 m/s, dry air flowing off Asia. In July it comes from the south-west at 11.7 m/s, wet air drawn towards the hot land of India, and off the Horn of Africa it becomes a jet averaging 13.6 m/s. That is the monsoon. Counting every patch of sea and land where the January and July winds point at least 135° apart, 12% of the area between 60° N and 60° S turns its wind around between winter and summer.
Ice caps and islands
Over land the wind is far weaker, dragged back by hills, forests and towns. The average across the world’s land outside Antarctica is 2.9 m/s, and only 5% of it averages 5 m/s or more. The windiest square is on the Vatnajökull ice cap in Iceland, at 15.8 m/s, where cold air pours off the ice. After it come Jan Mayen, the Greenland ice sheet, the Patagonian ice fields and a scatter of islands in the Southern Ocean. These are also the places with the fewest weather stations, so they are the least certain numbers on the map.
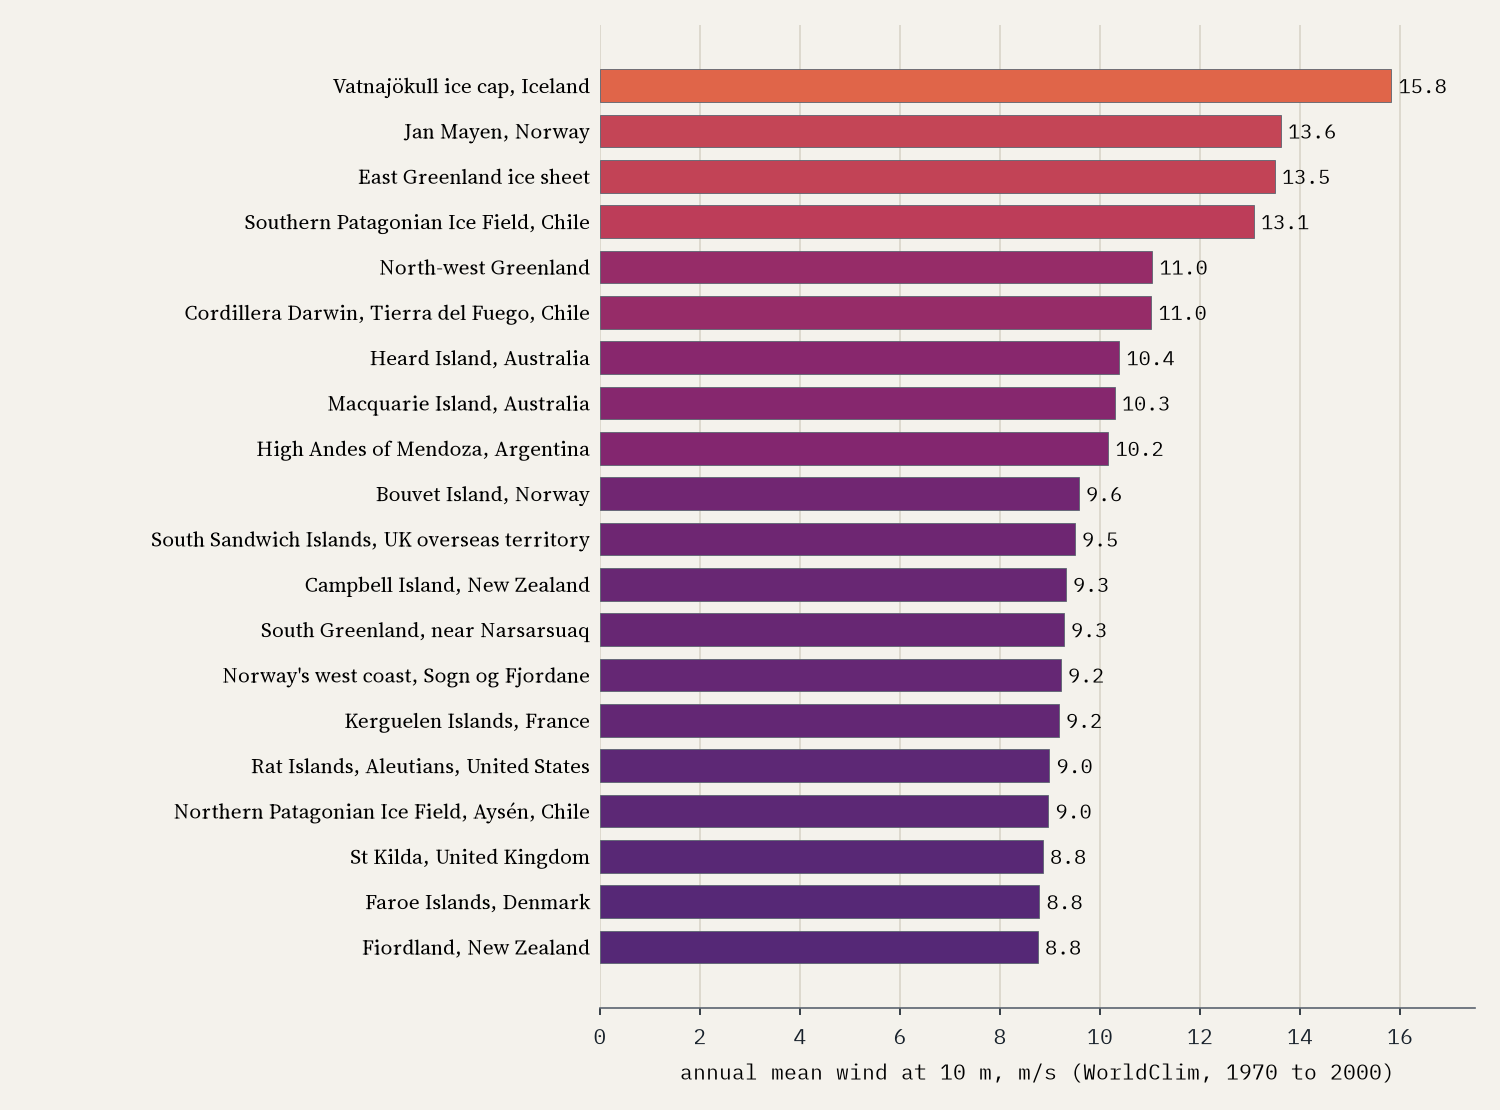
Among cities of a million or more, Marseille is the windiest (5.8 m/s), thanks to the mistral, followed by The Hague, Melbourne, Auckland and Adelaide. The calmest are in tropical highlands and sheltered valleys: Bogotá, Cali, Srinagar, Medellín and Mandalay, all under 1.0 m/s.
Spring, not winter
Here is the result that surprised me most. Averaged over all the land of the northern hemisphere, the windiest month is April and the calmest August. Across the northern land beyond the tropics, 57% has its windiest month in March, April or May. In spring the land warms fast while the sea and the Arctic stay cold, and that contrast drives the wind; in winter much of the northern interior lies under still, freezing air. The south has its own spring peak, in October.
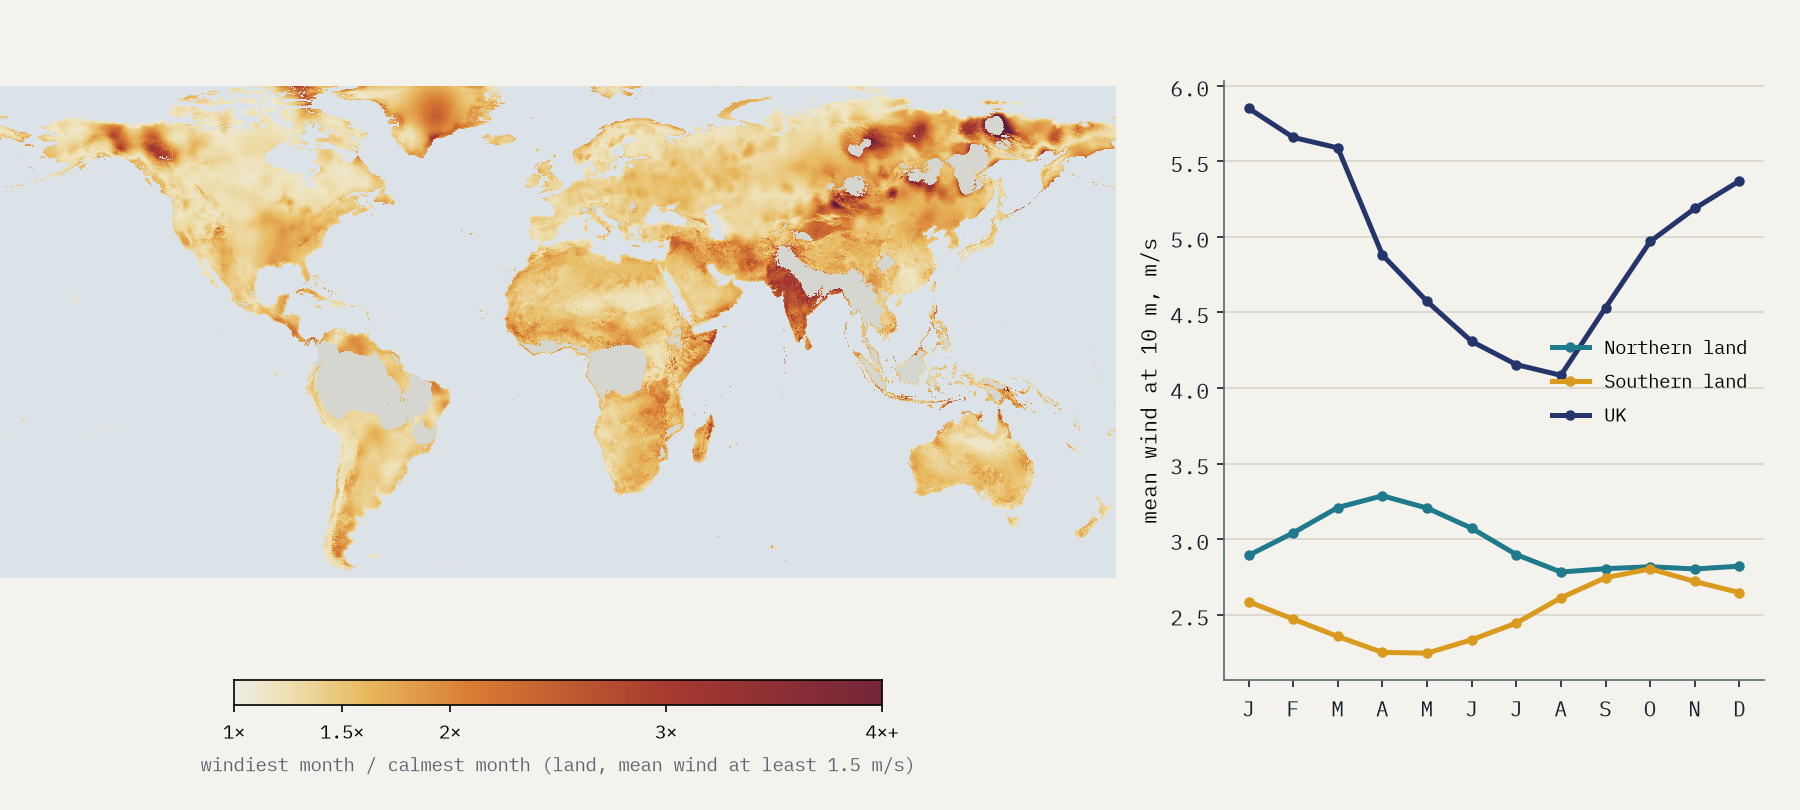
The most seasonal winds are in two kinds of place. In the interior of Siberia, Mongolia and the Yukon, winter air lies dead calm under great cold highs and the wind only wakes up in May. And on the monsoon coasts, Kutch and Odisha in India, the Maldives and the Chagos islands, the wind blows hard in the wet season and fades in the dry.
Are the wind farms in the windy places?
The World Resources Institute’s Global Power Plant Database lists 5,344 wind farms with 263 GW of capacity. It is a 2021 snapshot with patchy coverage: Germany and India, for instance, appear with only a small fraction of their real fleets. But for the farms it does list, I read the wind at each site and compared it with the rest of its country. Weighted by capacity, the average onshore farm stands on ground windier than 72% of its country’s land, and 82% of the capacity is on the windier half.
Mexico’s wind farms stand on ground windier than 98% of the country: almost all of them crowd into one windy gap in the mountains, the Isthmus of Tehuantepec.
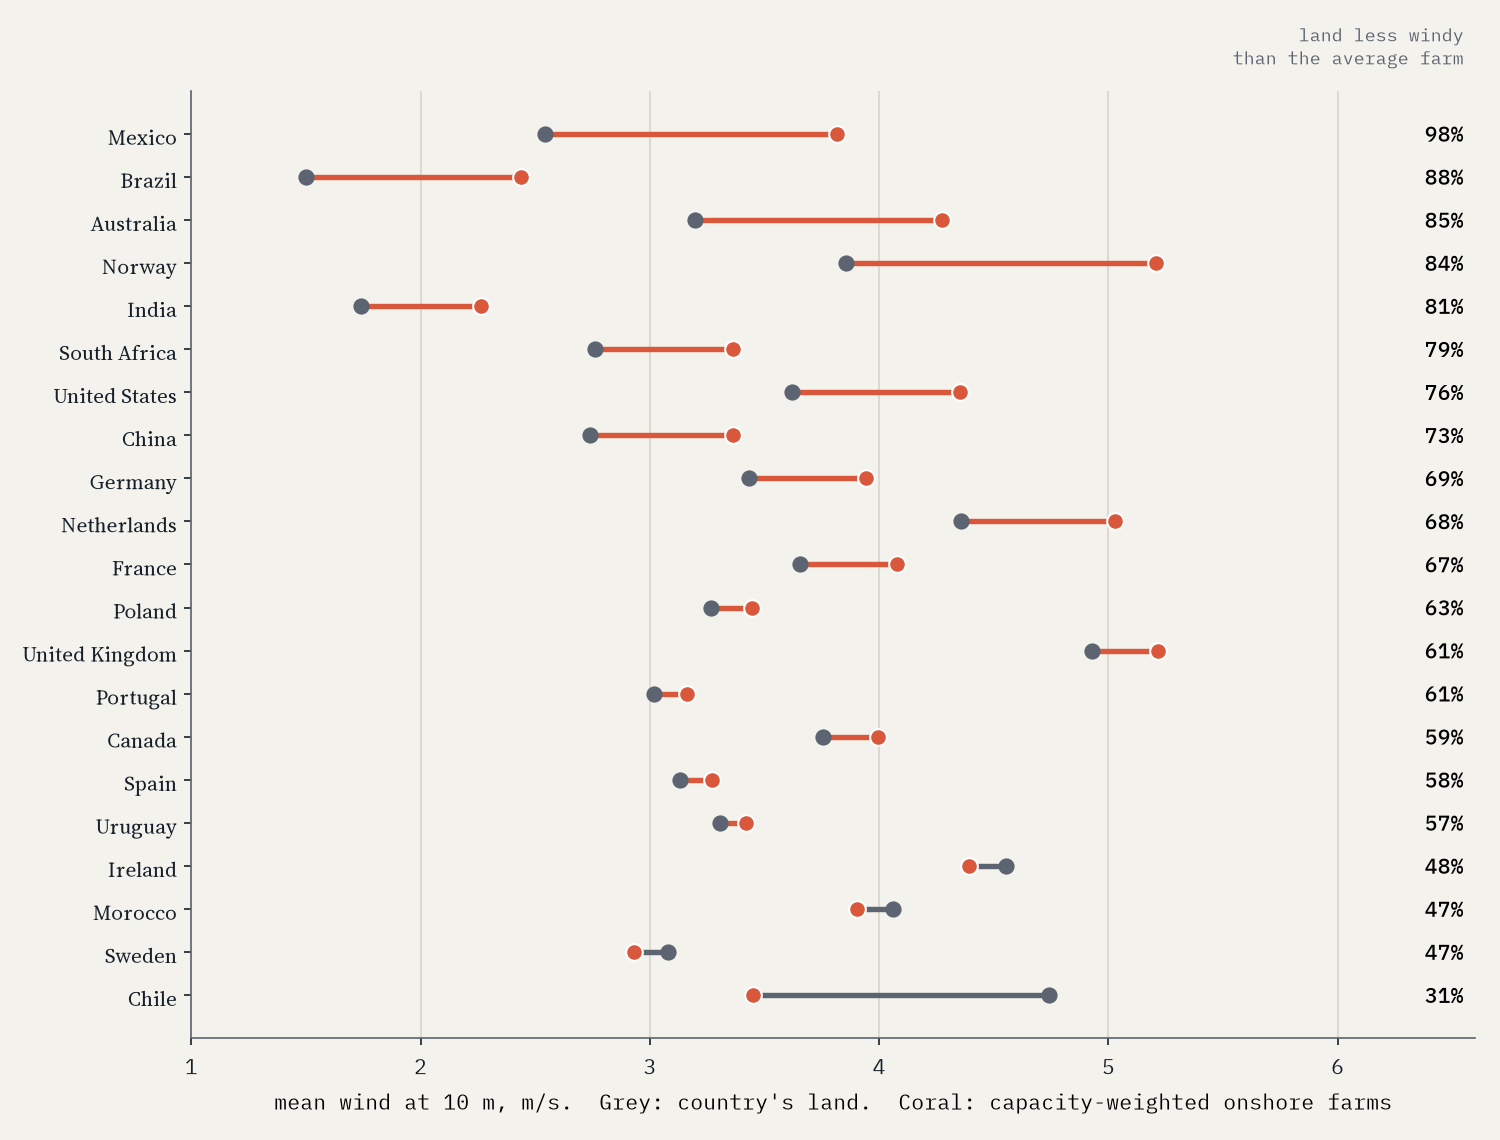
In 17 of the 21 countries with substantial listed capacity on land, the farms are windier than the land as a whole. Brazil’s line its windy north-east coast at 2.4 m/s, against 1.5 for the country. The exceptions make sense too. Chile’s farms are in the north and centre, near people and the grid, while its windiest land is in empty Patagonia. In the UK the farms are only a little windier than the land, partly because Britain’s windiest ground is islands and mountain tops, and partly because so much of its newest wind is at sea.
A windy corner of the world
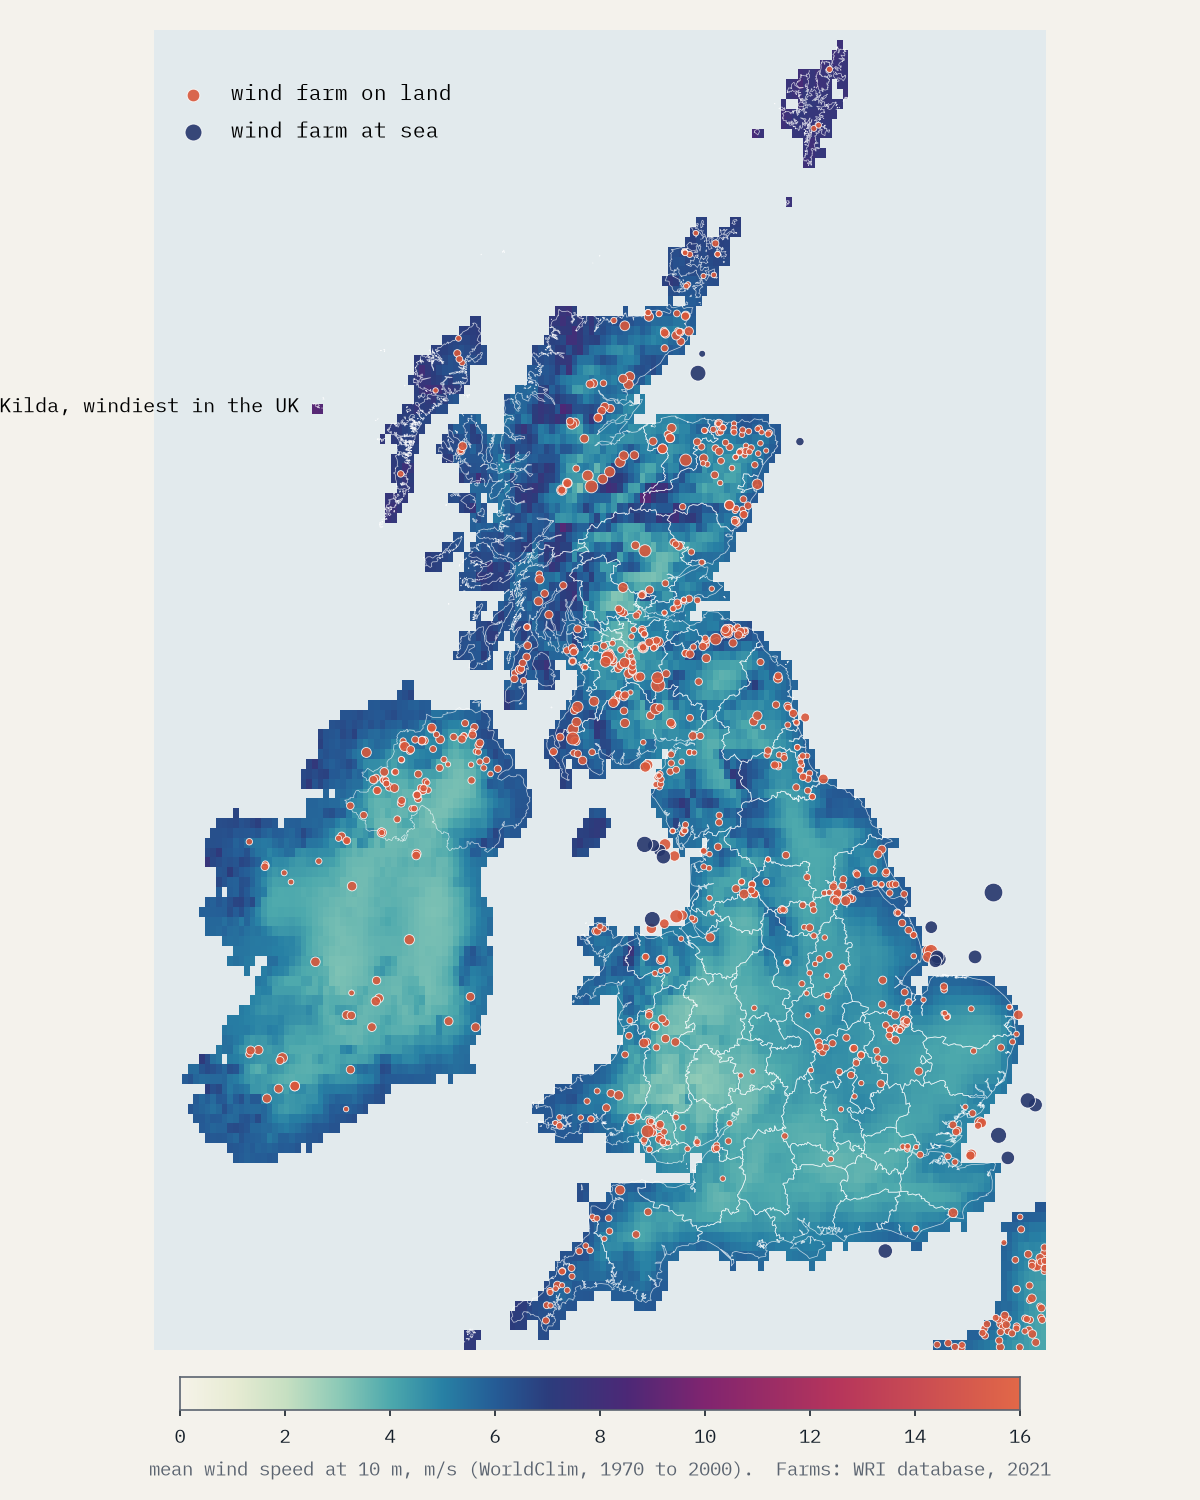
The UK’s land averages 4.9 m/s, 1.7 times the world’s; among countries bigger than 50,000 km², only Iceland, Greenland and Western Sahara are windier. Scotland is windiest (5.6 m/s), and the windiest counties are its islands: Shetland (7.6), the Western Isles and Orkney. England’s windiest is Cornwall (6.0); its calmest corner is the sheltered Welsh borders, with Herefordshire at 3.3. The single windiest square in the UK is St Kilda, at 8.9 m/s. Unlike most northern land, British wind is a winter wind: 5.9 m/s in January, 4.1 in August.
How I did this
Land winds are WorldClim 2.1’s monthly averages of wind speed 10 m above the ground for 1970 to 2000, in cells of 5 arc minutes (about 9 km). Ocean winds and directions are the NCEP/NCAR Reanalysis 1 long-term monthly means for 1991 to 2020, at the model’s lowest level, on a 2.5° grid. The reanalysis is higher up and coarser and reads windier than WorldClim, so I use it only for the sea and the flow lines and draw it faded. Wind farms are those with primary fuel “Wind” in WRI’s Global Power Plant Database v1.3. For each farm on land I took the wind in its 9 km cell and worked out what share of its country’s land is less windy.
The limits matter. The wind 10 m up is not the wind at a turbine hub 100 m up, and a 9 km square cannot see the ridge a farm stands on, so if anything the farms are windier than these numbers say. Averages hide the gusts and calm spells that matter for power. WorldClim is least certain where stations are few, which is exactly where the windiest places are. And the power plant database is a 2021 snapshot that misses many farms. WorldClim’s data are free for non-commercial use, so I publish images and summaries rather than the grids themselves.
Notes and sources
- Land wind: Fick, S.E. and Hijmans, R.J. (2017) WorldClim 2: new 1 km spatial resolution climate surfaces for global land areas, International Journal of Climatology 37: 4302 to 4315. Free for research and non-commercial use with citation.
- Ocean wind and direction: NCEP/NCAR Reanalysis 1, NOAA Physical Sciences Laboratory (public domain); Kalnay, E. et al. (1996) The NCEP/NCAR 40-year reanalysis project, Bulletin of the American Meteorological Society 77: 437 to 471.
- Wind farms: Global Power Plant Database v1.3, World Resources Institute and partners, 2021 (CC BY 4.0).
- Boundaries and places: Natural Earth; UK counties from Office for National Statistics boundaries (Open Government Licence).
- Paper, data and code: Zenodo and GitHub.
- I wrote the text, with drafting and editing assistance from Claude (Anthropic), which also helped prepare the analysis code. I reviewed and checked all text and results.

