
Tag: maps
-
How many months a year are pleasantly warm?
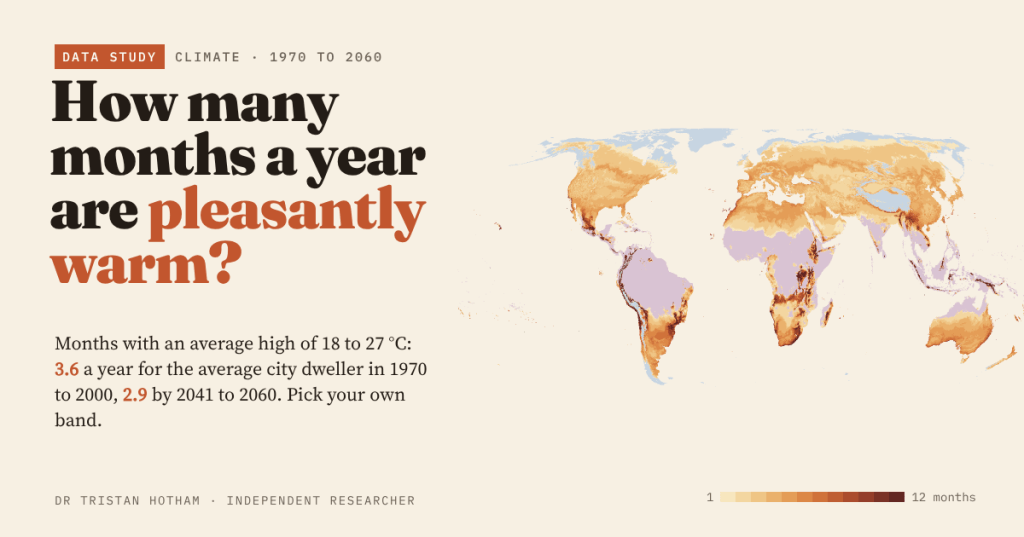
Count the months whose average afternoon high is 18 to 27 °C and the average city dweller gets 3.6 a year. By 2041 to 2060 it is 2.9: months are lost at the hot end, gained at the cool end, and you can pick your own band.
-
Sun and rain: the world’s sunshine against its rainfall
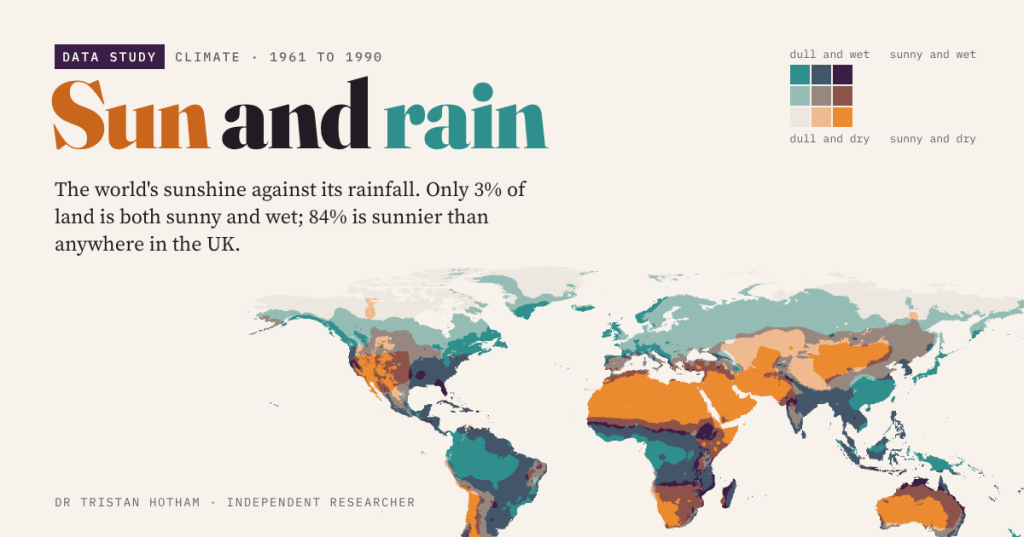
Sunny and dry, sunny and wet, dull and dry, dull and wet: a map of the world’s sunshine against its rainfall. Only 3% of land is both sunny and wet, and 84% is sunnier than anywhere in the UK.
-
Sun and rain: the UK’s sunshine against its rainfall
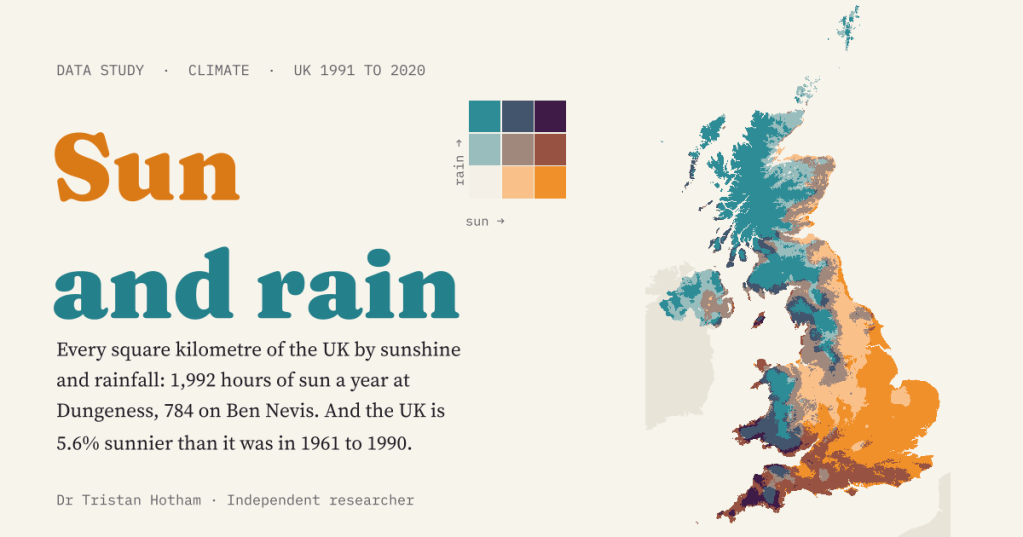
Every square kilometre of the UK by sunshine and rainfall at once: sunny and dry, dull and wet, and the rare places that are both sunny and wet. Since 1961 to 1990 the country has become 5.6% sunnier and 7.2% wetter.
-
When did your town last see a total eclipse?
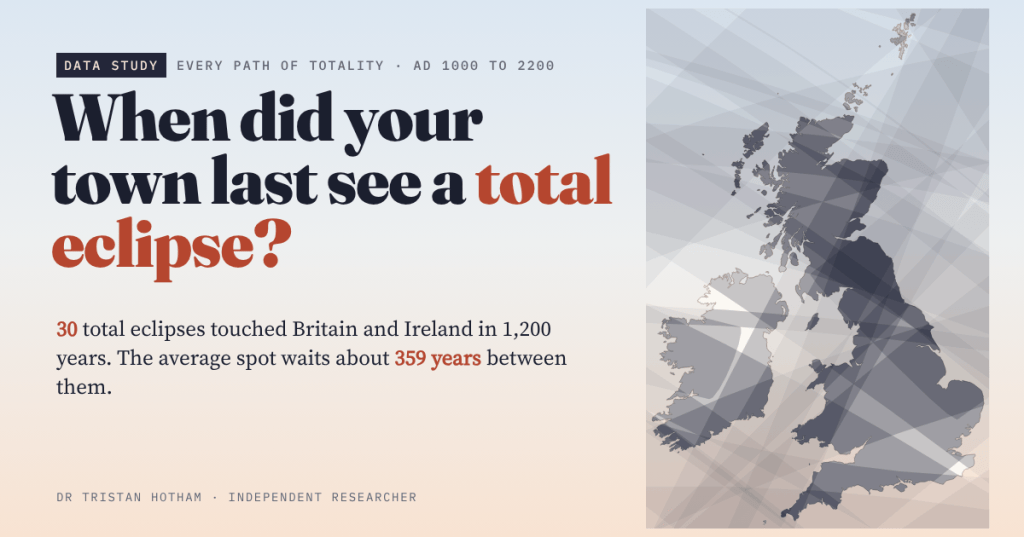
London has seen one total eclipse of the Sun in 1,200 years. I computed every path of totality across Britain and Ireland from AD 1000 to 2200 and tested 17,103 places: for most towns the last one was in 1715 or 1724.
-
Governing on the move: where England’s kings slept
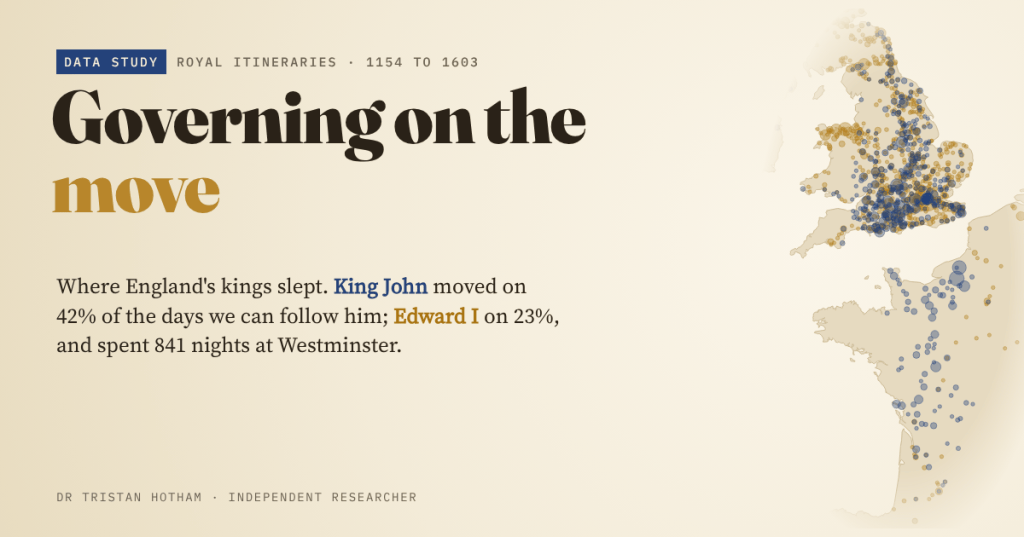
Medieval government travelled with the king. I mapped King John and Edward I night by night from old printed itineraries: John moved on 42% of the days we can follow him, Edward on 23%, and Edward spent 841 nights at Westminster.

