
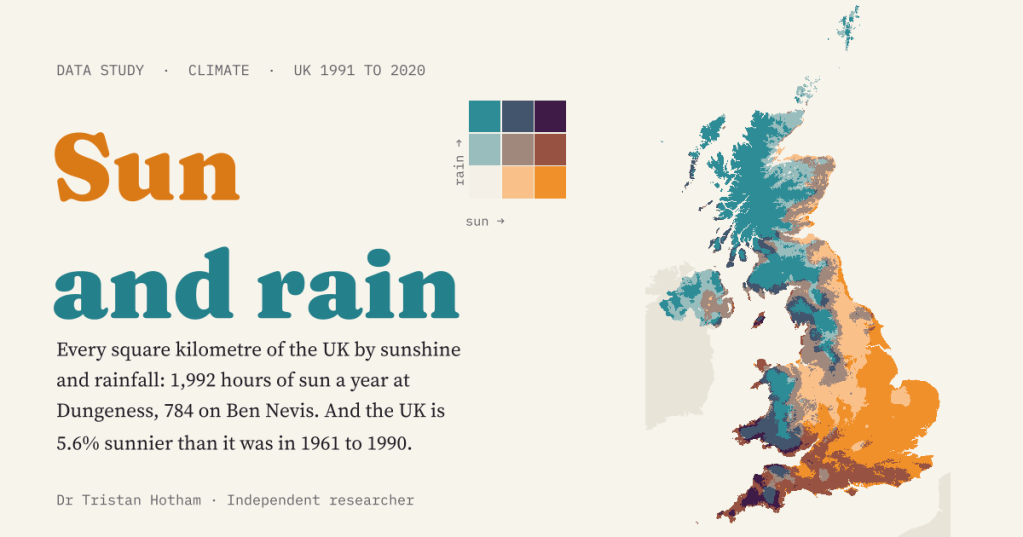
Is your corner of the UK sunny and dry, dull and wet, or one of the rare places that is both sunny and wet? I put every square kilometre of the country on both scales at once, then asked how much it has changed since the 1960s.
A Met Office map went round social media recently that coloured the UK by sunshine and rainfall at the same time. I loved it, and I wanted to be able to poke at it: change the season, move the breaks, look up my own village, compare it with the past. The data behind maps like that are open. The Met Office’s HadUK-Grid spreads the readings of the UK’s weather stations onto a grid of one kilometre squares, and publishes thirty-year averages for each of them. So I built my own version, with my own colours, and made it interactive.
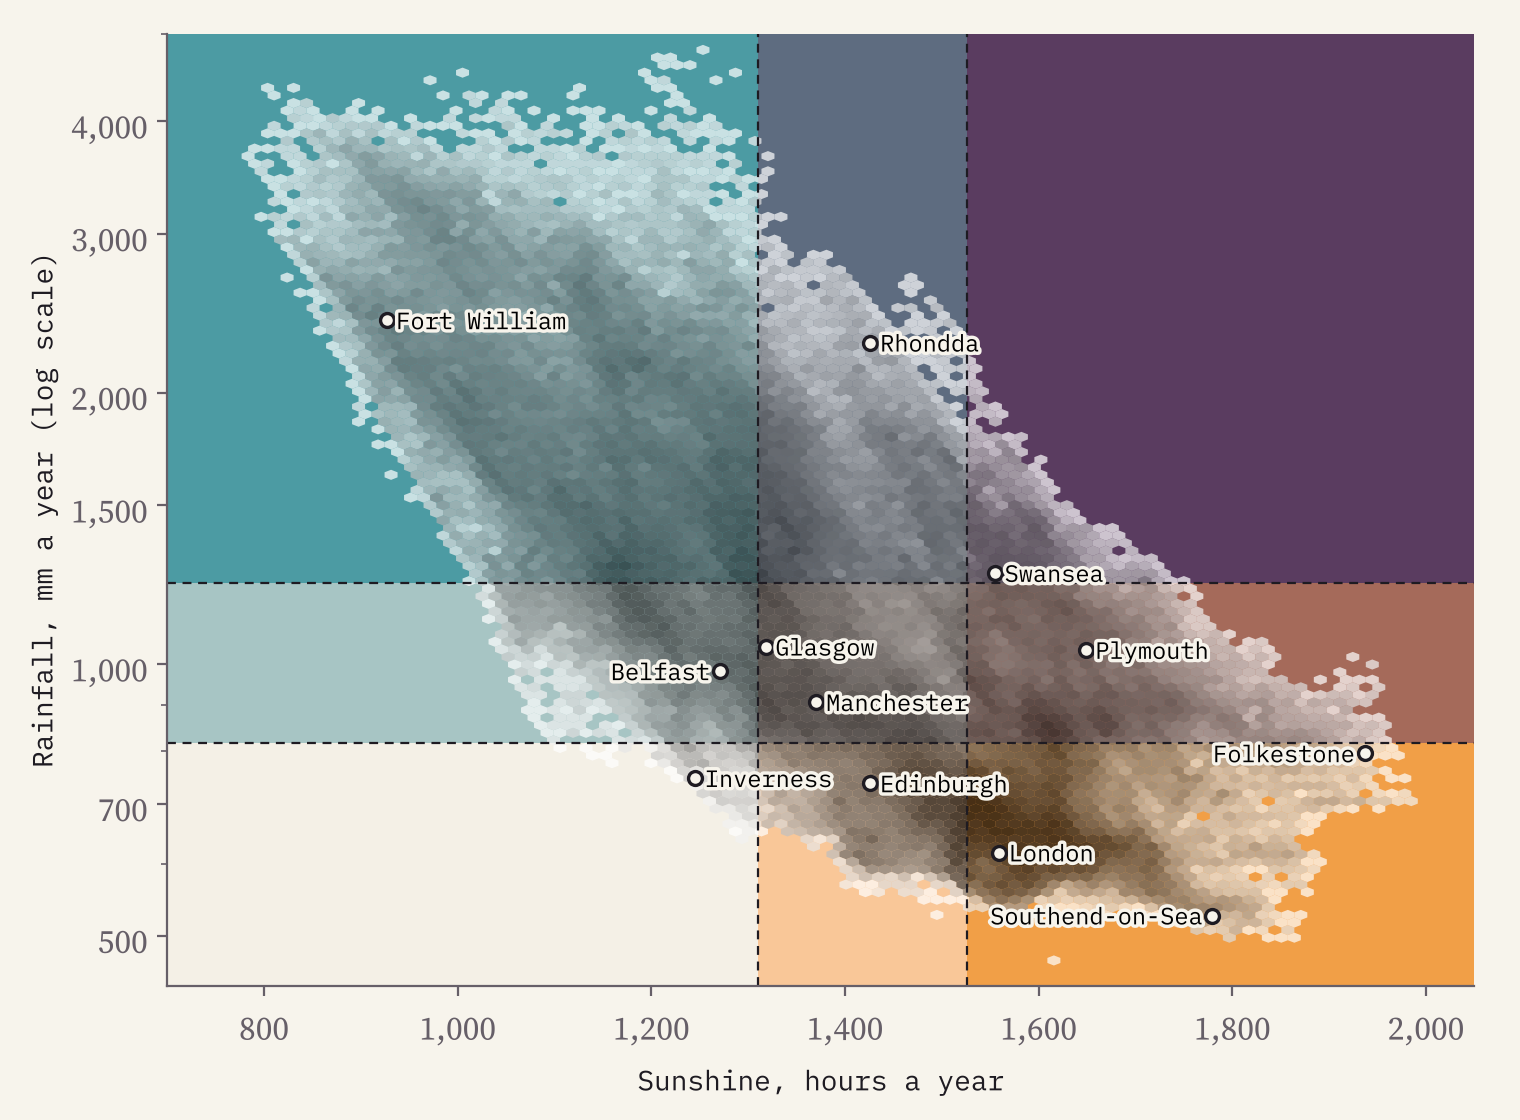
There are 245,077 land squares. In 1991 to 2020 the average one got 1,403 hours of bright sunshine and 1,162 mm of rain a year. But averages hide the fun.
Sunny and dry, dull and wet
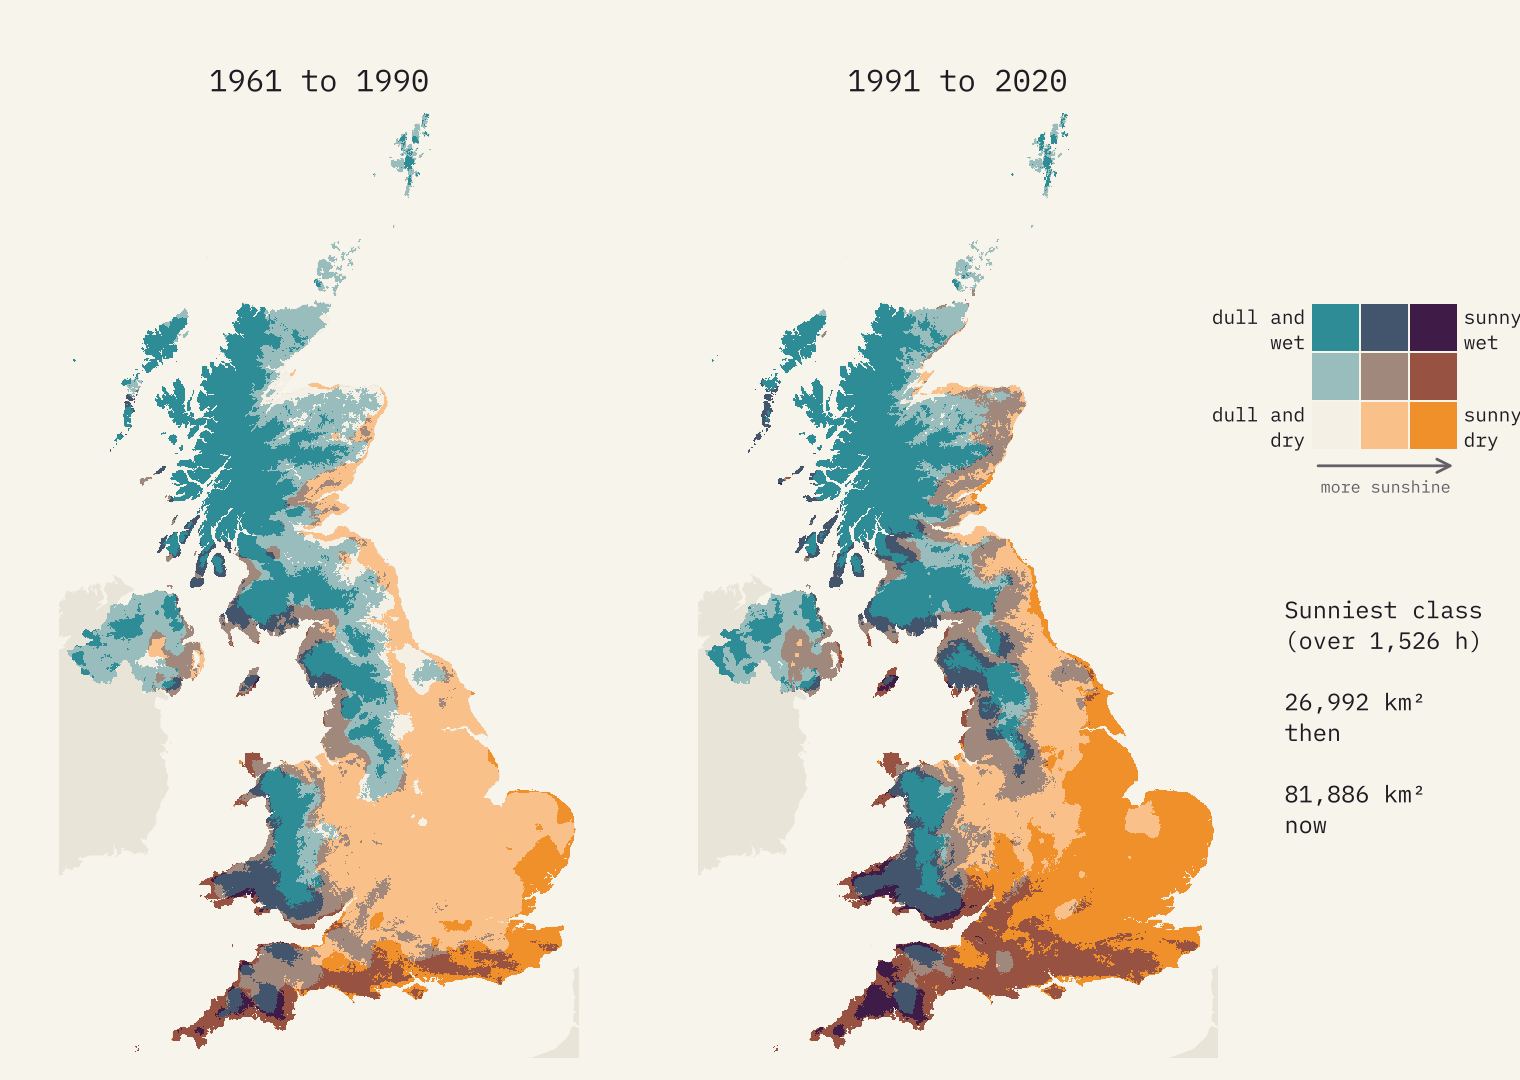
I split each measure into thirds of the land: the sunniest third, the middle third and the dullest third, and the same for rain. Crossing them gives nine colours. Marigold is sunny and dry, teal is dull and wet, the palest is dull and dry and a deep aubergine is sunny and wet.
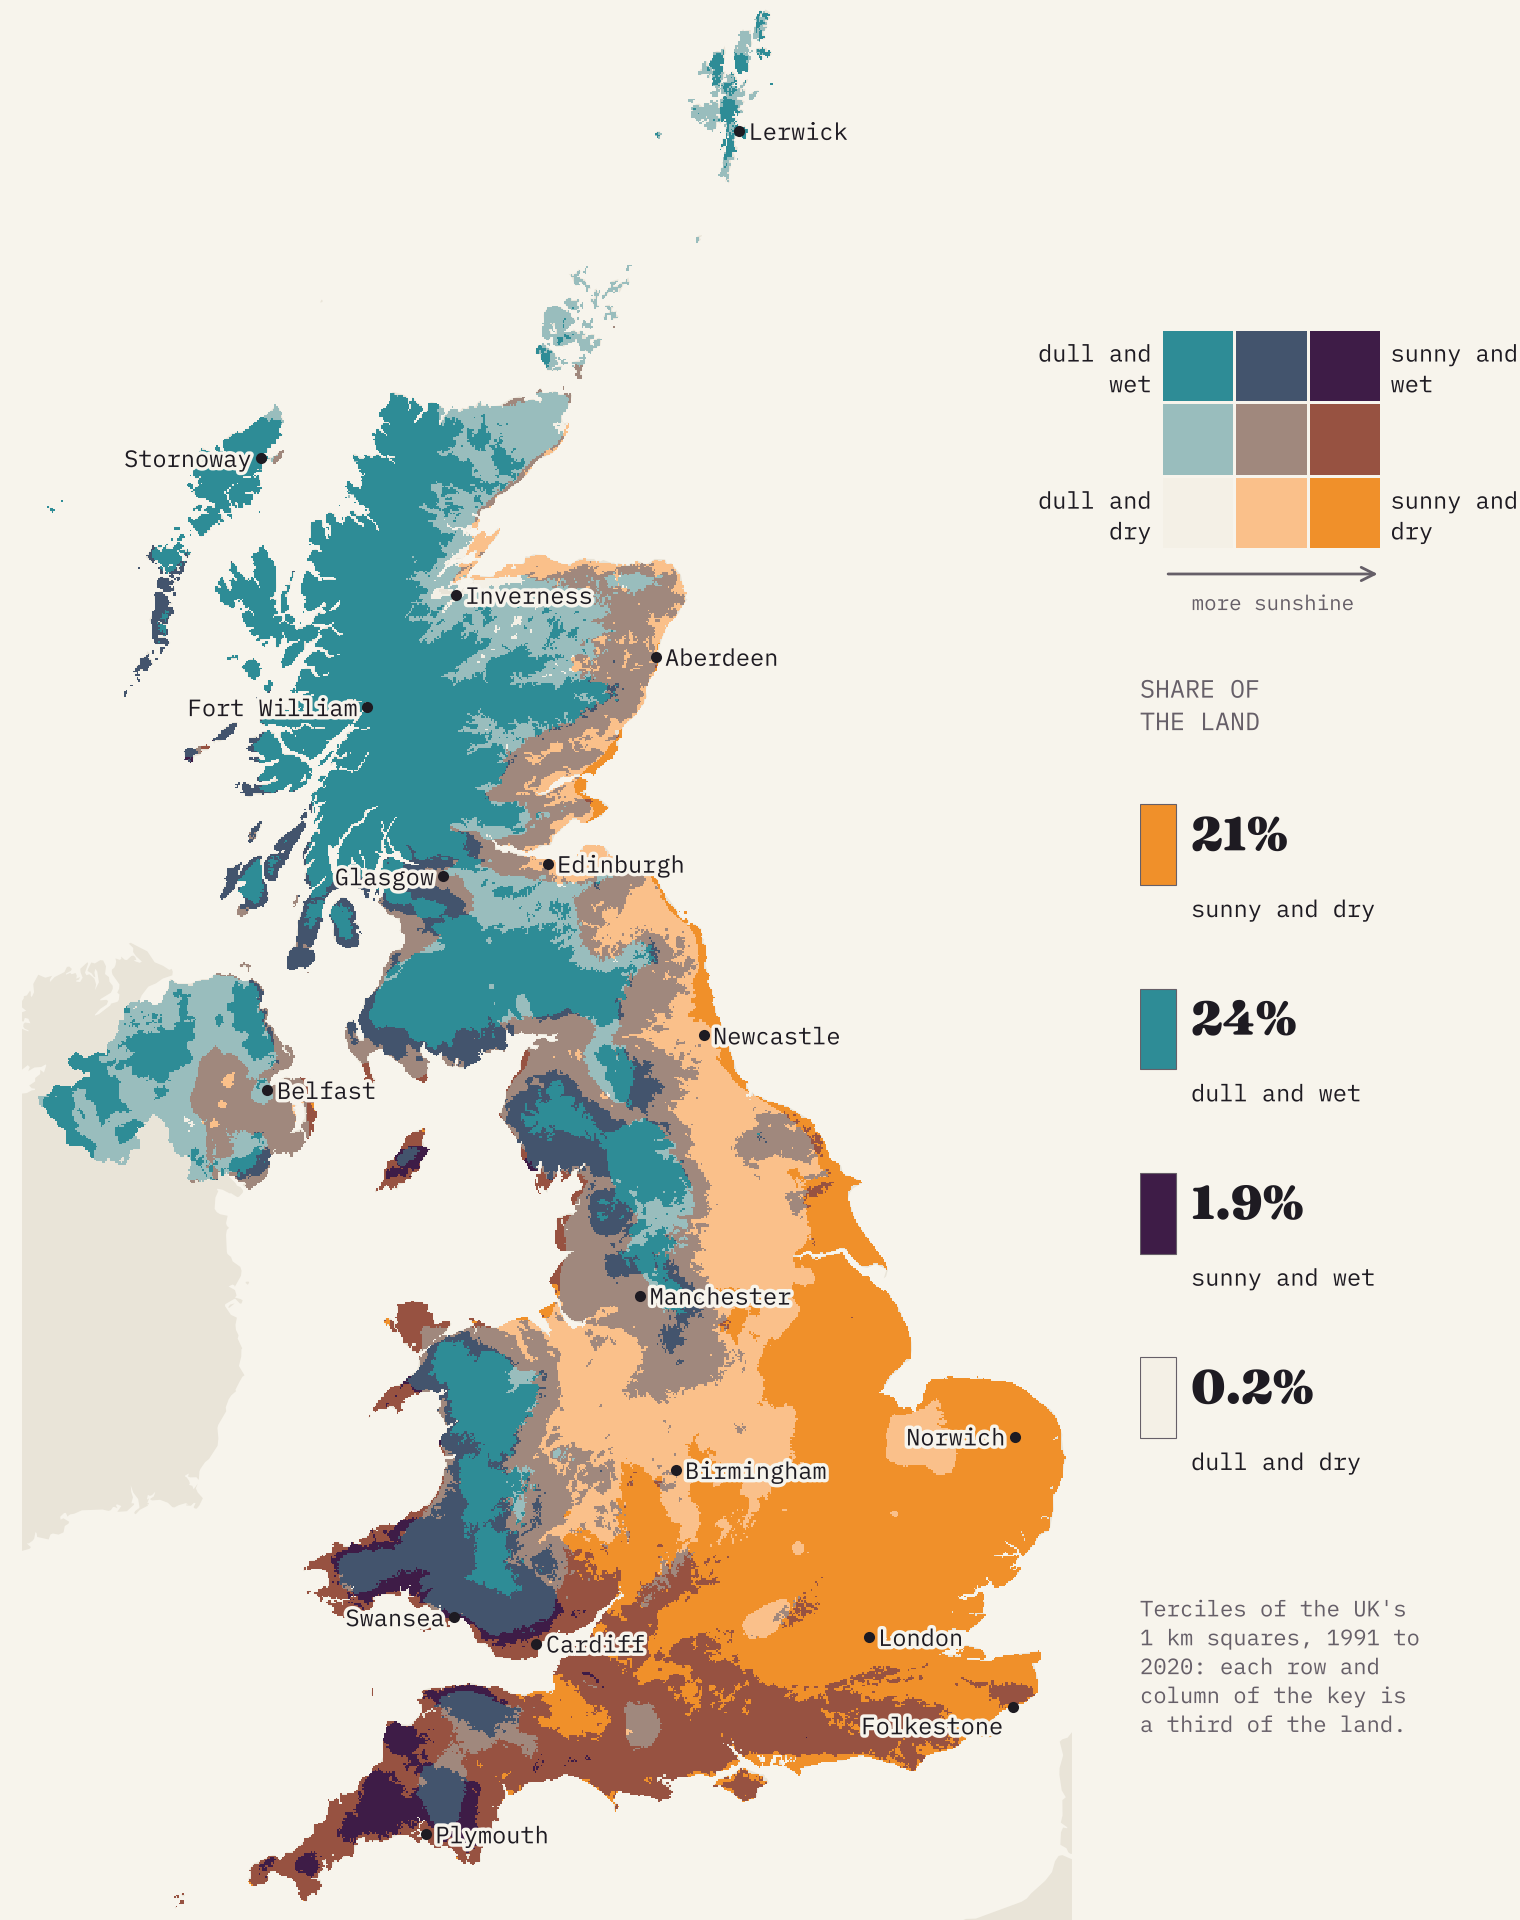
Sunshine varies by a factor of 2.5 across the country: from 1,992 hours a year on the shingle at Dungeness in Kent to 784 in the square that holds the summit of Ben Nevis. Rain varies by a factor of 10.2, from under 500 mm on the Isle of Sheppey to 4,796 mm in the fells at the head of Borrowdale in the Lake District.
The two pull hard against each other. Rank every square by sunshine and by rain and the correlation is −0.72. So two corners of the map are huge: sunny and dry covers 21% of the land, mostly in the East of England, the South East and the East Midlands, and dull and wet 24%, three quarters of it in Scotland. If sun and rain had nothing to do with each other, each would cover about 11%.
The odd corners
The other two corners are where it gets interesting. Sunny and wet is rare, 1.9% of the land, and almost all of it is in Cornwall, Devon, Carmarthenshire and Pembrokeshire. The far south west gets the Atlantic’s rain and the south coast’s sun. Swansea is the biggest town in it.
Dull and dry is rarer still: 608 square kilometres, 0.2% of the land, mostly around the Moray Firth in Highland and Moray. Those lowlands sit in the rain shadow of the Highlands, so the rain has fallen before the air reaches them, but they are far enough north for short winter days and plenty of cloud. Inverness is the only big town in it.
People cluster in the marigold. The towns of the sunny and dry third hold 49% of the people in UK towns of 15,000 or more, London among them. The dull and wet quarter holds 0.7%.
Head for the coast
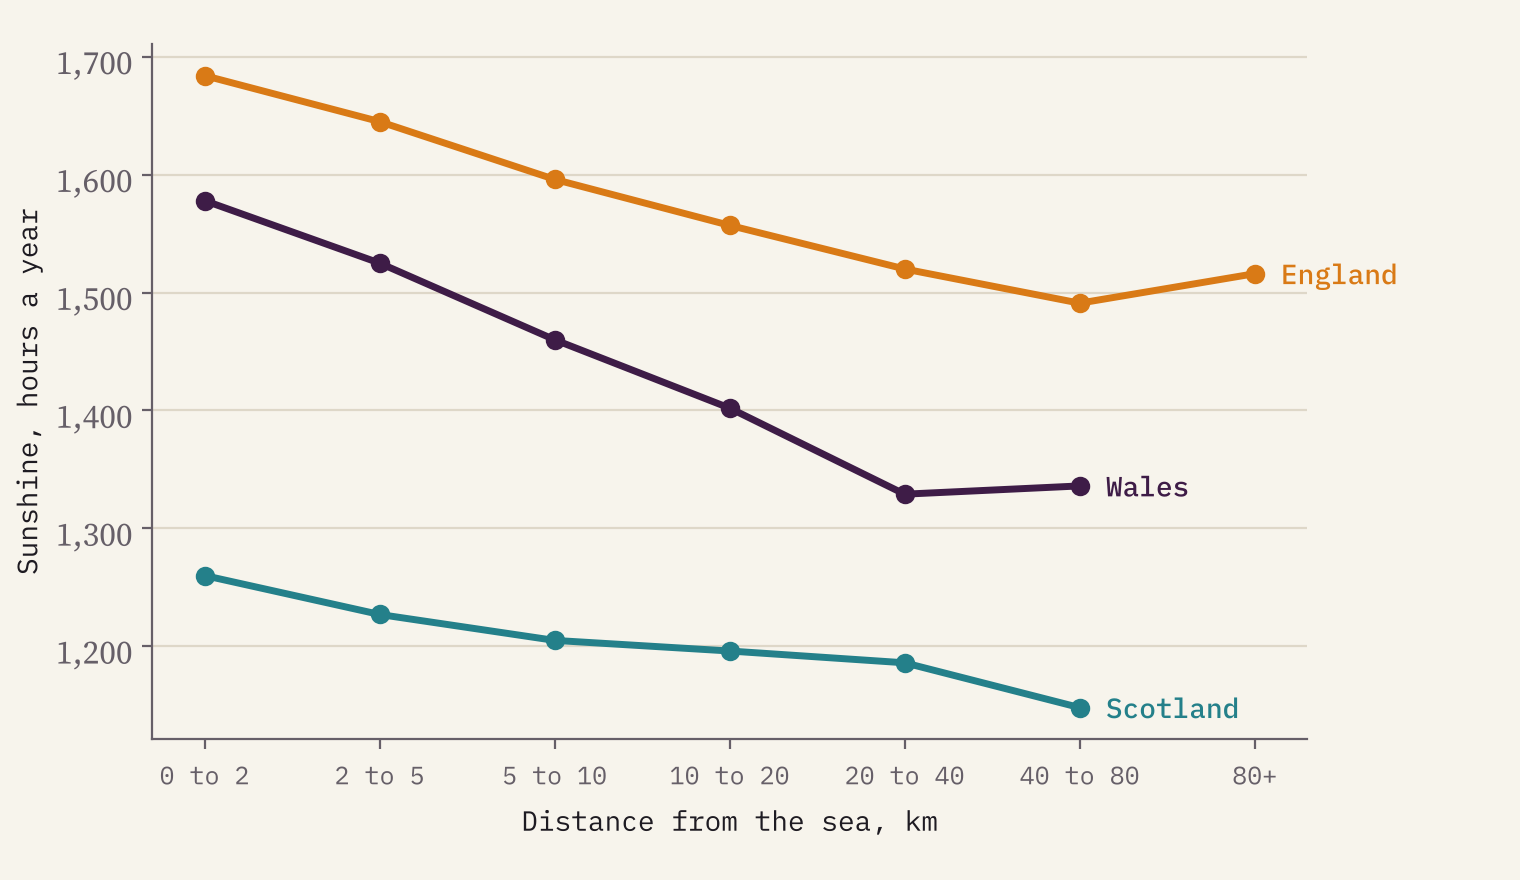
If you want sun, go to the seaside. Of the sunniest 1% of squares, 80% are within 5 km of the sea, though only 19% of Great Britain is. In England the first 2 km inland get 1,684 hours a year on average; more than 20 km inland it is 1,505. In Wales the gap is even bigger. Cloud tends to bubble up over warm land during the day while the air over the sea stays clear.
The sunniest bigger towns are all on the Channel coast: Folkestone (1,937 hours), Sandown on the Isle of Wight and Dover. Among smaller towns, Ventnor on the Isle of Wight wins with 1,955. Fort William is both the dullest and the wettest bigger town, and the driest are in south Essex, where Southend-on-Sea gets 526 mm a year.
Sunnier and wetter than the 1960s
The Met Office also publishes the same averages for 1961 to 1990. Compare the two and the UK has become both sunnier and wetter: 75 more hours of sun a year on average (5.6%) and 79 mm more rain (7.2%). 90% of the land got both. Using the same breaks for both periods, the sunniest class grew from 26,992 to 81,886 square kilometres.
The brightening was biggest in England (7.5%) and smallest in Northern Ireland (1.8%). Within England it was strongest in the North East (11.1%) and the East Midlands (10.1%). The towns that gained most are on Tyneside and in south Northumberland: Ashington, Blyth and Bedlington, all up by 17.5% or more.
The old industrial north east of England gained the most sunshine.
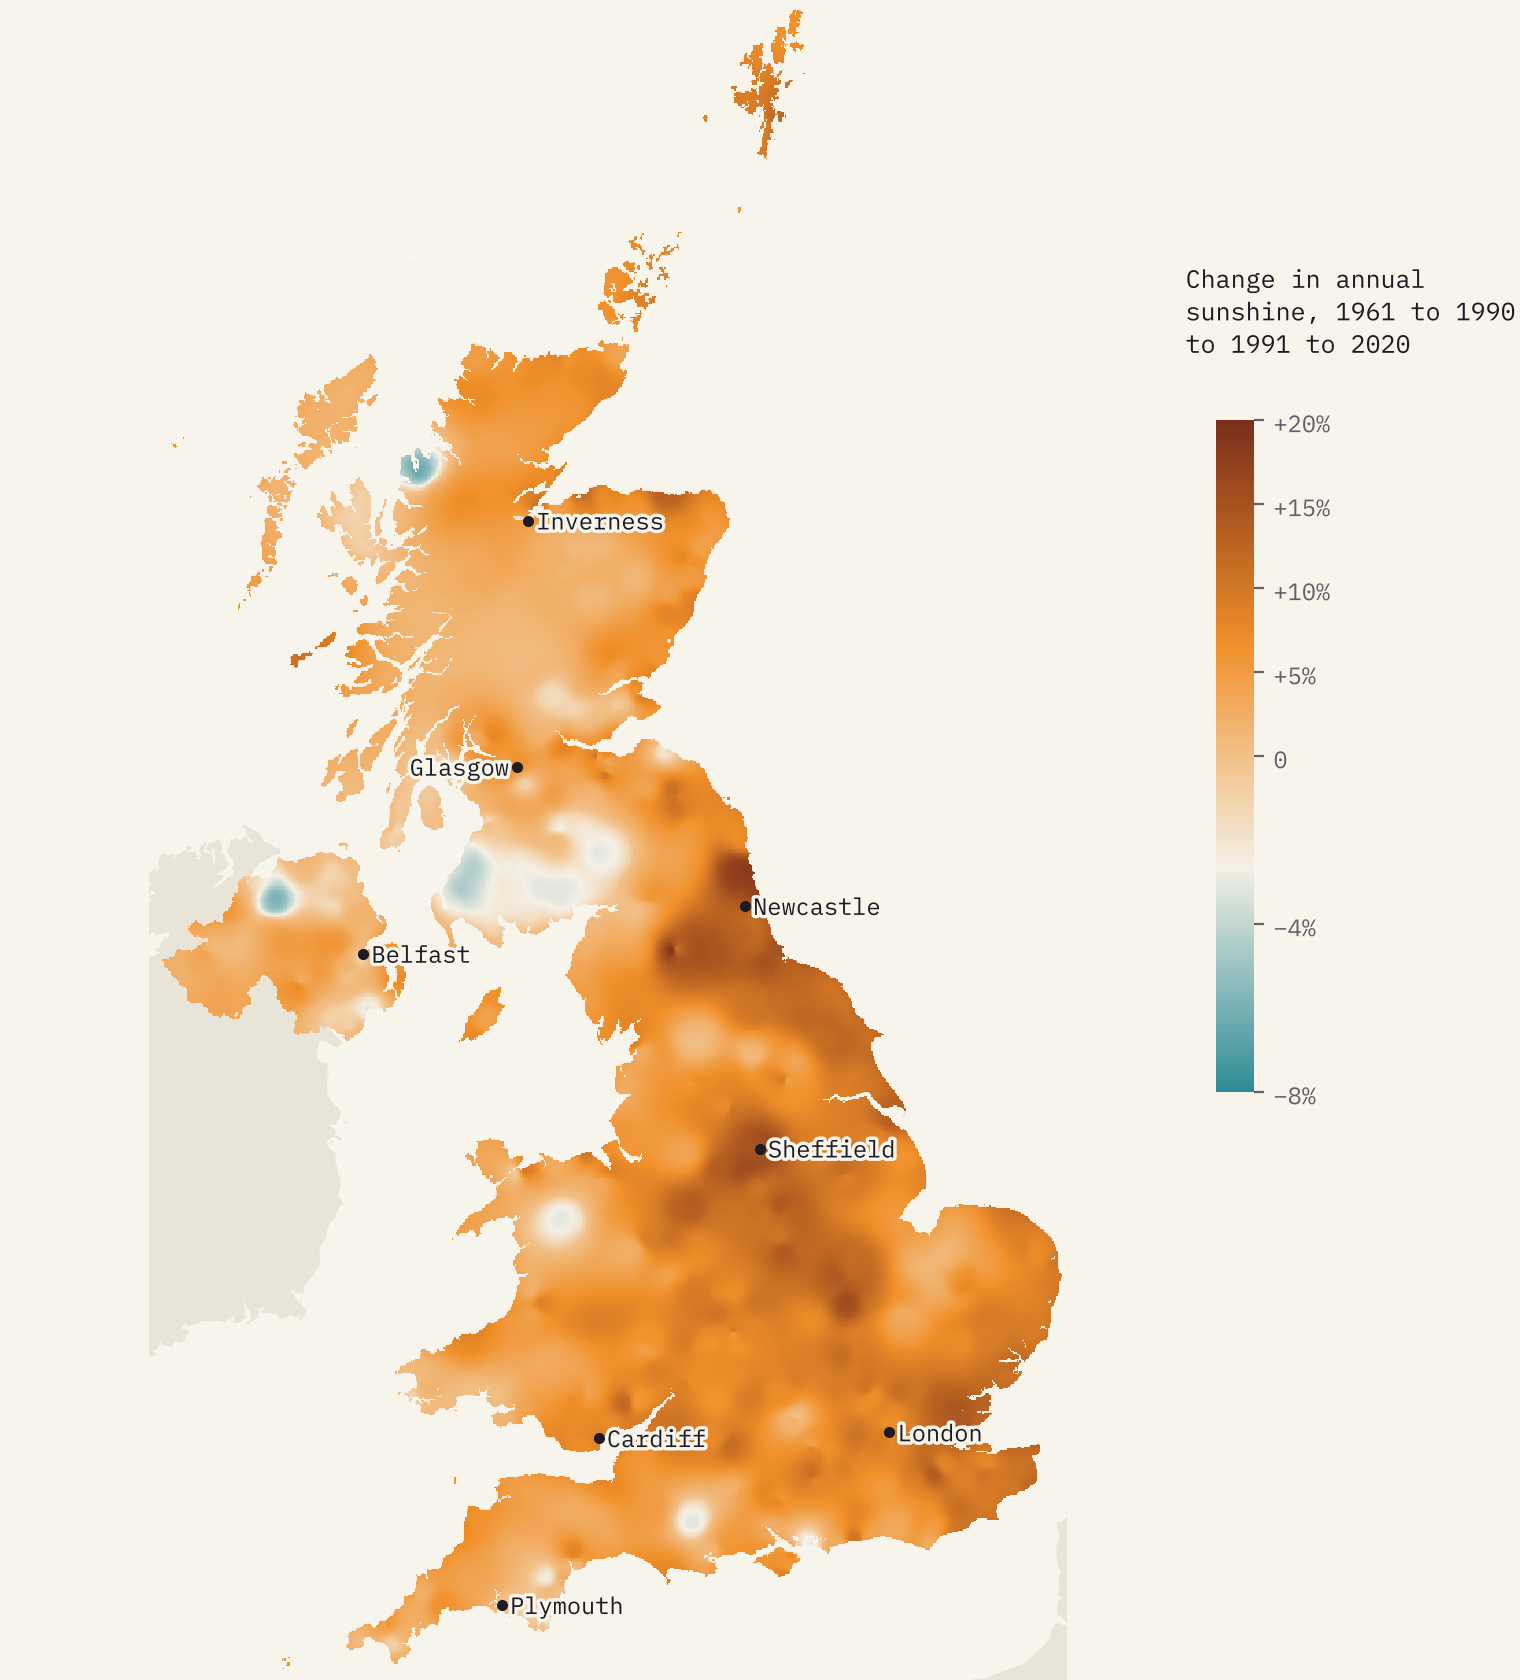
I do not test why. Part of it may be the instruments: sunshine recorders changed over the decades, and the round blobs on the change map are the footprints of single stations. But the pattern fits a well-known story. Smoke and sulphur haze cleared after the Clean Air Acts of 1956 and 1968 and the decline of heavy industry, and climate scientists have described a wider “brightening” of sunshine across Europe since the 1980s.
Your square
The interactive version is where to play. Type a place or postcode and you get that square’s sunshine, rain and daytime highs for every month, how it ranks in the UK and how it has changed since 1961 to 1990. Then press “Where else has weather like this?” and the map lights up every square with similar sun and rain. You can switch to any month or season (May is the sunniest month across the UK; December the dullest and wettest), set your own class breaks, light up any one colour from the key, and count the months that are pleasantly warm where you live. With highs of 18 to 27 °C, 25% of the UK has none at all, and nowhere has more than 5.
How I did this
The data are the Met Office’s HadUK-Grid version 1.3.2 thirty-year averages at 1 km: annual sunshine and rainfall for 1961 to 1990 and 1991 to 2020, and monthly sunshine, rainfall and maximum temperature for 1991 to 2020. The class breaks are the thirds of the UK’s land, so each row and column of the key covers the same area. Towns take the average of the 3 km block around their point in GeoNames (towns of 15,000 or more) or OS Open Names. The colours are my own, mixed from four corners. A grid is a model of the weather between stations, not a measurement in every square, so treat hilltop and remote values, and the change map, as broad patterns. The full method and caveats are in the paper.
Notes and sources
- Climate data: Met Office; Hollis, D., McCarthy, M., Kendon, M. and Legg, T. (2026) HadUK-Grid Gridded Climate Observations on a 1km grid over the UK, v1.3.2.ceda (1836 to 2025), NERC EDS Centre for Environmental Data Analysis. Contains Met Office data © Crown copyright 2026, Open Government Licence v3.
- Places: OS Open Names, contains OS data © Crown copyright and database right 2026 (Open Government Licence v3.0); GeoNames (CC BY 4.0). Context land: Natural Earth (public domain).
- Background: Hollis et al. (2019), HadUK-Grid, Geoscience Data Journal; Wild (2009), Global dimming and brightening: a review, Journal of Geophysical Research; Wikipedia, Clean Air Act 1956.
- The world version of this map: Sun and rain: the world’s sunshine against its rainfall. Pleasantly warm months worldwide: How many months a year are pleasantly warm?
- Data files: Open Government Licence v3; text and figures: CC BY 4.0; code: MIT.
- I wrote the text, with drafting and editing assistance from Claude (Anthropic), which also helped prepare the analysis code. I reviewed and checked all text and results.

