
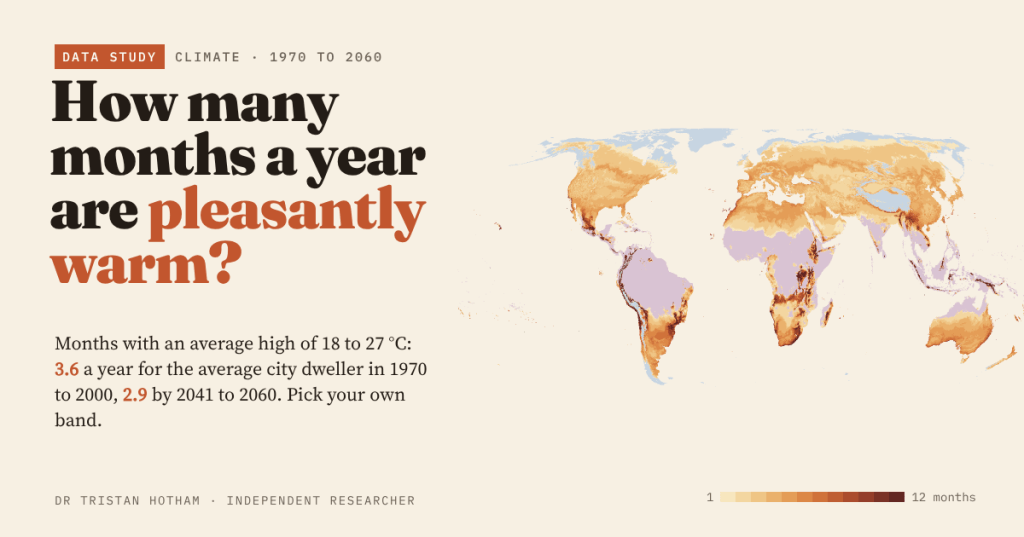
Count the months in which the average afternoon high is between 18 and 27 °C and you get a strangely vivid map of the world. For the average person in the world’s cities the answer is 3.6 months a year. By the middle of the century it is 2.9. And you can choose your own band.
Every so often a map goes round the internet showing how many months a year are “pleasantly warm” in each part of the world. People love it, argue about it, and then argue about what pleasant means. That last argument is the interesting one. A walker in Lancashire and a sun-seeker in Seville do not share a definition, and the climate of the 1980s is not the climate we are heading into.
So I built my own version, on open data, where the reader sets the band. The rule is simple: take the average daily high for each month, the typical warmest part of the day, and call the month pleasant if it falls inside your band. My default is 18 to 27 °C (64 to 81 °F): warm enough to sit outside without a coat, not so hot that walking across town is a chore. Then count, for every patch of land and for 31,778 cities of 15,000 people or more.
A thin, warm fringe
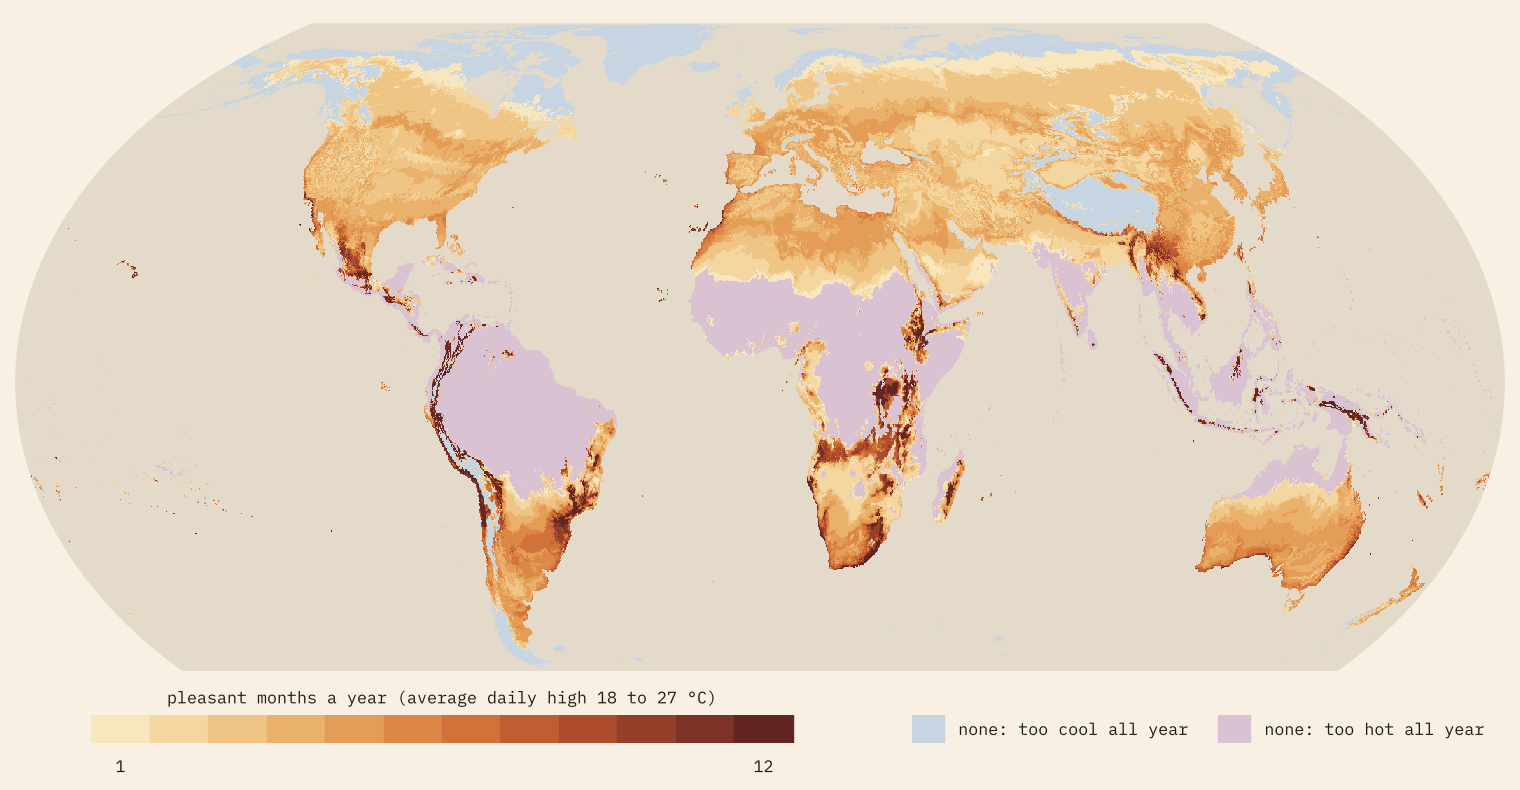
The map is a fringe. The Amazon, the Congo, India and Southeast Asia are too hot in every month; the Arctic and the Tibetan Plateau are too cool in every month. A third of all land outside Antarctica (34%) never has a month in the band. The average patch of land gets 2.5 pleasant months a year, and only 1.4% of it gets all twelve.
People do a little better, because they cluster in the warm middle latitudes: the average city dweller gets 3.6. But a fifth of them (21%) live where no month qualifies, almost all because it is simply too hot. Lagos, Kinshasa, Mumbai, Bangkok, Jakarta and Singapore never have an average afternoon below 27 °C.
Spring all year
Twelve pleasant months need a climate with almost no seasons and a warm but not hot day, and on Earth that mostly means altitude in the tropics. Of the 560 cities of a million people or more, 14 managed it in 1970 to 2000: São Paulo, Lima, Addis Ababa, Caracas, Cali, Medellín, Curitiba, Antananarivo and Kigali among them. Sydney, Mexico City and Johannesburg came close with ten.
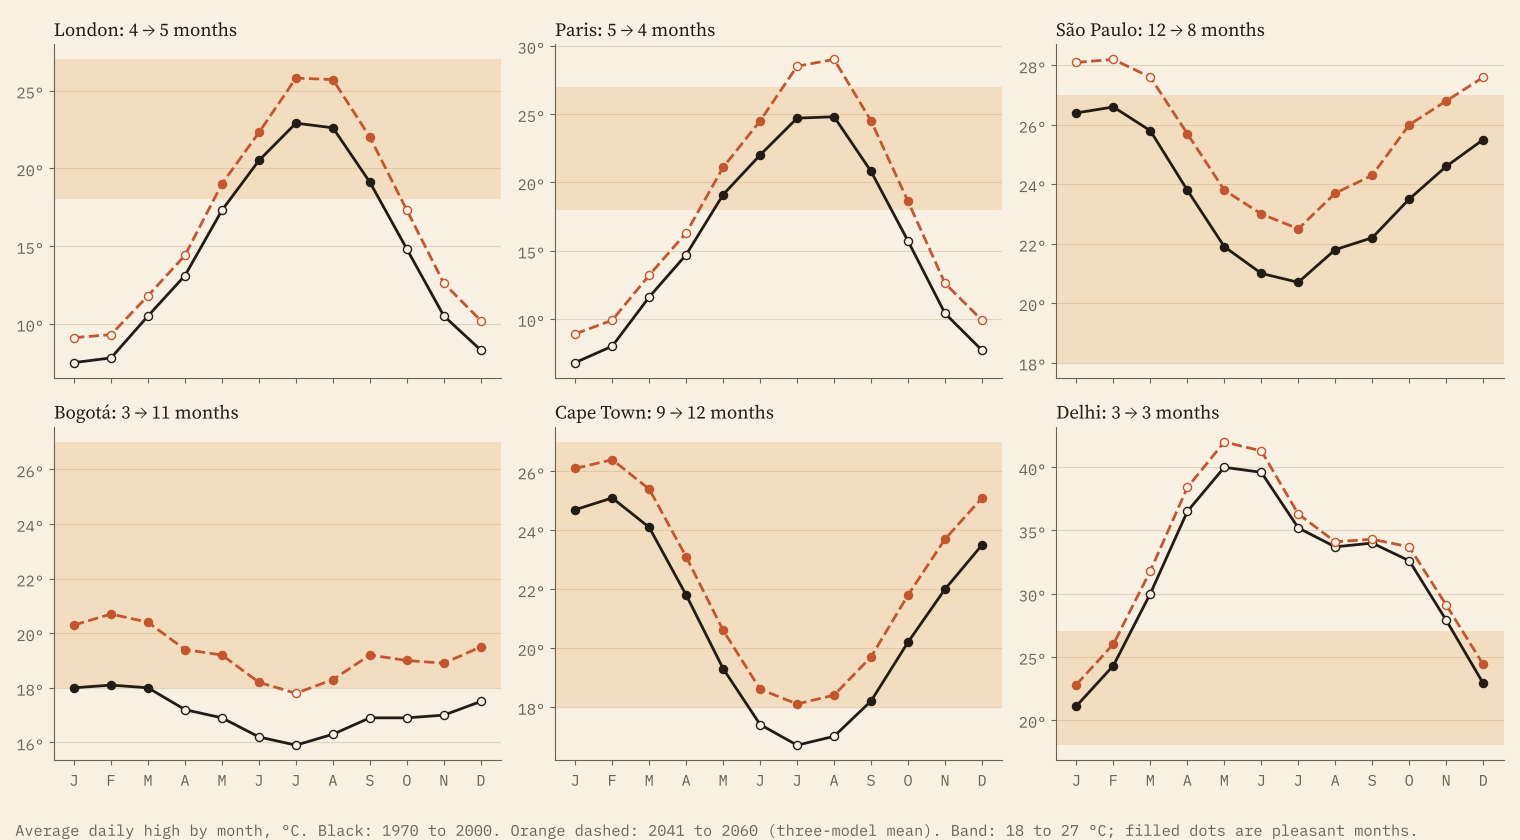
Those flat years are also fragile. When every month sits at much the same temperature, a uniform warming pushes months out of the band together, like a tray of glasses sliding off a table.
The middle of the century
WorldClim also publishes climate model projections downscaled to the same grid. I took three models for 2041 to 2060 under SSP2-4.5, a middle-of-the-road emissions path, and averaged them. Afternoon highs on land rise by 2.6 °C on average over 1970 to 2000 (from 1.6 to 3.8 °C across the three models), and the fringe moves with them.
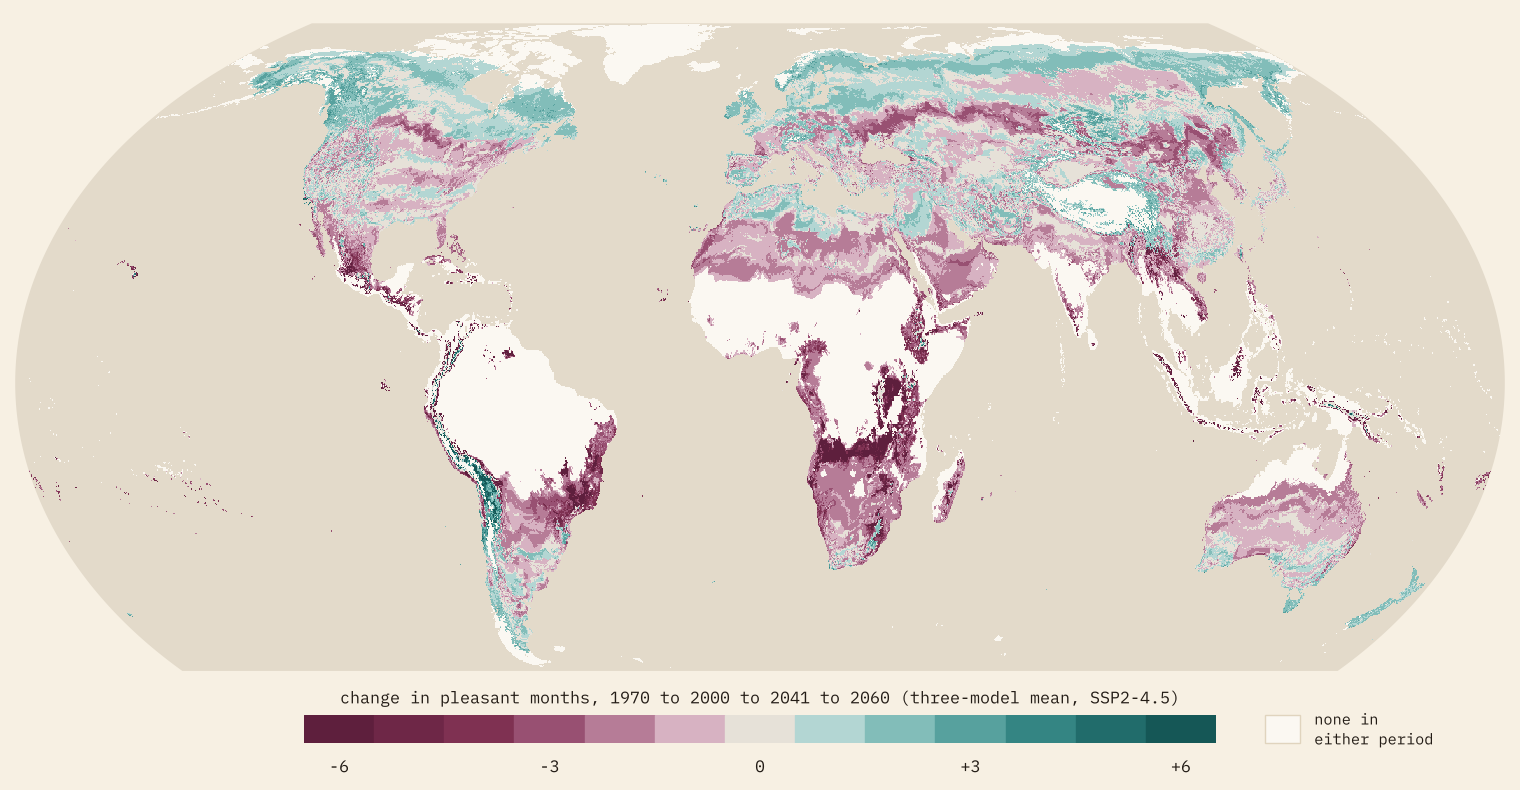
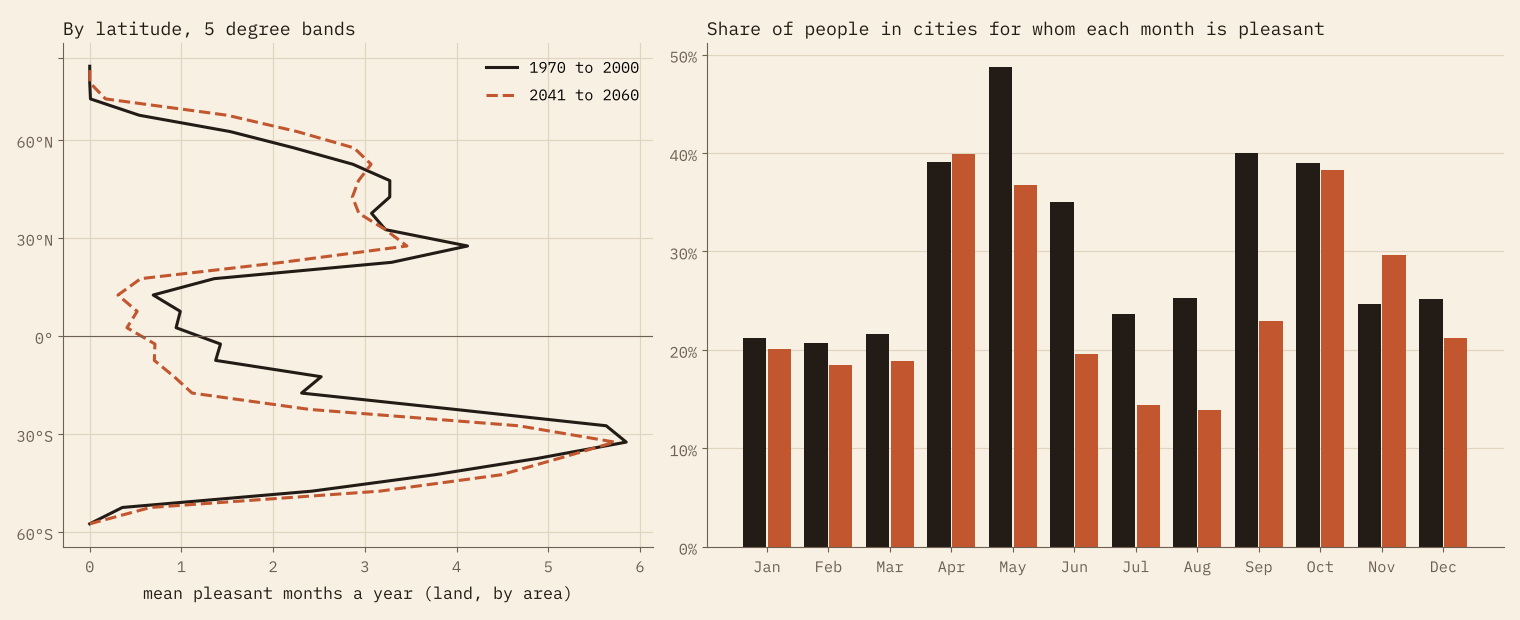
Months are lost at the hot end and gained at the cool end. The trouble is that most people live at the hot end. The average city dweller goes from 3.6 pleasant months to 2.9. 46% of people in these cities lose at least one month and only 14% gain one. Among the big cities, 264 lose a month or more and 71 gain, and the club of year-round cities shrinks from 14 to 5: São Paulo drops to 8 months, Lima to 9, Kigali to 4. Addis Ababa, Medellín and Arequipa hold on, and Cape Town and La Paz, cooler today, join them.
Warming does not just add summer. It takes months away at the hot end and hands them out at the cool end.
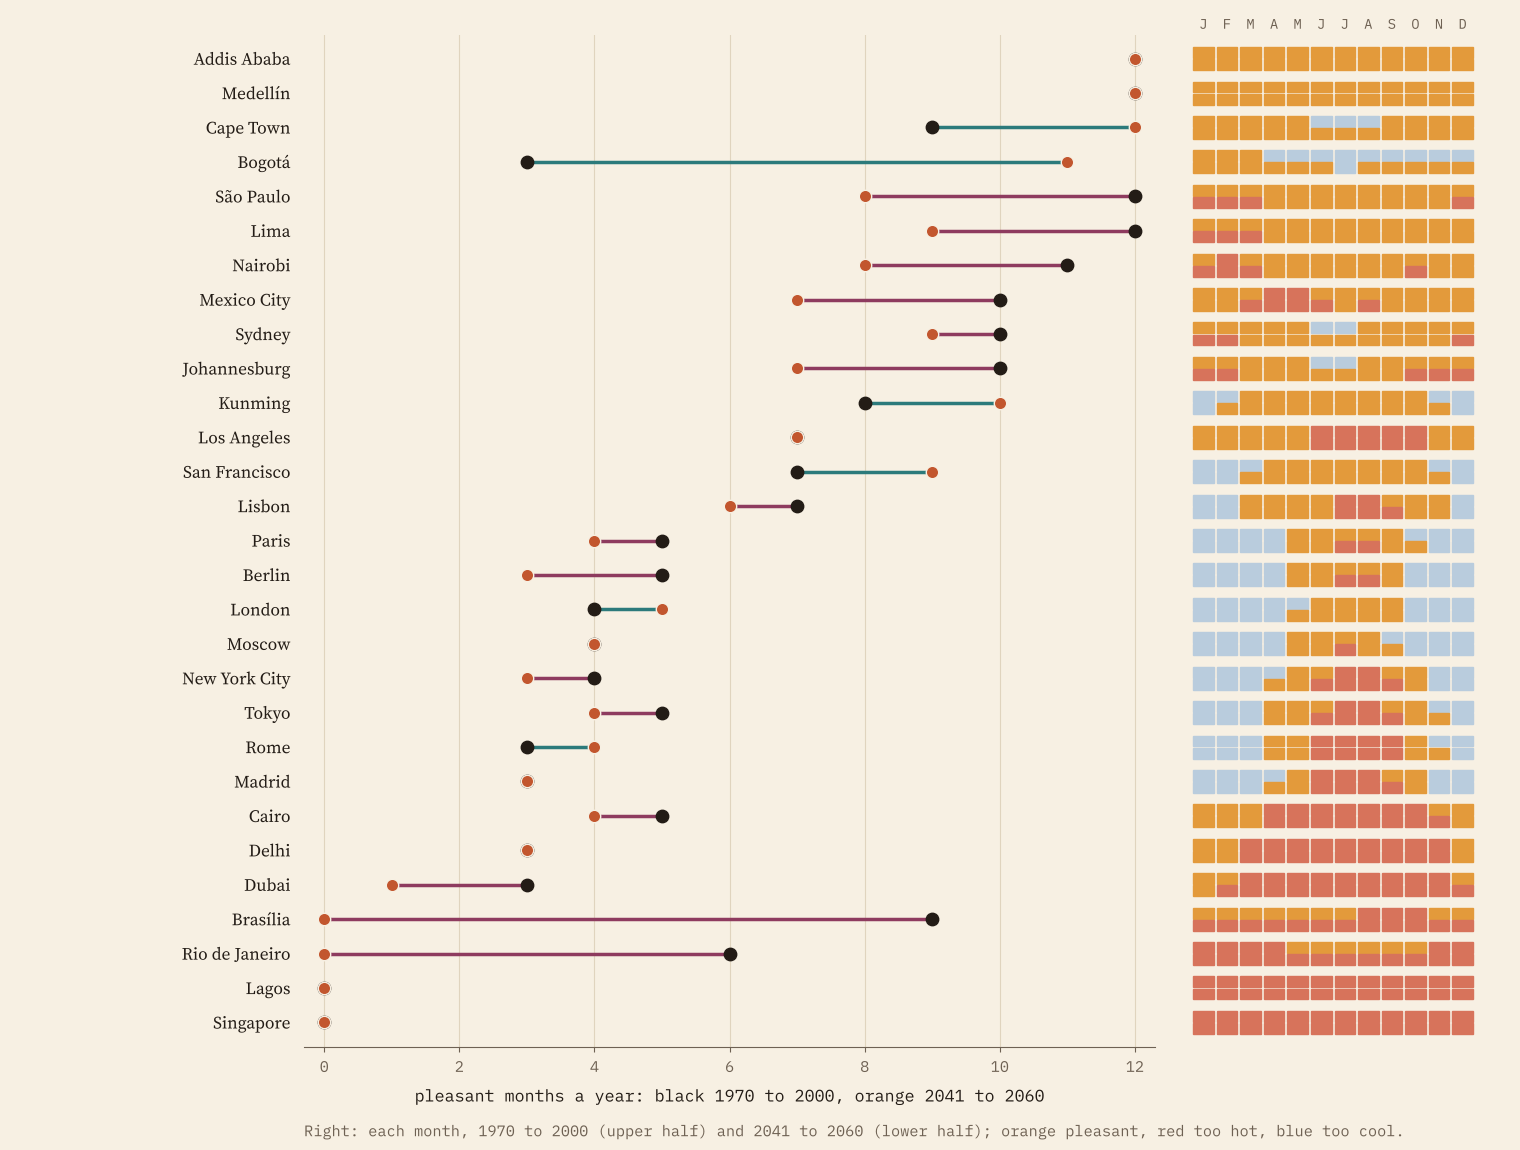
The biggest losers are warm plateau cities that sit just under the top of the band: Brasília goes from 9 pleasant months to 0, Rio de Janeiro from 6 to 0. The biggest winners are cool highland cities just under the bottom of it: Bogotá goes from 3 to 11, and Quito from 0 to 4.
Summer splits in two
My favourite result is a quiet one. In 38 big cities, mostly in the northern mid-latitudes, one pleasant season becomes two. Paris goes from May to September to May and June, then September and October: spring arrives earlier and autumn lasts longer, while the average July and August afternoon climbs above 27 °C. Berlin, Vienna, Warsaw, Kyiv, Toronto and Moscow do the same. Across all the cities, the month that is pleasant for the most people moves from May (49% of them) to April (40%), and July and August fall to 14%.
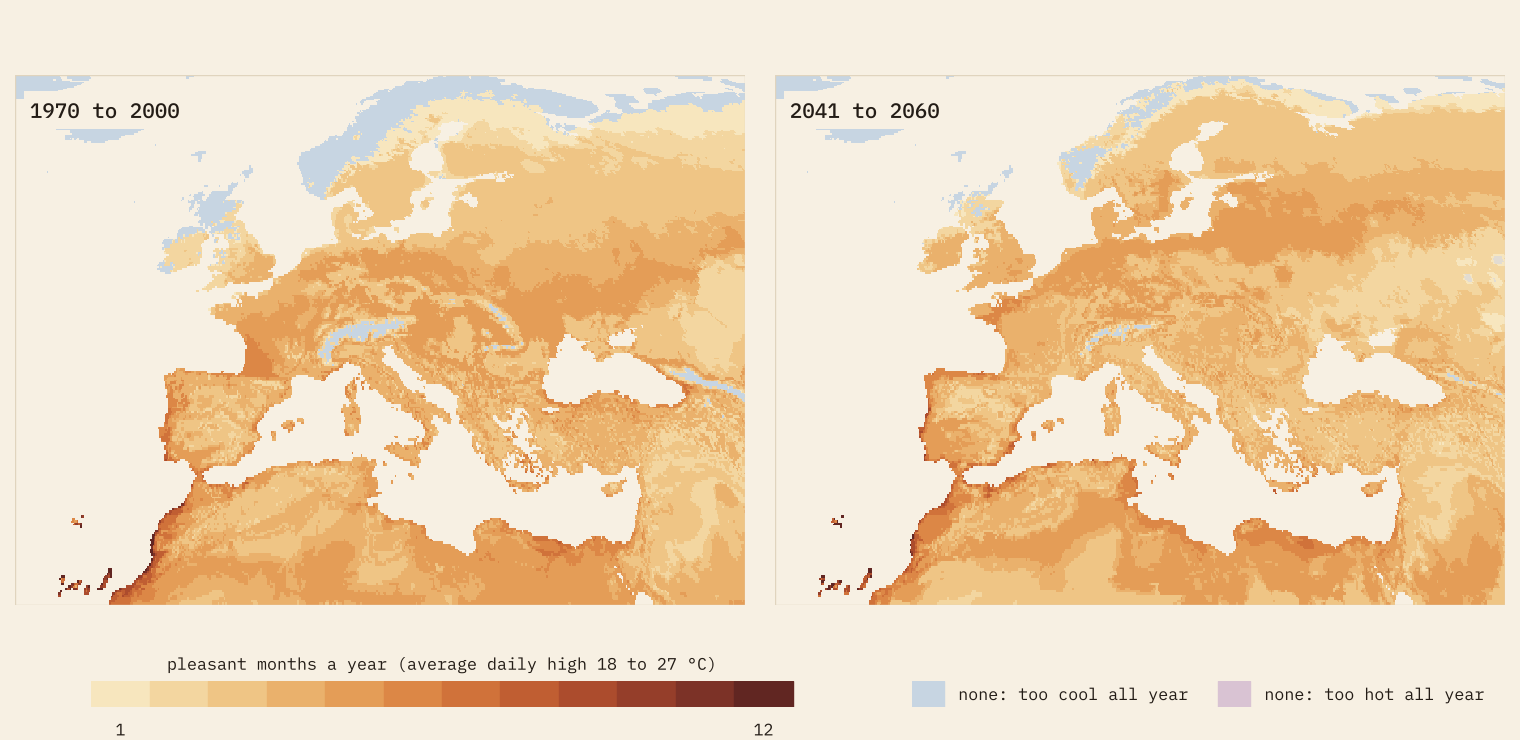
Britain is on the other side of the line. People in British cities get 3.2 pleasant months on average now and 4.3 by mid-century, one of the biggest gains of any large country. London goes from 4 (June to September) to 5 (May to September). That is a statement about afternoon temperatures, not a forecast of nice weather: it says nothing about rain, wind or heatwaves.
Pick your own band
Everything above depends on my 18 to 27 °C, so the interactive map lets you drag the band anywhere from -10 to 40 °C, switch to Fahrenheit, flip between now, mid-century and the change, look at one month at a time and search any city. Every number on the page is recalculated in your browser as you move the handles. I also tried seven bands in the paper, from a cool 15 to 25 °C to a hot 22 to 32 °C. The levels change a lot. The direction never does: in every band, the average city dweller loses pleasant months, and more people lose than gain.
How I did this
The climate of 1970 to 2000 is WorldClim 2.1’s monthly average of daily maximum temperature on a 10 arc-minute grid (about 18 km). The future is WorldClim’s downscaled CMIP6 data for 2041 to 2060 under SSP2-4.5 from three models, MPI-ESM1-2-HR, UKESM1-0-LL and IPSL-CM6A-LR, averaged. That is three models and one scenario, and UKESM1-0-LL runs hot, so the paper reports each model too: the share of city dwellers losing a month is 38% with the coolest model and 50% with the hottest. Cities are the GeoNames list of places with 15,000 people or more, each given the climate of its nearest grid cell; for population totals I leave out city districts so nobody is counted twice, which covers 3.9 billion people, about half the world.
The caveats matter. This is afternoon highs only: humidity, nights, rain and sunshine are ignored, so a sticky 26 °C counts the same as a dry one. The grid smooths mountains and coasts. The baseline is 1970 to 2000, and the world has already warmed since. “Pleasant” is a label for a band, not a measure of comfort.
Notes and sources
- Climate 1970 to 2000: WorldClim 2.1, Fick, S.E. and Hijmans, R.J. (2017) WorldClim 2: new 1-km spatial resolution climate surfaces for global land areas, International Journal of Climatology 37(12): 4302 to 4315 (CC BY 4.0).
- Climate 2041 to 2060: WorldClim downscaled CMIP6 data, SSP2-4.5, models MPI-ESM1-2-HR, UKESM1-0-LL and IPSL-CM6A-LR (CC BY 4.0), from the Coupled Model Intercomparison Project Phase 6.
- Cities: GeoNames cities15000 (CC BY 4.0). Country outlines: Natural Earth (public domain).
- Data and figures are released under CC BY 4.0 with credit to WorldClim and GeoNames; the code is MIT.
- I wrote the text, with drafting and editing assistance from Claude (Anthropic), which also helped prepare the analysis code. I reviewed and checked all text and results.

