
Category: Data stories
-
Cholera 1849: low ground, bad water and a long shadow
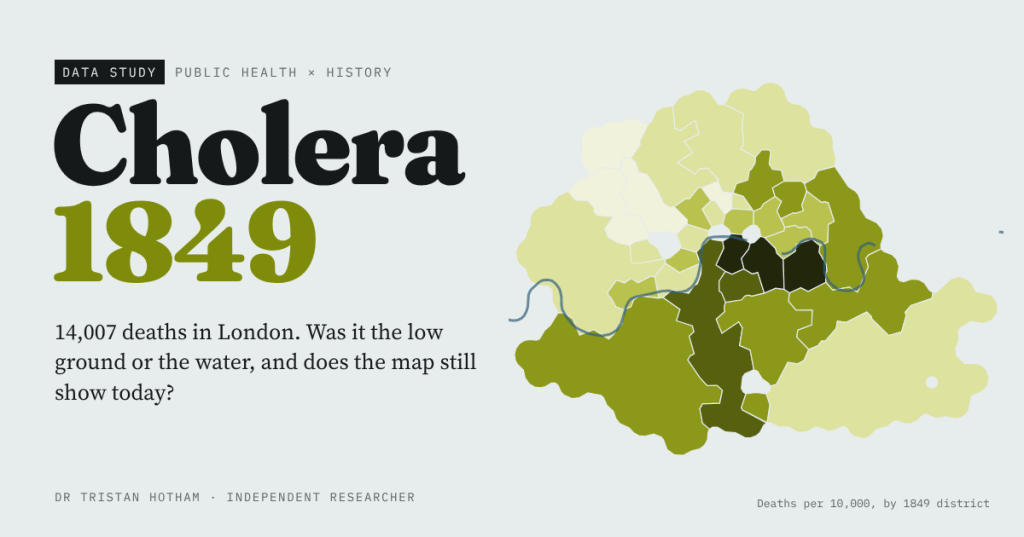
In 1849 cholera killed 14,007 people in London. I rebuilt William Farr’s elevation law and John Snow’s water evidence from their own tables, mapped every death around the Broad Street pump, and found that the worst-hit districts of 1849 are not the poorest today.
-
The Roman Commuter Belt?
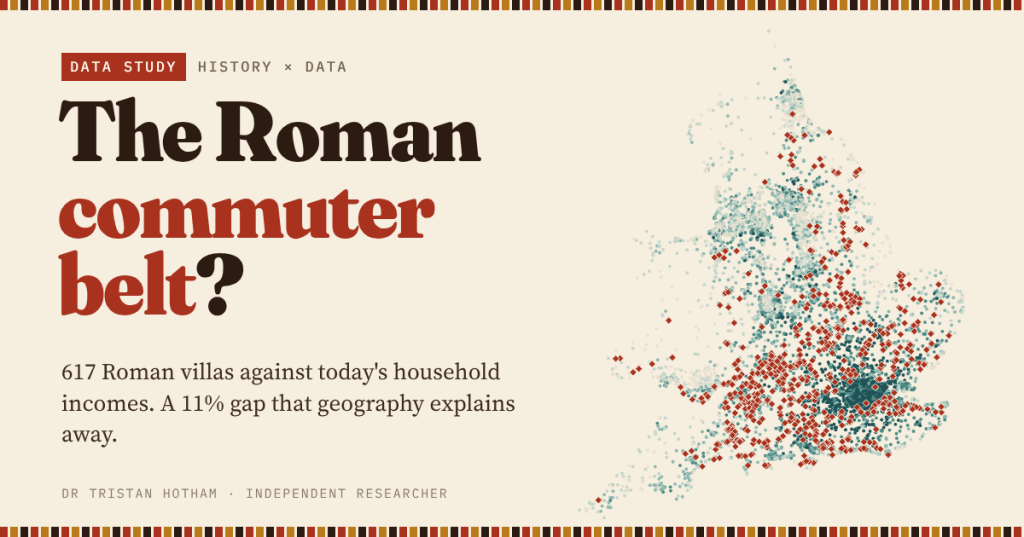
Roman villas and today’s richest neighbourhoods both crowd into the lowland south-east. I set 617 villas against household income across England and Wales: the villa premium is real at first sight, and almost all geography.
-
Laid Waste: the Harrying of the North
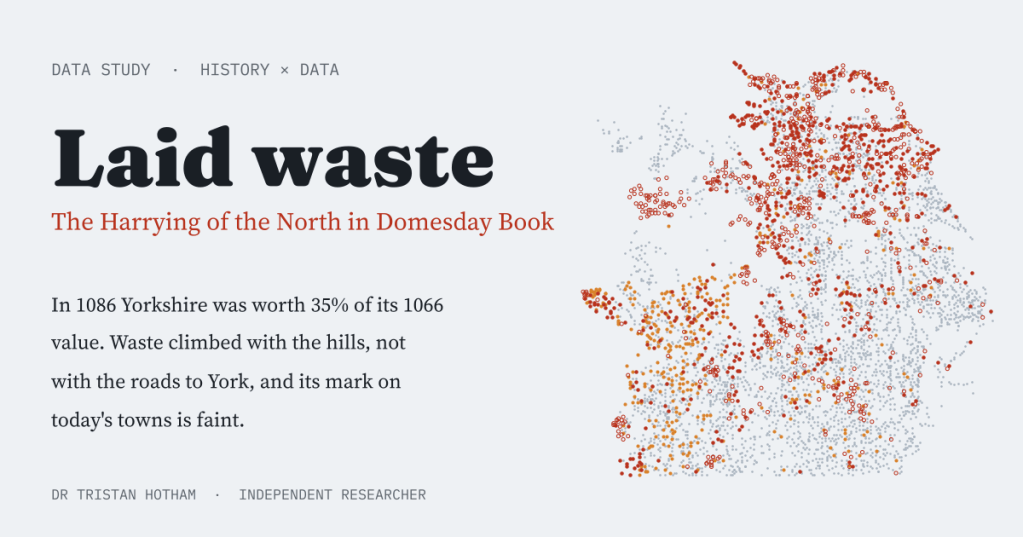
Domesday Book called hundreds of northern places waste after William the Conqueror’s Harrying of the North. I mapped them: Yorkshire was worth 35% of its 1066 value, the waste climbed the hills rather than the roads to York, and its scar on today’s map is faint.
-
Fire on the Hills: how fast could the Armada beacons carry the news?
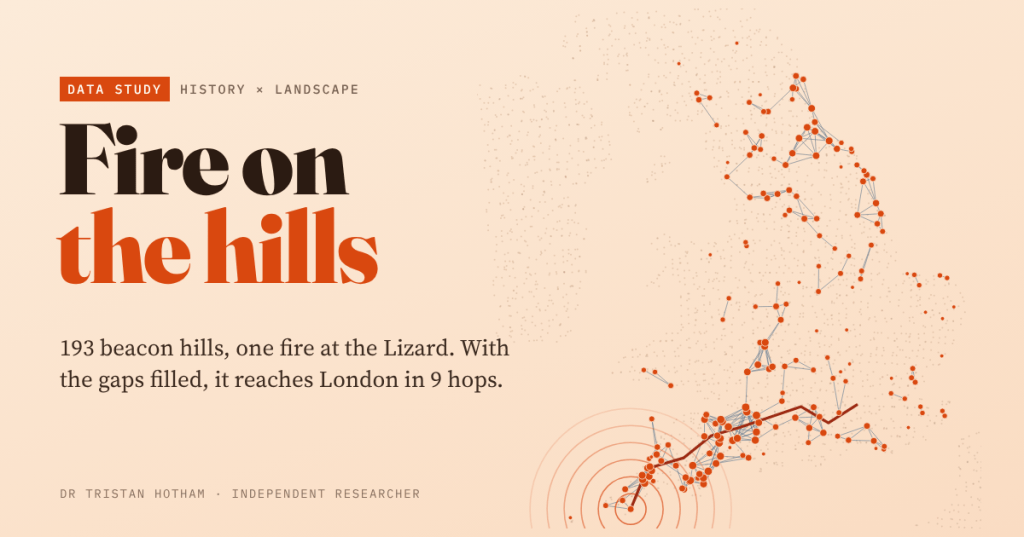
I traced the lines of sight between 193 hills named for a beacon and lit a fire at the Lizard. On the names alone it never leaves Cornwall; fill the gaps and it reaches London in 9 hops.
-
Ford or Bridge?
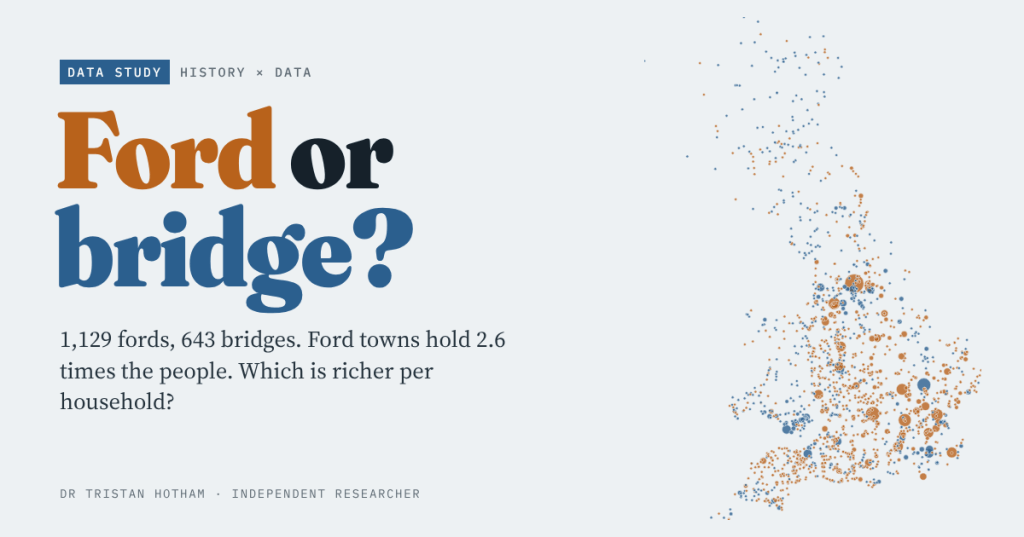
Oxford waded, Cambridge built. I set every ford and bridge place-name in Britain against the 2021 census and small-area income: ford towns hold 2.6 times the people, and the typical ford place is a little richer per household too.

