
Category: Data stories
-
The footpath capital of Britain
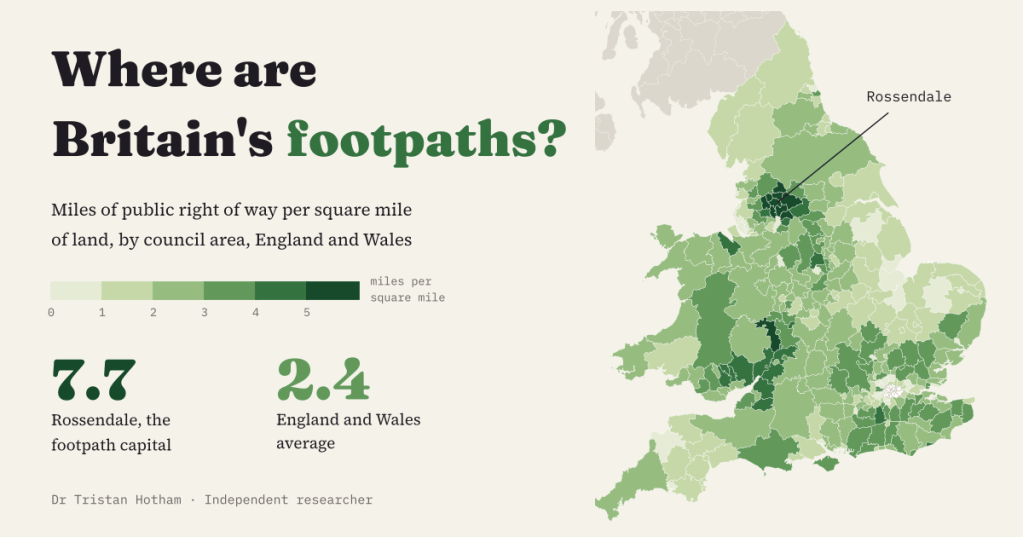
Which part of Britain has the most public footpaths per square mile? From the councils’ own data: Rossendale, with 7.7 miles of right of way per square mile, and the South Pennine mill towns fill the top ten. Powys has the most per person; Harrow the fewest of anywhere with a definitive map.
-
The rocks beneath: a geological map in the colours of 1969
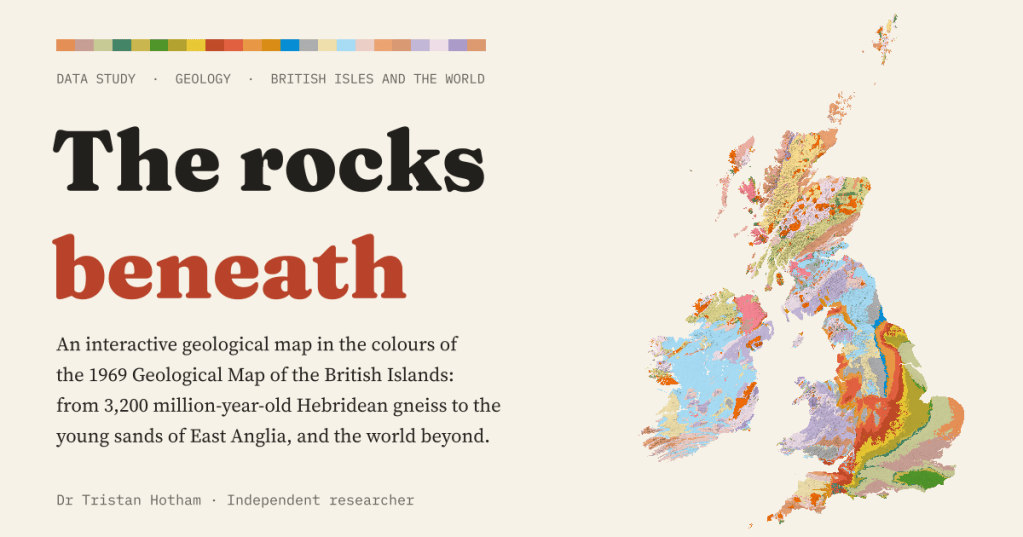
An interactive geological map of the British Isles and the world, coloured with the palette of the 1969 Geological Map of the British Islands. Carboniferous rocks cover 17.5% of Great Britain, and England’s layers get younger all the way to London.
-
Drowned and rising: Britain and the world at every sea level
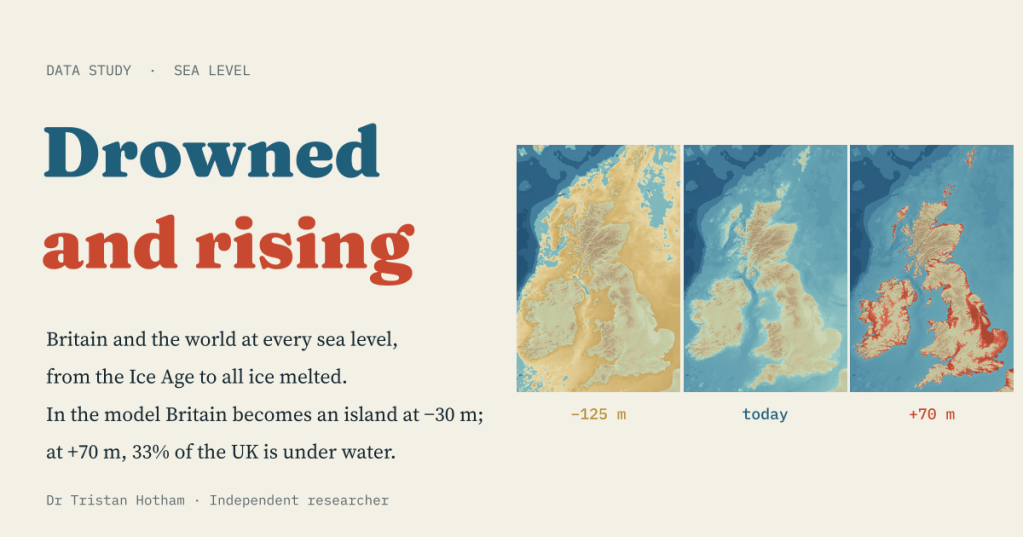
A bathtub model of every sea level from the Ice Age to an ice-free world. In the model Britain becomes an island at −30 m; at +70 m, 33% of the UK is under water.
-
How many months a year are pleasantly warm?
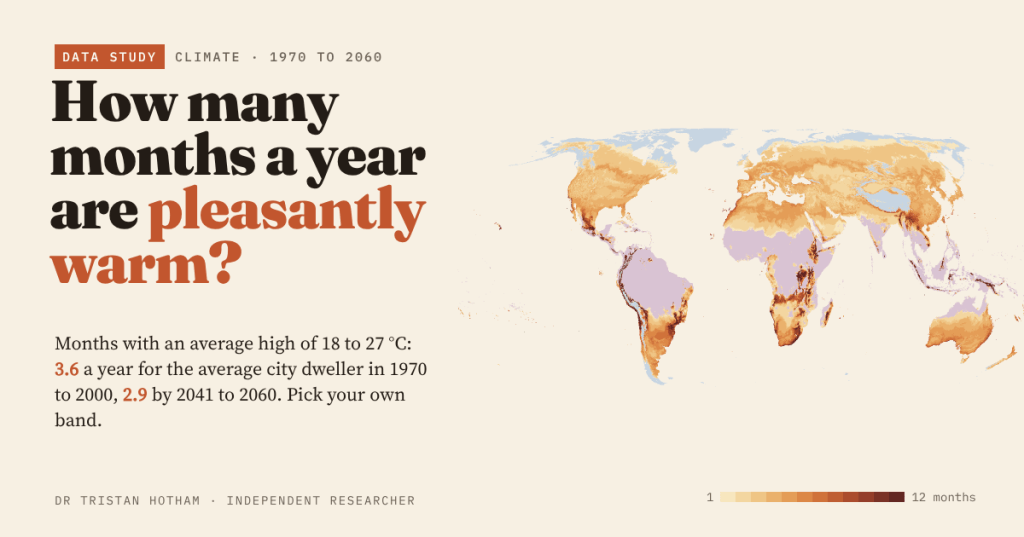
Count the months whose average afternoon high is 18 to 27 °C and the average city dweller gets 3.6 a year. By 2041 to 2060 it is 2.9: months are lost at the hot end, gained at the cool end, and you can pick your own band.
-
Sun and rain: the world’s sunshine against its rainfall
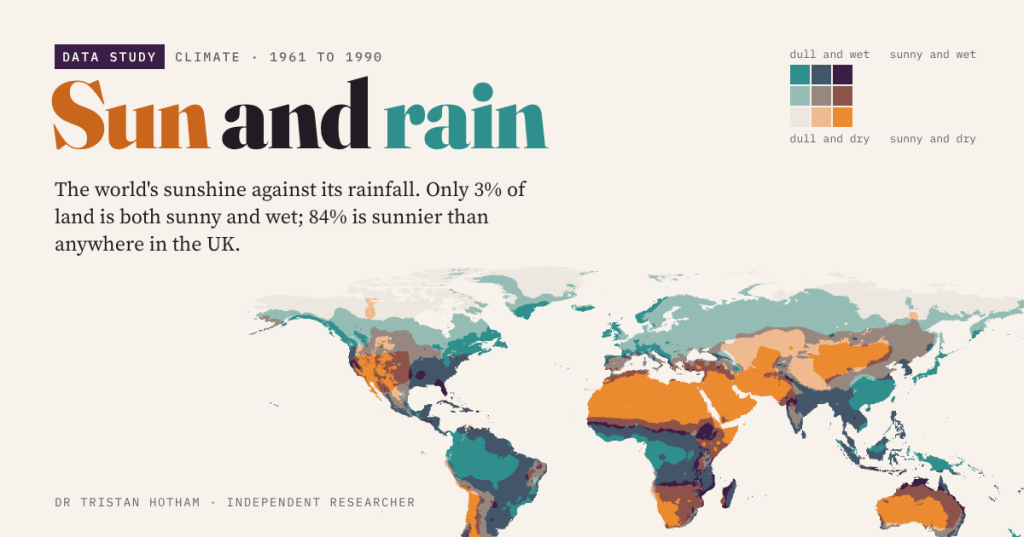
Sunny and dry, sunny and wet, dull and dry, dull and wet: a map of the world’s sunshine against its rainfall. Only 3% of land is both sunny and wet, and 84% is sunnier than anywhere in the UK.

