
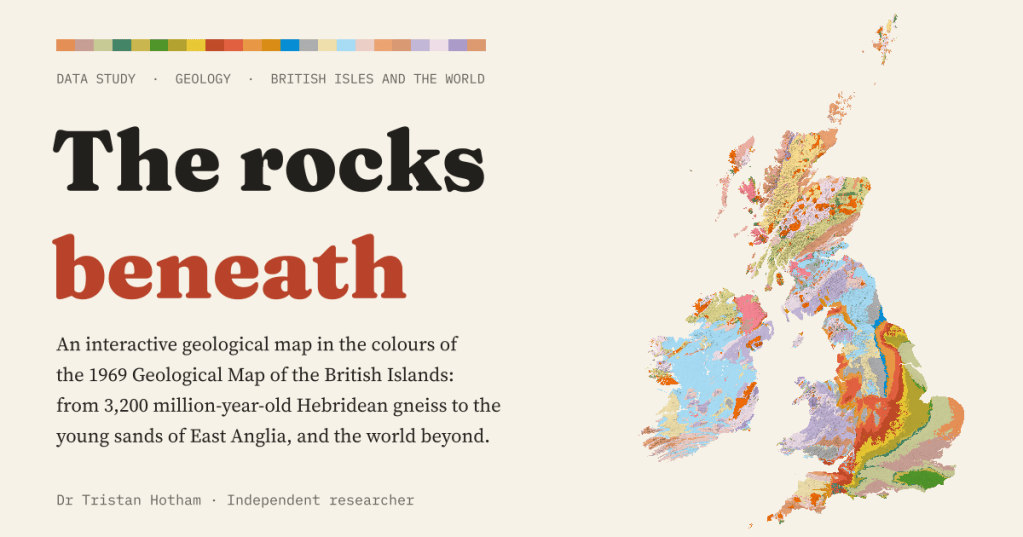
What lies under your town, how old is it, and why do England’s rocks get younger all the way to London? I built an interactive geological map of the British Isles and the world in the colours of the classic 1969 survey map.
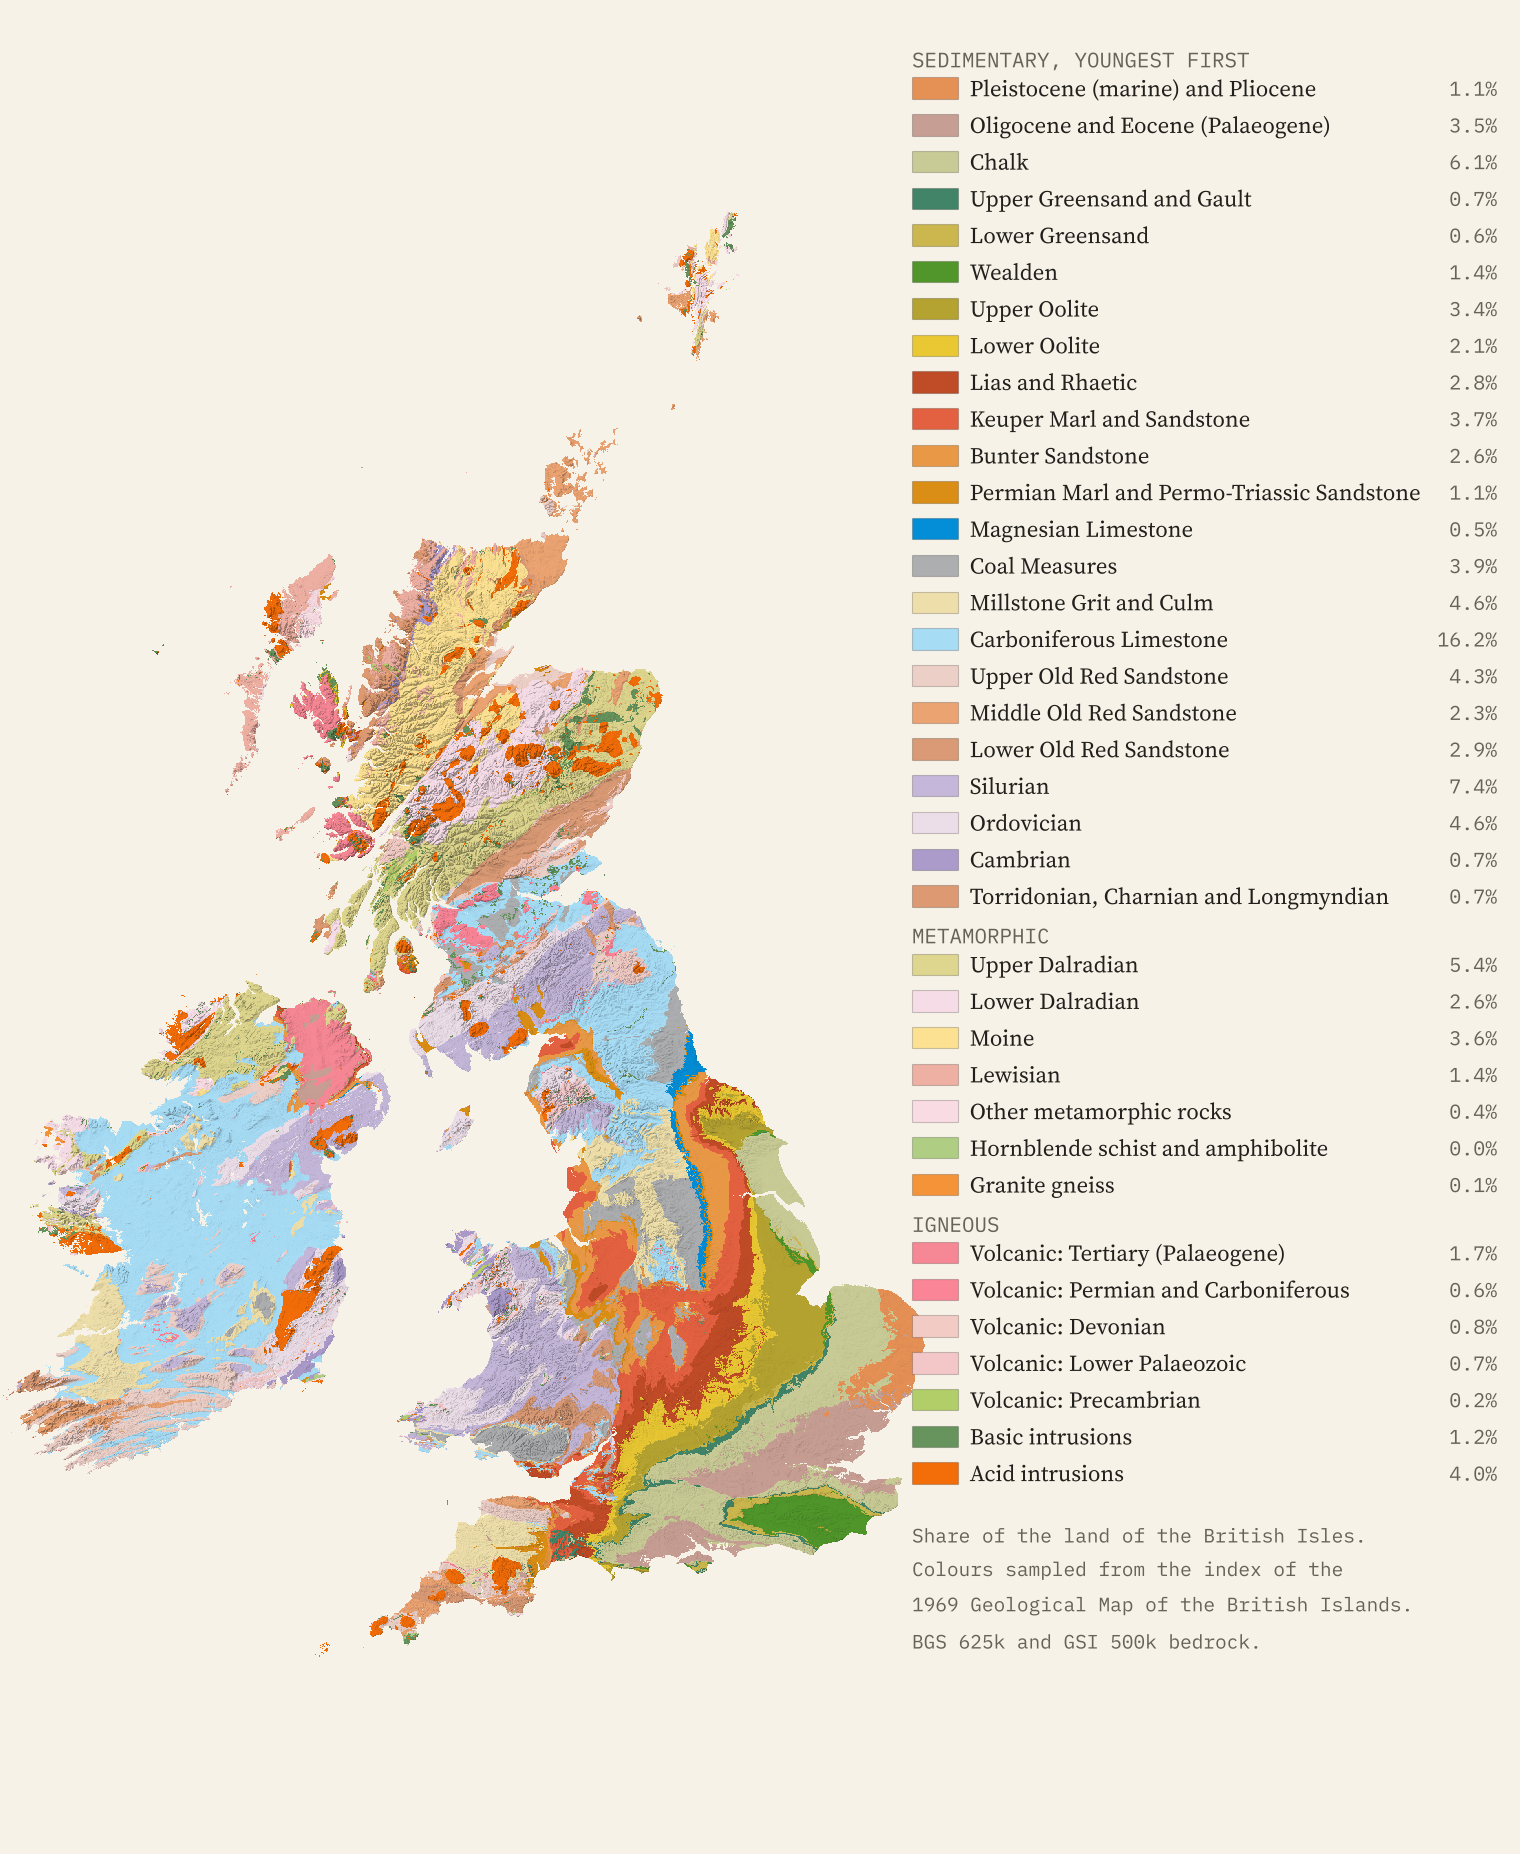
Some maps you learn by heart without trying. For anyone who took geology at school, the 1969 Geological Map of the British Islands is one of them: a single sheet with an index of about forty colours, the Chalk a soft grey green, the Coal Measures grey, the Carboniferous Limestone sky blue, the Keuper Marl brick red and the old Highland schists in pale pinks and yellows. The map is still in copyright, so I have not copied it. But I have borrowed its colours.
Today the surveys publish their maps as open data. I took the British Geological Survey’s 1:625,000 bedrock map for Great Britain, Northern Ireland and the Isle of Man, Geological Survey Ireland’s 1:500,000 map for the Republic, and Macrostrat’s compilation of the world’s geological maps, sampled the colours from the 1969 index and keyed them to today’s rock units. The result is a map you can click anywhere: 315,859 square kilometres of the British Isles and the rest of the world’s land beyond.
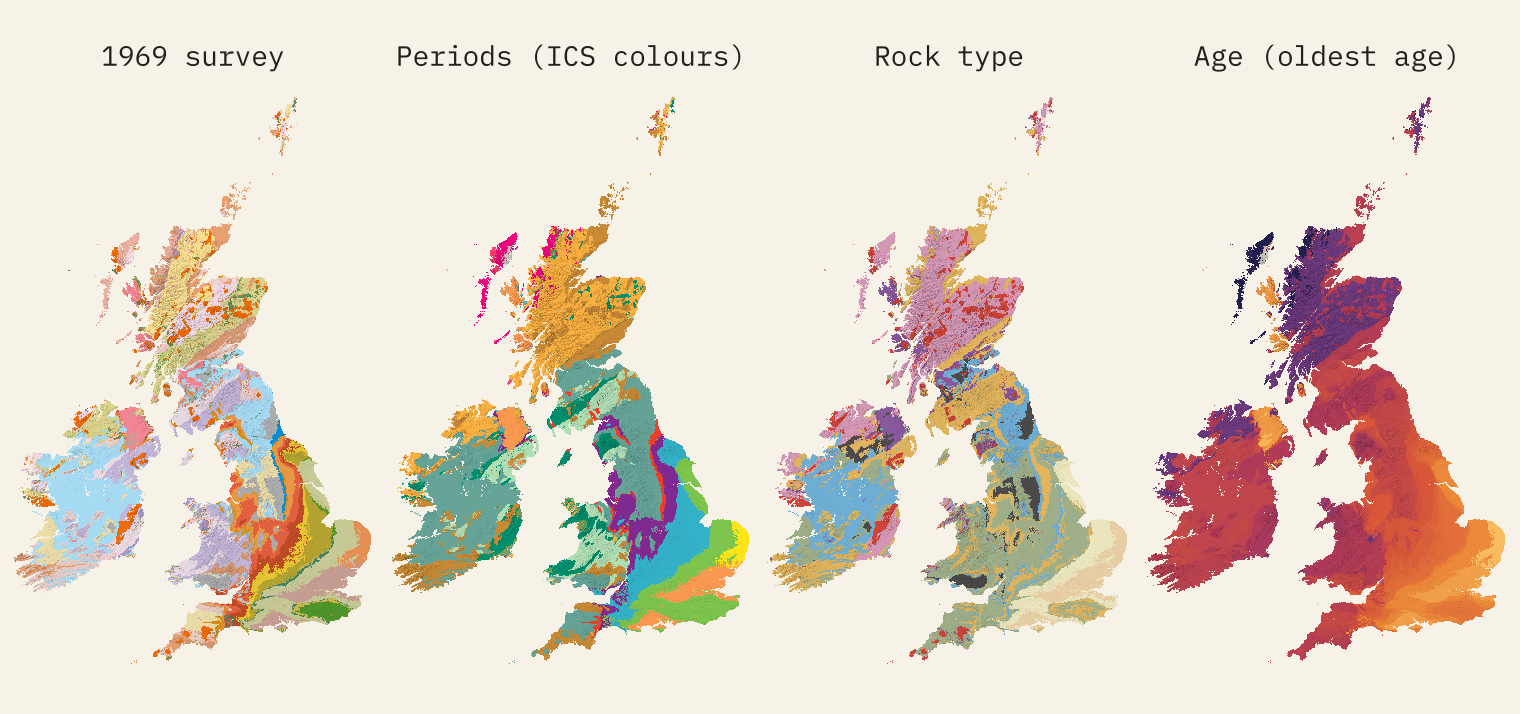
Four ways to colour a rock
The 1969 palette is lovely but idiosyncratic: it was built around the rocks that mattered to Britain, such as coal, building stone and water. So the page also offers the international colours for each geological period, a colouring by rock type, and a smooth scale of age. There is a time slider too. Press play and the islands build themselves from the oldest rock to the youngest, starting with 3,200 million-year-old gneiss in the Outer Hebrides.
The layer cake
The thing the map shows best is the tilt of England. Its rocks were laid down in layers and then tipped gently down to the south east, so their edges come to the surface in bands that get younger as you head towards London. I drew a straight line from the summit of Scafell Pike to Charing Cross and read the rock every kilometre. It starts on Ordovician rocks about 458 million years old, among the old volcanoes of the Lake District, crosses the Carboniferous of Lancashire, the red Triassic of the Midlands, the Jurassic of the Cotswold edge and the Chalk of the Chilterns, and ends on the Thames Group, the London Clay country, about 55 million years old.
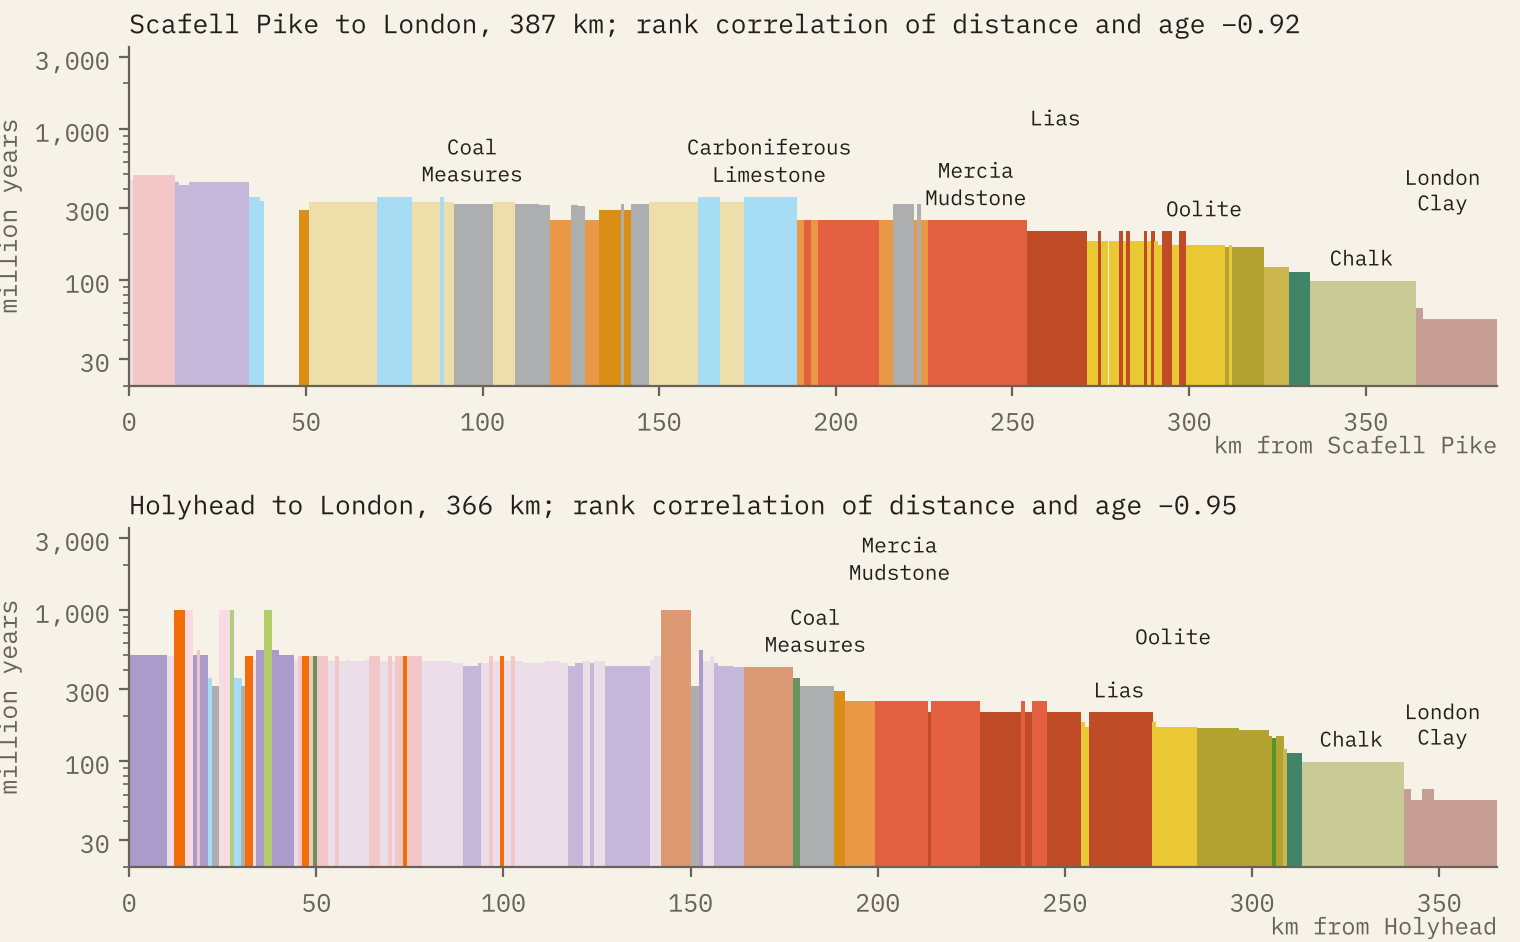
The rank correlation between distance along the line and the age of the rock is −0.92; from Holyhead it is −0.95. Across the whole of England and Wales, how far south east a point lies and how old its rock is correlate at −0.76. The places that break the pattern, the Lake District, Wales and the Pennines, are the older, harder, crumpled rocks, and that is why they are the high ground.
What Britain is made of
More of Great Britain is Carboniferous than anything else: 17.5% of the land, from the limestone dales to the coalfields. Ireland is even more Carboniferous, 54.7% of the Republic, which is why the 1969 map paints the middle of the island pale blue. Scotland is mostly older: 40.8% of it is Neoproterozoic, the schists of the Highlands. Wales is Silurian and Ordovician, and England’s south and east are the Jurassic and Cretaceous.
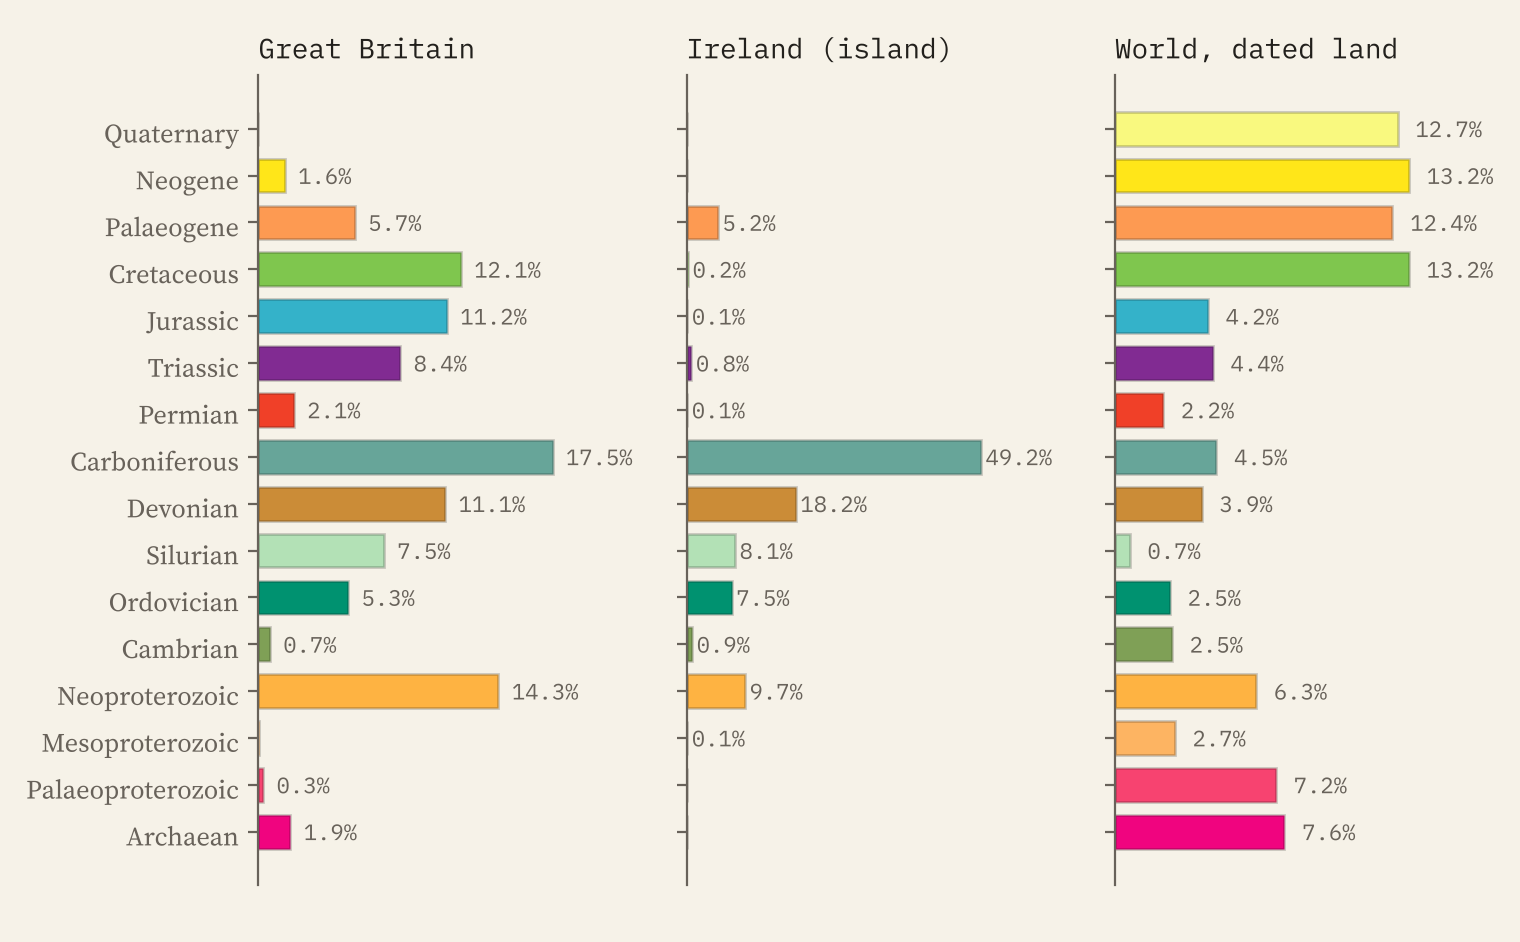
The oldest rocks of all are the Lewisian gneisses of the Outer Hebrides and the far north west, which began as igneous rocks between about 3,200 and 2,800 million years ago. They cover 4,299 km² on the map. The youngest bedrock is in Norfolk and Suffolk, shelly sands and gravels from the last few million years, and the youngest volcanic rocks are the lavas of Skye, Mull and Antrim, about 60 million years old.
Coal towns and white cliffs
The Coal Measures cover just 5.1% of Great Britain. But 264 of the 1,426 cities and towns in the Ordnance Survey’s gazetteer stand on them, 3.6 times what their area alone would give. Sheffield, Leeds, Bradford, Swansea, Newcastle, Wolverhampton, Stoke-on-Trent, Wigan: the map of the coal is a map of industrial Britain.
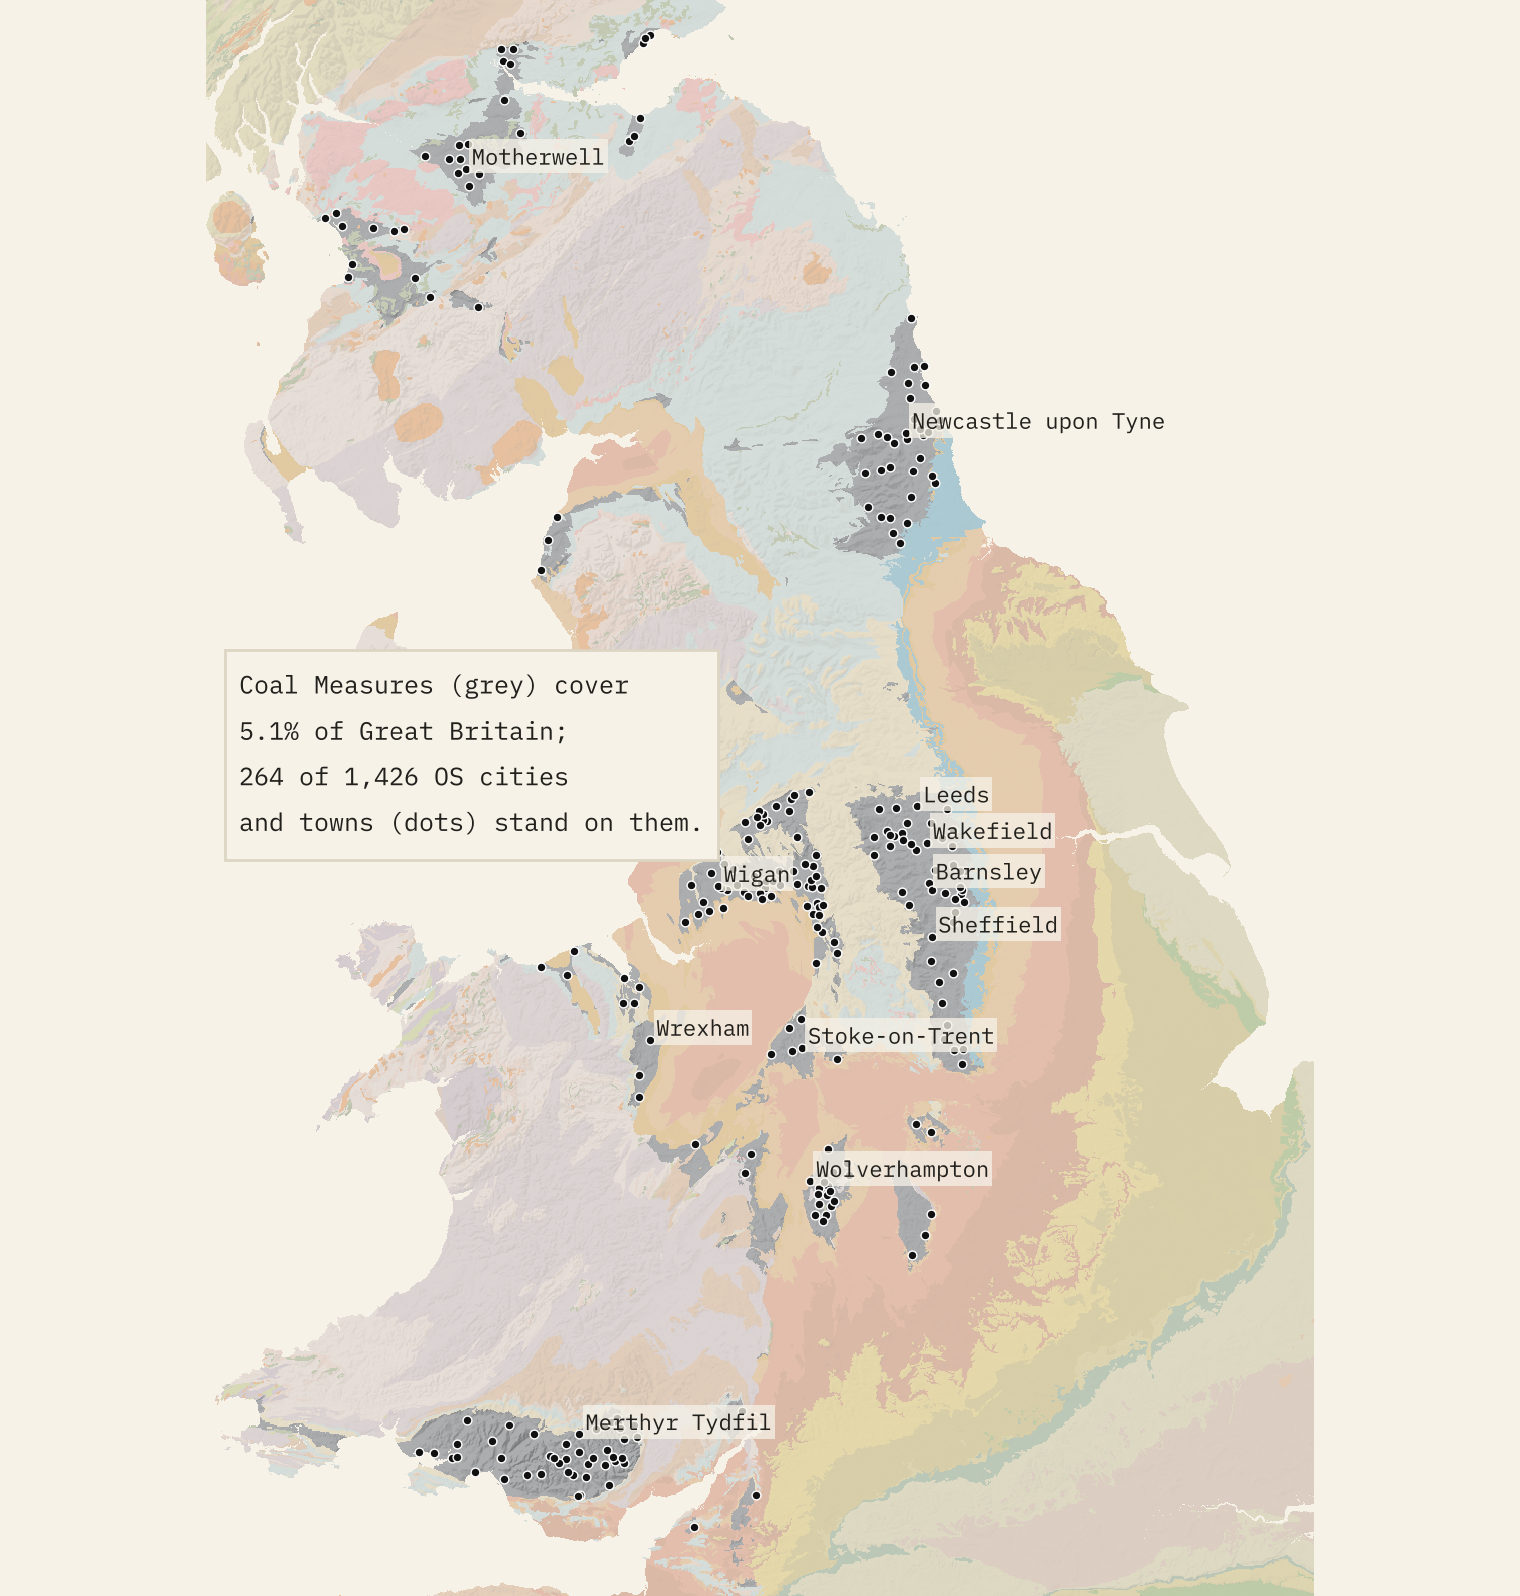
The map of the coal is a map of industrial Britain.
The Chalk covers 8.3% of Great Britain and 14.7% of England. I checked the famous white cliffs on the map: Dover, Beachy Head, the Seven Sisters, Old Harry, Durdle Door and Flamborough Head all fall on the White Chalk Subgroup.
Under the boulder clay
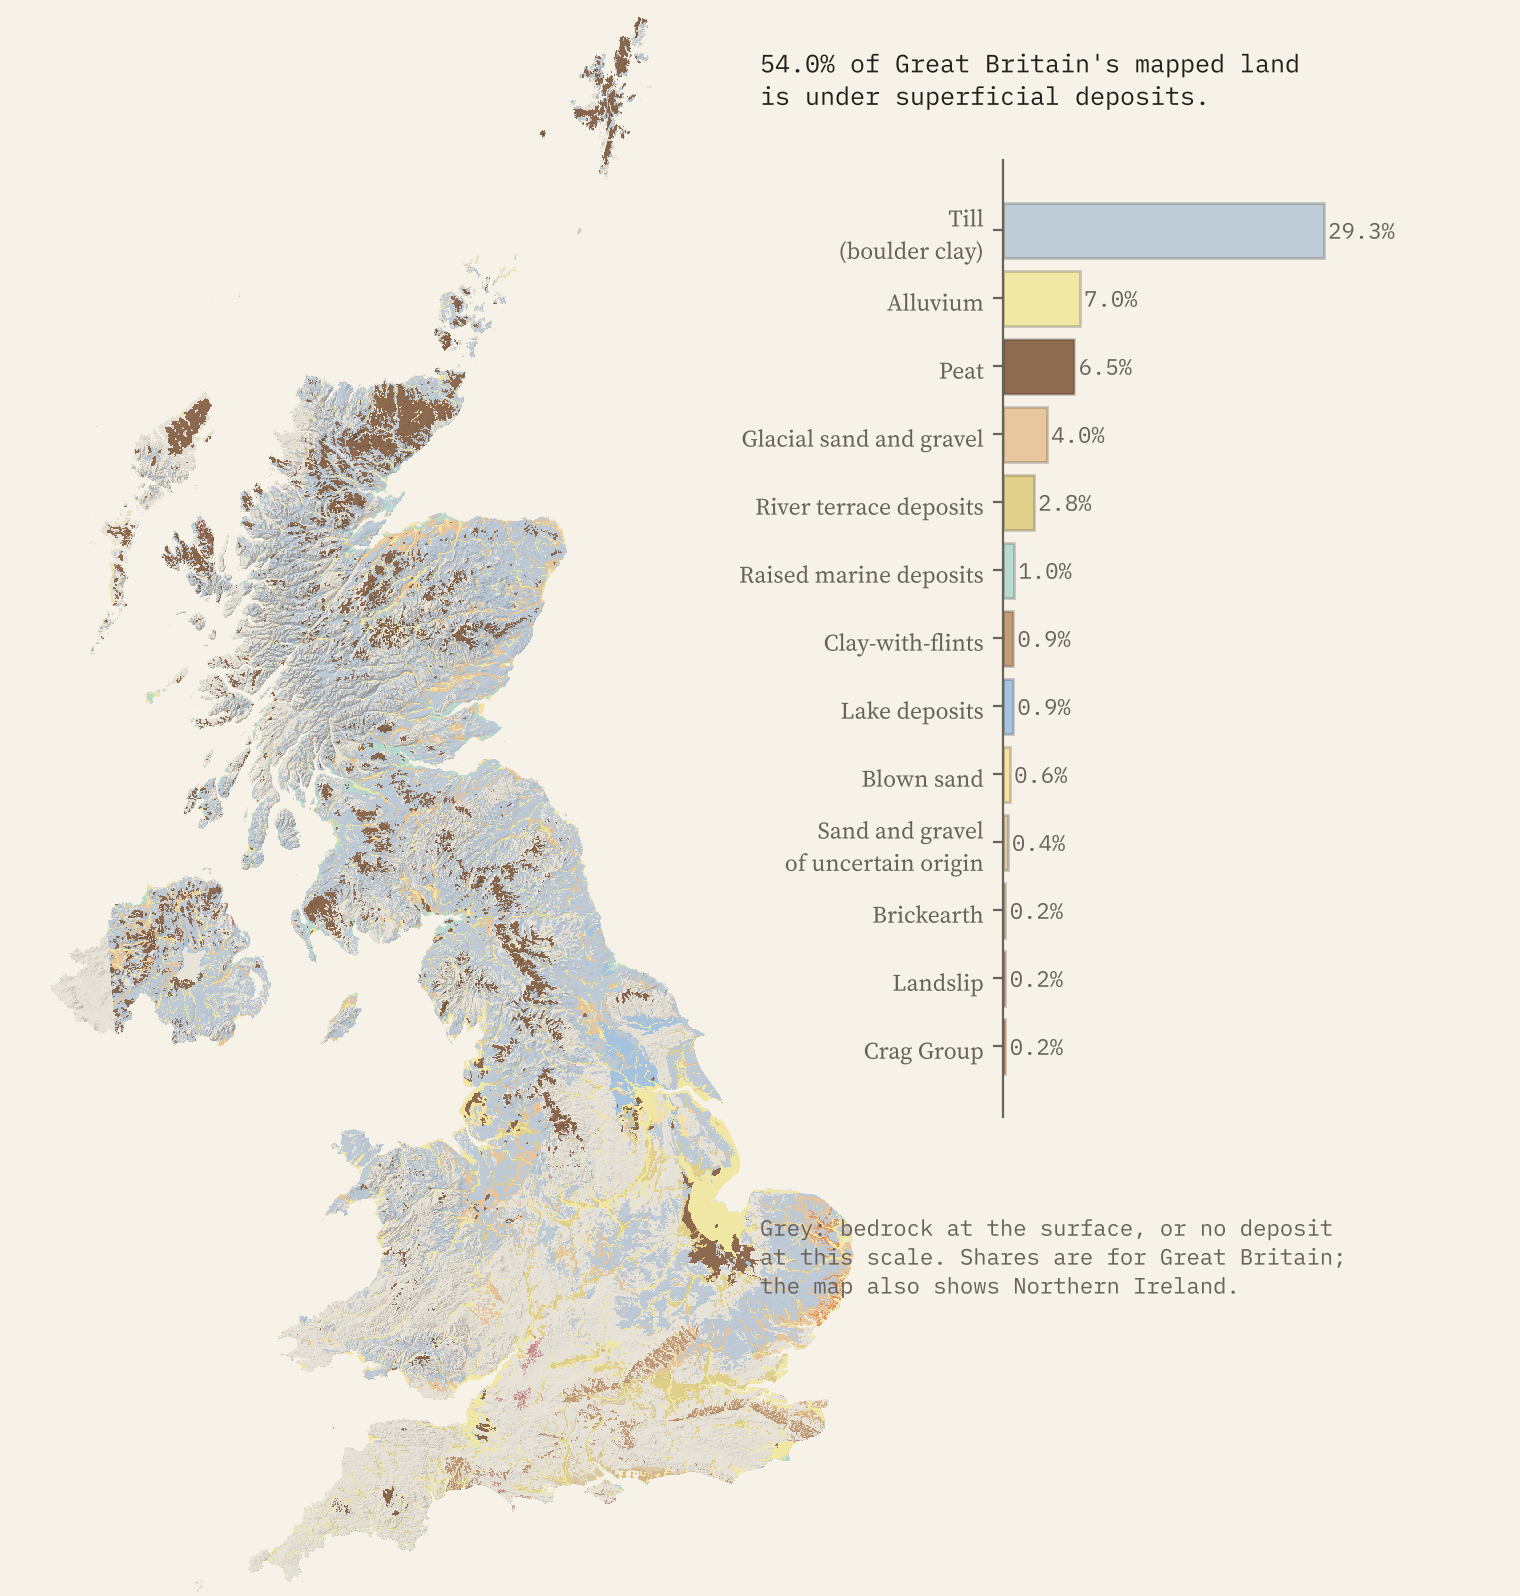
Bedrock is what lies under everything else, and in Britain there is a lot of everything else. The ice sheets and their meltwater, the rivers and the bogs have covered 54.0% of Great Britain with loose deposits, 65.1% of Scotland. Till, the stony clay left by glaciers that older maps call boulder clay, covers 29.3% on its own. You can lay these deposits over the bedrock on the interactive map.
And the world
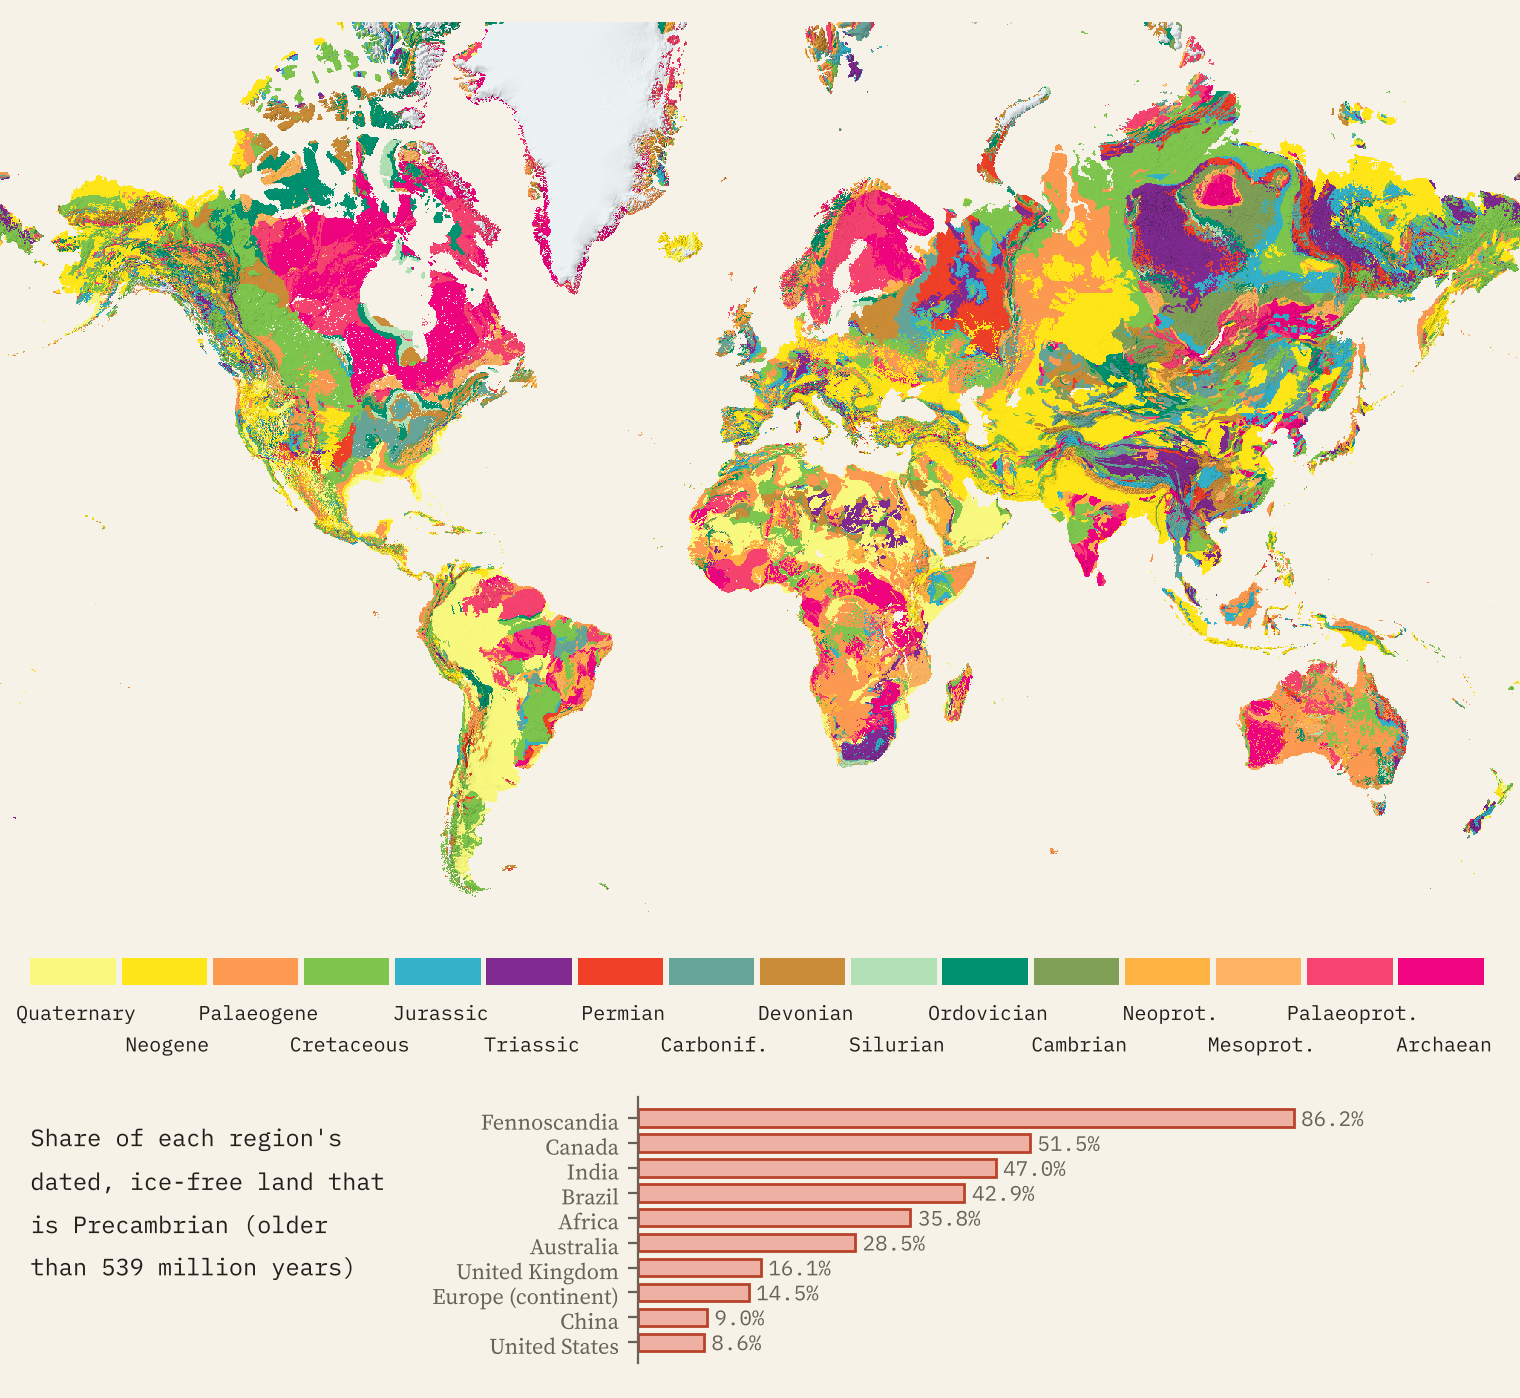
Switch to the world view and the same palettes spread over every continent. 23.8% of the world’s dated, ice-free land on the map is Precambrian, gathered in the old shields: 86.2% of Norway, Sweden and Finland, 51.5% of Canada, 47.0% of India. Click any rock and the page will light up everywhere else on Earth with rocks of the same age.
How I did this
I drew every polygon of the BGS and GSI bedrock maps onto a grid in the web map’s own projection, about 175 m on the ground, and gave each unit an age range, a period, a rock type and a 1969 colour class. The colours come from the 1969 map’s index, sampled pixel by pixel; where the old map named a rock group (Chalk, Lias, Oolite, Coal Measures, Old Red Sandstone, Moine, Dalradian, Lewisian and so on) today’s units of that group take its colour. The world map is Macrostrat’s generalised compilation at about 5 km, which stitches together regional maps of very different detail, so it has seams. All the areas are measured on these grids, and all the numbers are in the project’s results file.
These are small-scale maps, so lines are smoothed and small outcrops merged, and a unit’s age is the range it spans rather than the age of every rock in it. If you want to know what is under your own garden, the BGS’s own detailed maps are the place to go next.
Notes and sources
- Bedrock and superficial deposits, Great Britain and Northern Ireland: BGS Geology 625k (DiGMapGB-625), British Geological Survey, Open Government Licence. Contains British Geological Survey materials © UKRI 2026.
- Bedrock, Ireland: Geological Survey Ireland and GSNI 1:500,000 bedrock geology. Contains Irish Public Sector Data (Geological Survey Ireland) licensed under a Creative Commons Attribution 4.0 International (CC BY 4.0) licence.
- World: Macrostrat (CC BY 4.0), built from the geological maps of the Arctic, North America, Europe, Africa and Australia and a generalised geology of the world.
- Colours: sampled from the index of the Geological Map of the British Islands, 5th edition (1969); the map itself is not reproduced. Lewisian ages: BGS Earthwise.
- Places: OS Open Names (OGL v3) and GeoNames (CC BY 4.0). Relief: AWS Terrain Tiles. Land: Natural Earth.
- Paper, data and code: Zenodo and GitHub.
- I wrote the text, with drafting and editing assistance from Claude (Anthropic), which also helped prepare the analysis code. I reviewed and checked all text and results.

