
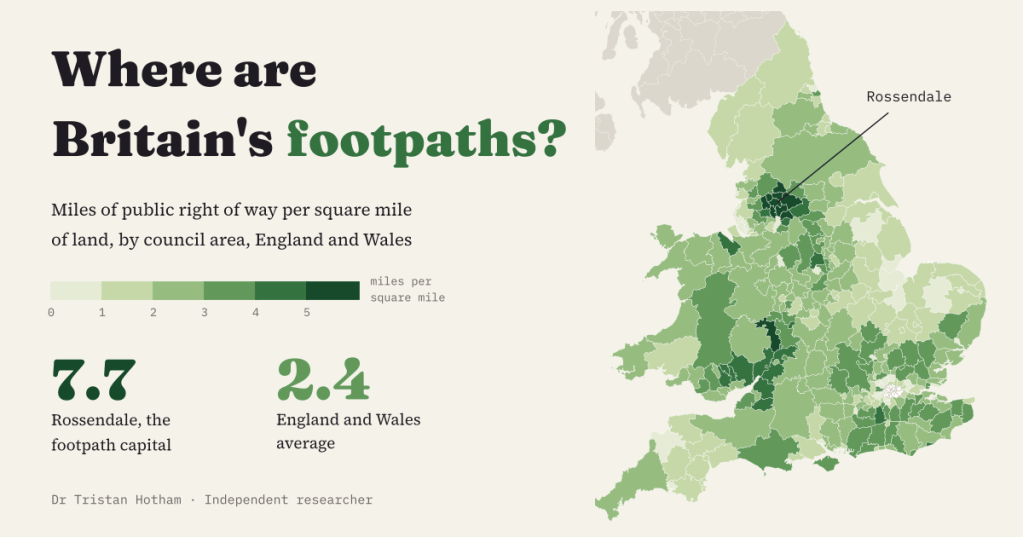
England and Wales keep a legal record of their public paths. Every county council and unitary authority holds a definitive map of the footpaths, bridleways and byways that anyone may use, and most now publish it as open data. So which part of the country has the most of them for every square mile of land?
I took the councils’ own rights of way files for 149 highway authorities, gathered into one format by rowmaps.com, placed every section of path in the council area it runs through and divided the miles by the land area. The interactive version has a map, a league table of all 318 council areas and a postcode search.
The South Pennines win
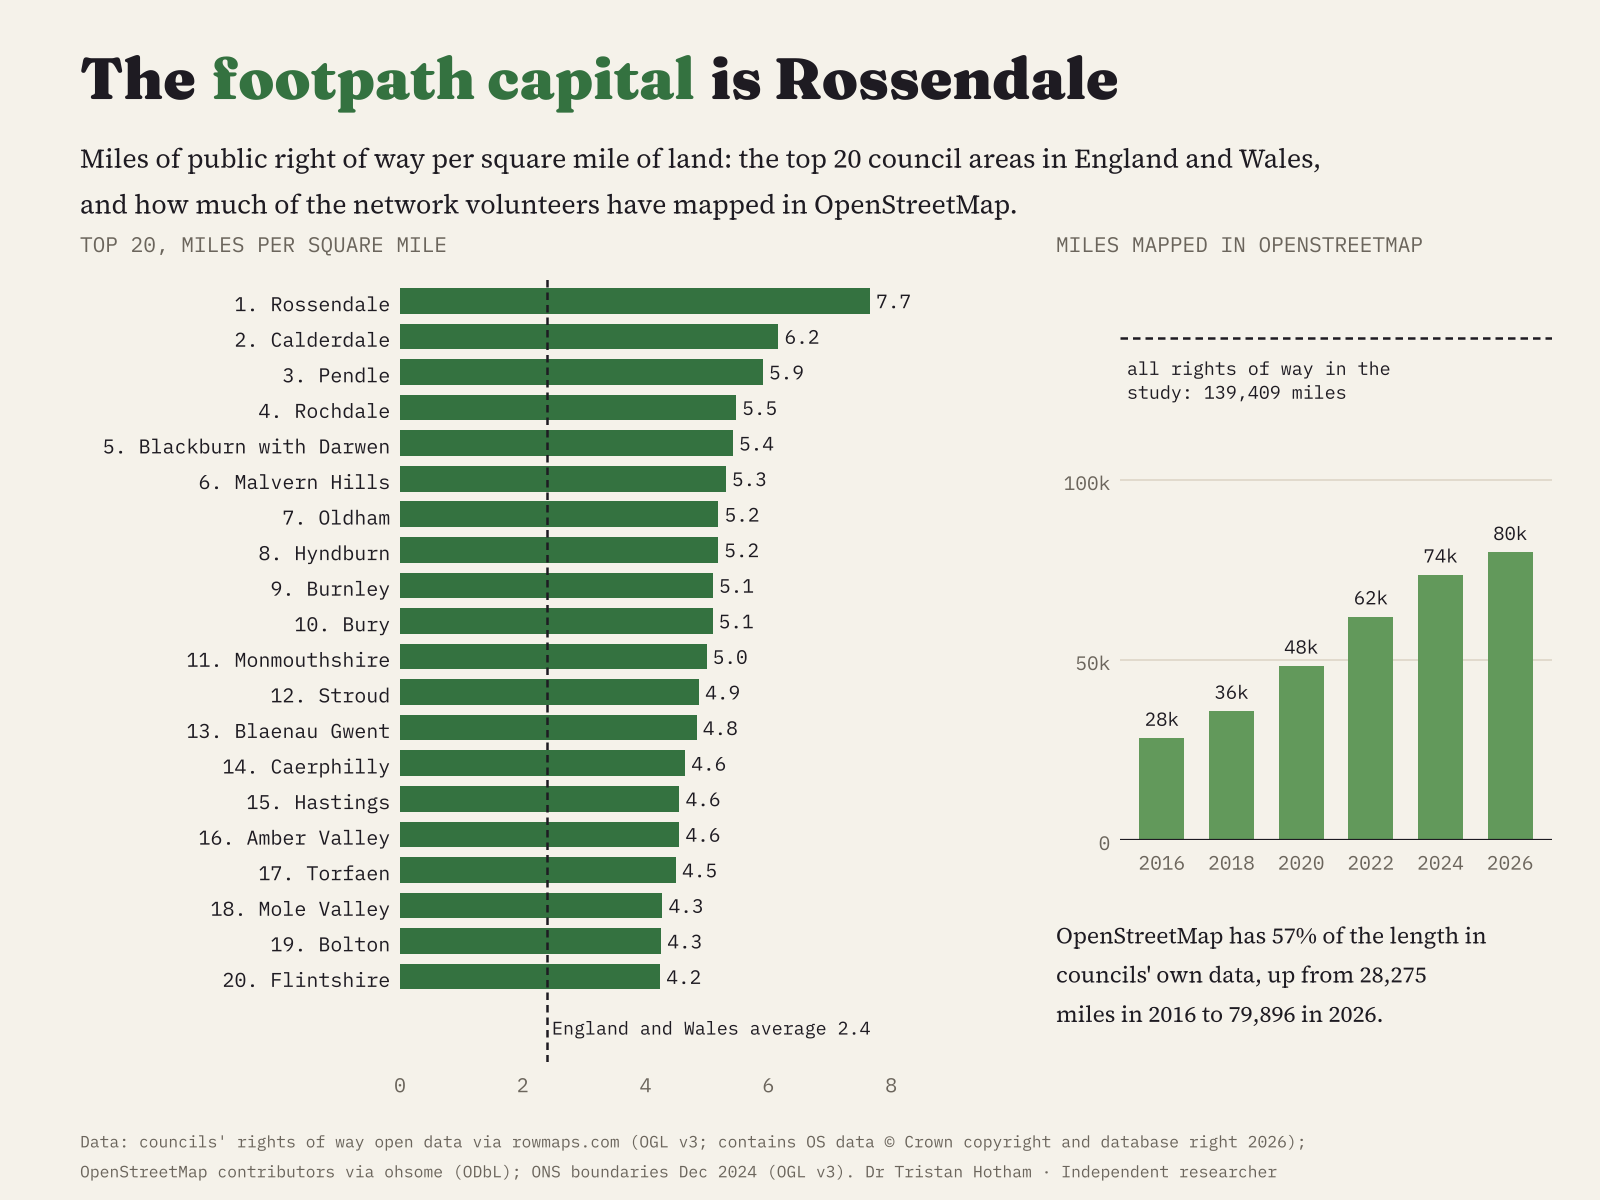
England and Wales have 139,409 miles of public right of way in the council data, 2.4 miles for every square mile. Rossendale has the most: 407 miles of path in 53 square miles, 7.7 per square mile, more than three times the average. Behind it come Calderdale (6.2), Pendle (5.9), Rochdale (5.5) and Blackburn with Darwen (5.4). Nine of the top ten sit in one block of hill country either side of the Lancashire and Yorkshire border. Only Malvern Hills, sixth, breaks the run.
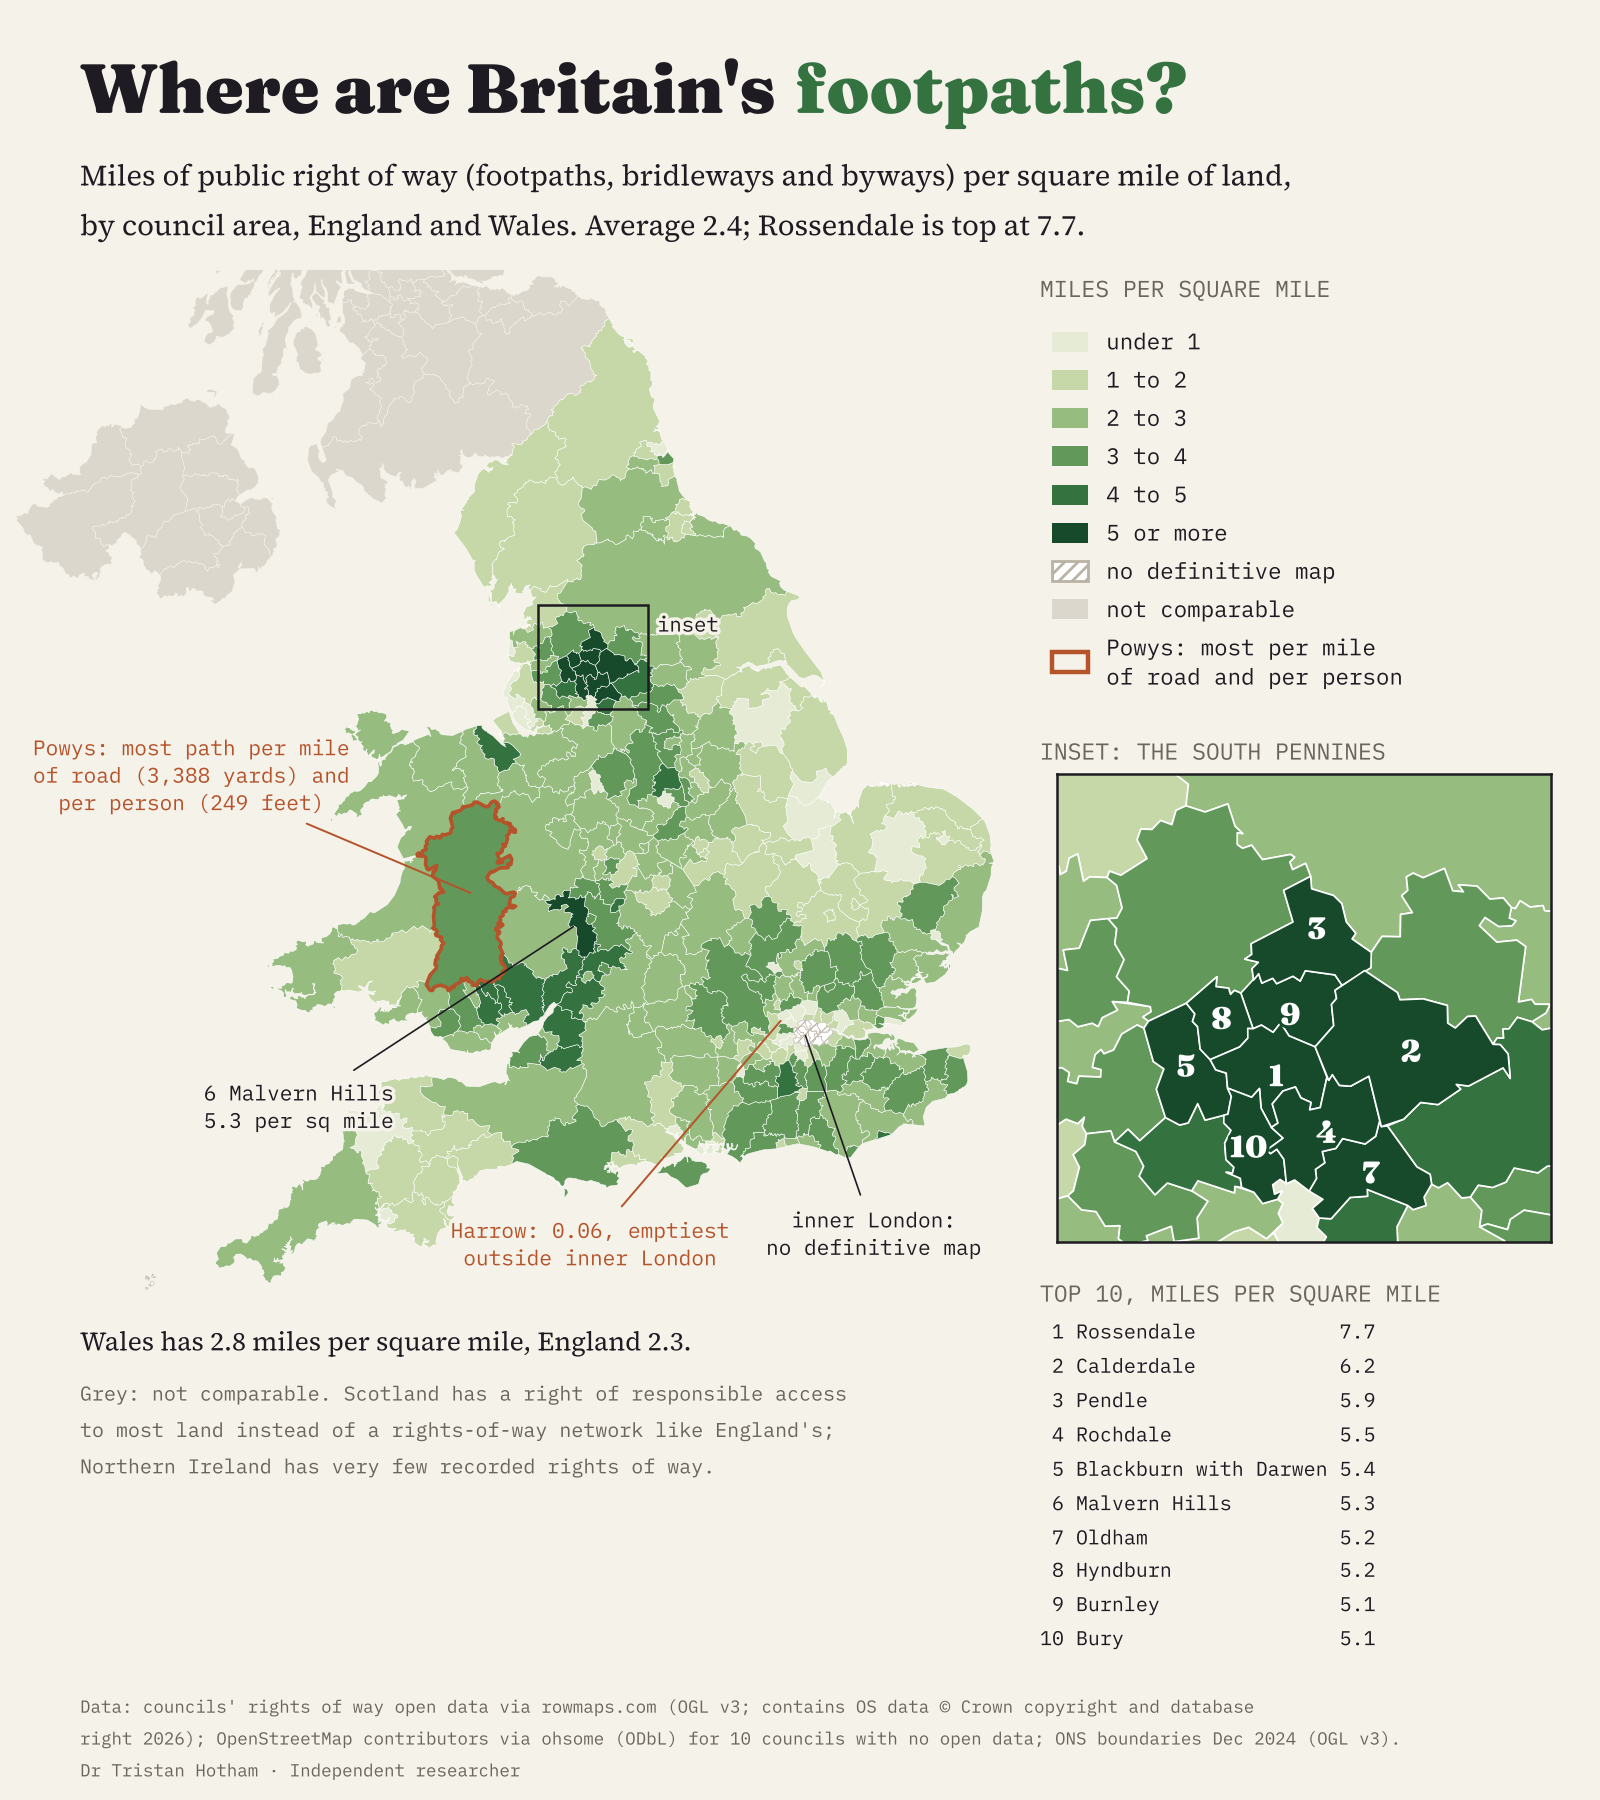
These hillsides were lived on and worked long before the mills, in farms and weaving hamlets joined by packhorse tracks and field paths. The towns grew in the valleys, but the paths on the slopes above them stayed on the maps drawn up in the 1950s. That is a likely reason, not something the data can prove.
It depends how you count
Per square mile favours small, crowded districts. Count yards of path per mile of road instead and rural mid Wales comes out top: Powys has 3,388 yards of right of way for every mile of road, then Malvern Hills and Rossendale. Per resident, Powys wins by a distance, with 249 feet of path for every person, then Ceredigion and Gwynedd. Yet per square mile Powys is only 72nd: it is huge, and its paths are spread thin across it. Wales as a whole has 2.8 miles per square mile, England 2.3.
At the bottom are the big towns and outer London. Harrow has 0.06 miles per square mile, the fewest of any council with a definitive map, then Enfield, Norwich, Havering and Barnet. Most of their old field paths were built over or turned into streets before the maps were drawn.
The gaps
The fourteen inner London boroughs were never required to make a definitive map, so they have no rights of way to count. Scotland has no definitive maps at all: since 2003 there is a right of responsible access to most land, so paths do not need to be recorded rights of way. Northern Ireland has very few. Neither is ranked.
I started with OpenStreetMap, where volunteers tag paths as public footpaths and bridleways. It turned out to hold only 57% of the council length. Where a council’s data has been loaded into it, as in Lancashire, Essex and Lincolnshire, the two agree within a few per cent; elsewhere large parts are missing. It is filling fast, though: the mapped length has almost tripled since 2016. I use the council data, and OpenStreetMap only for the ten councils that publish none.
Caveats. Council data are an interpretation of the definitive map, not the map itself. Each path section is placed by the midpoint of its ends, so paths crossing a boundary fall on one side. And a mile of path counts the same on a moor or in a town: this measures how much right of way there is, not how good the walking is.
Explore the map and find your council · Data and code on GitHub · Archived on Zenodo
Sources: council rights of way open data via rowmaps.com (Open Government Licence v3; contains OS data © Crown copyright and database right 2026); OpenStreetMap contributors via the ohsome API (ODbL); ONS boundaries and mid-2025 population estimates (OGL v3). AI use: written with drafting, data and coding help from Claude (Anthropic).

