
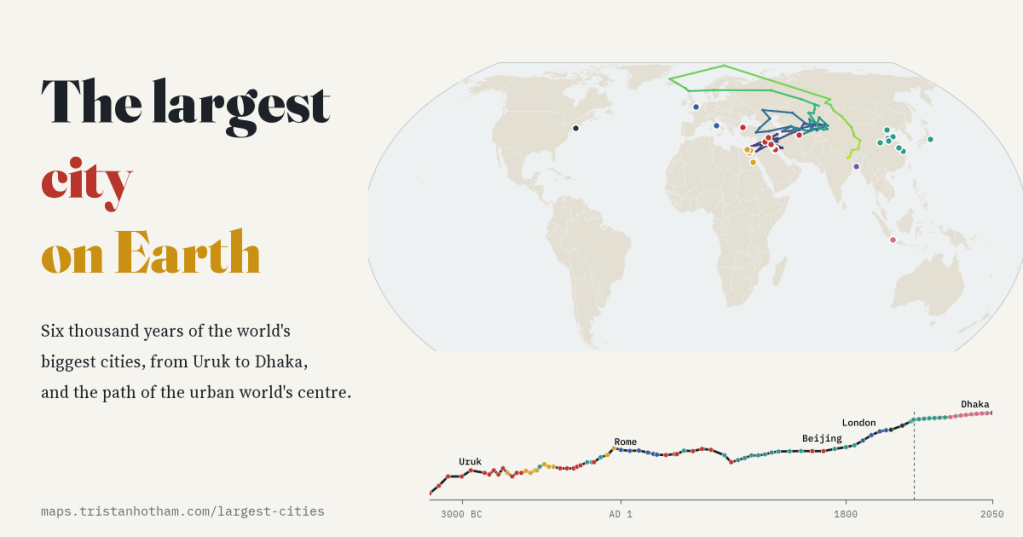
Six thousand years ago the largest city on Earth had perhaps 80,000 people. Today it has 41.9 million. I followed the crown from Uruk to Dhaka, through Babylon, Rome, Chang’an, Baghdad, Beijing and London, and watched the centre of the urban world wander across the map.
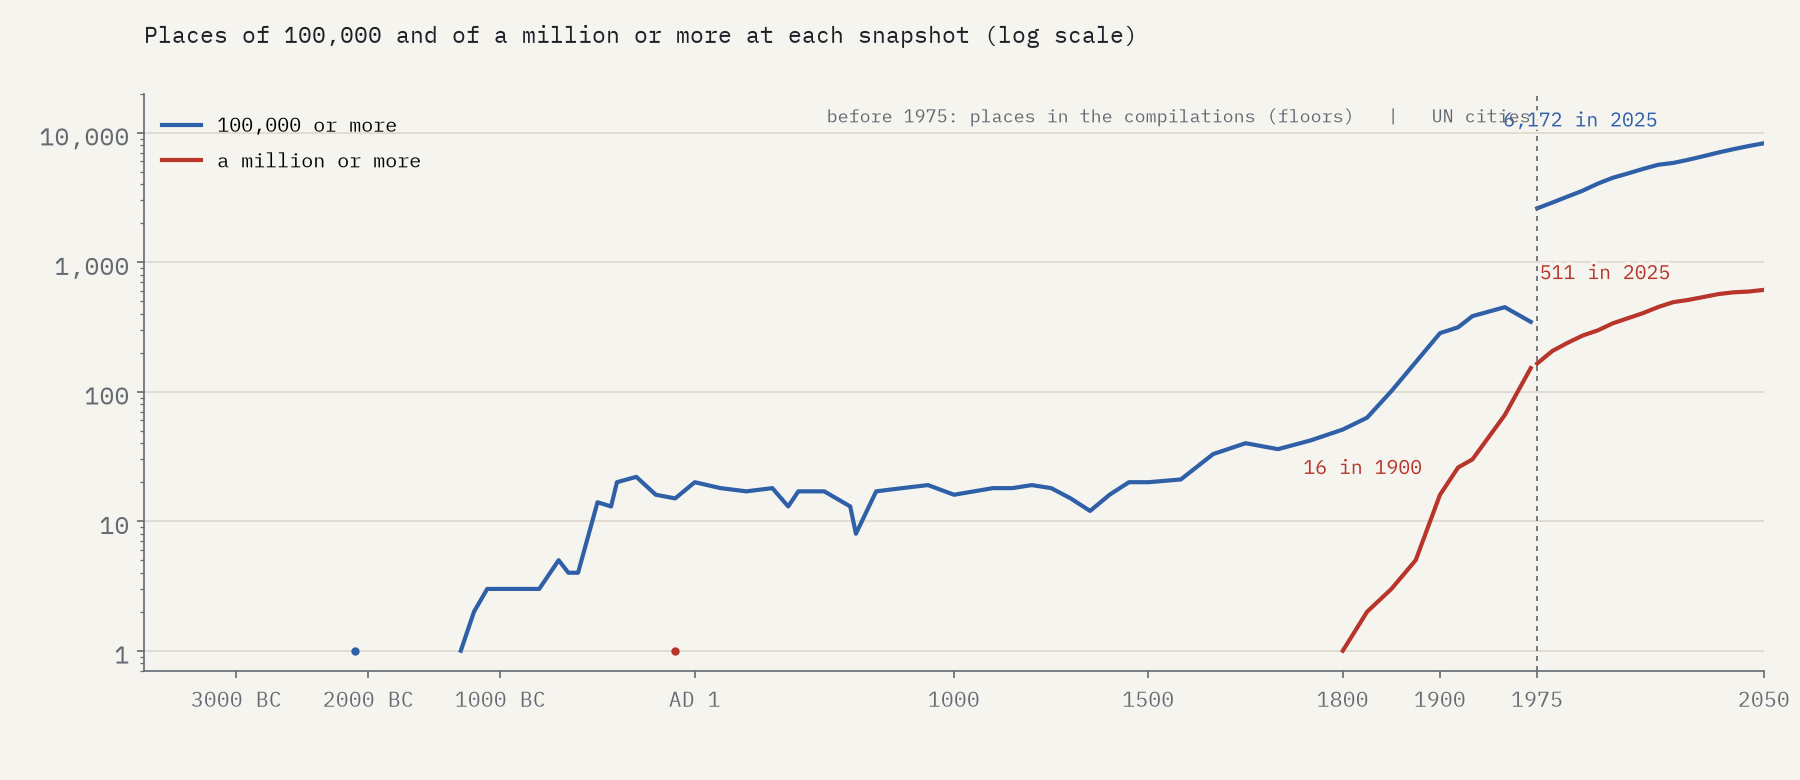
Which was the biggest city in the world in 1000 BC? Or AD 1000, or 1800? Nobody counted, so the answers rest on the patient work of historians who pieced together city sizes from walls, tax rolls, travellers and early censuses. Two of them, Tertius Chandler and George Modelski, produced the best known compilations, and in 2016 Meredith Reba, Femke Reitsma and Karen Seto turned both into an open, geocoded dataset. After cleaning it holds 1,654 places and 10,033 population estimates from 3700 BC to 1975. For 1975 onwards I used the United Nations’ new World Urbanization Prospects 2025, which projects every city to 2050.
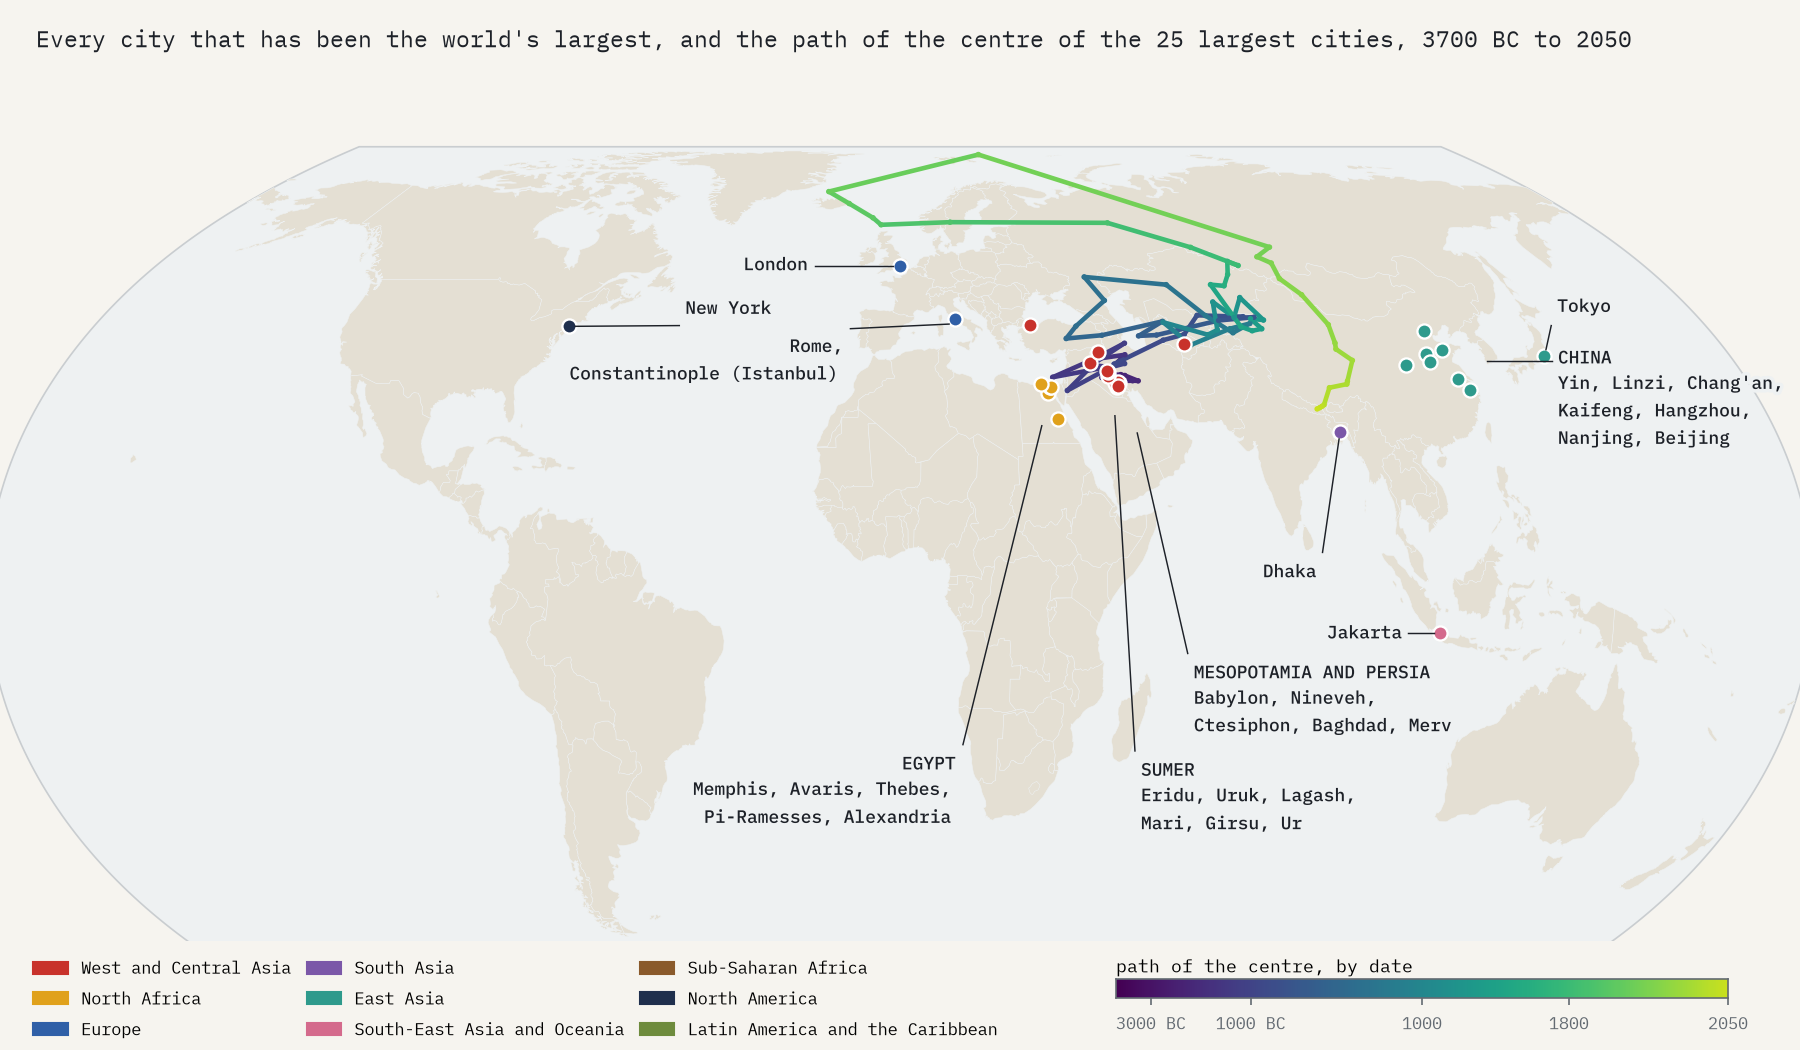
Put them together at 85 snapshot dates and 30 different cities have been the largest on Earth on their own.
From Uruk to Rome
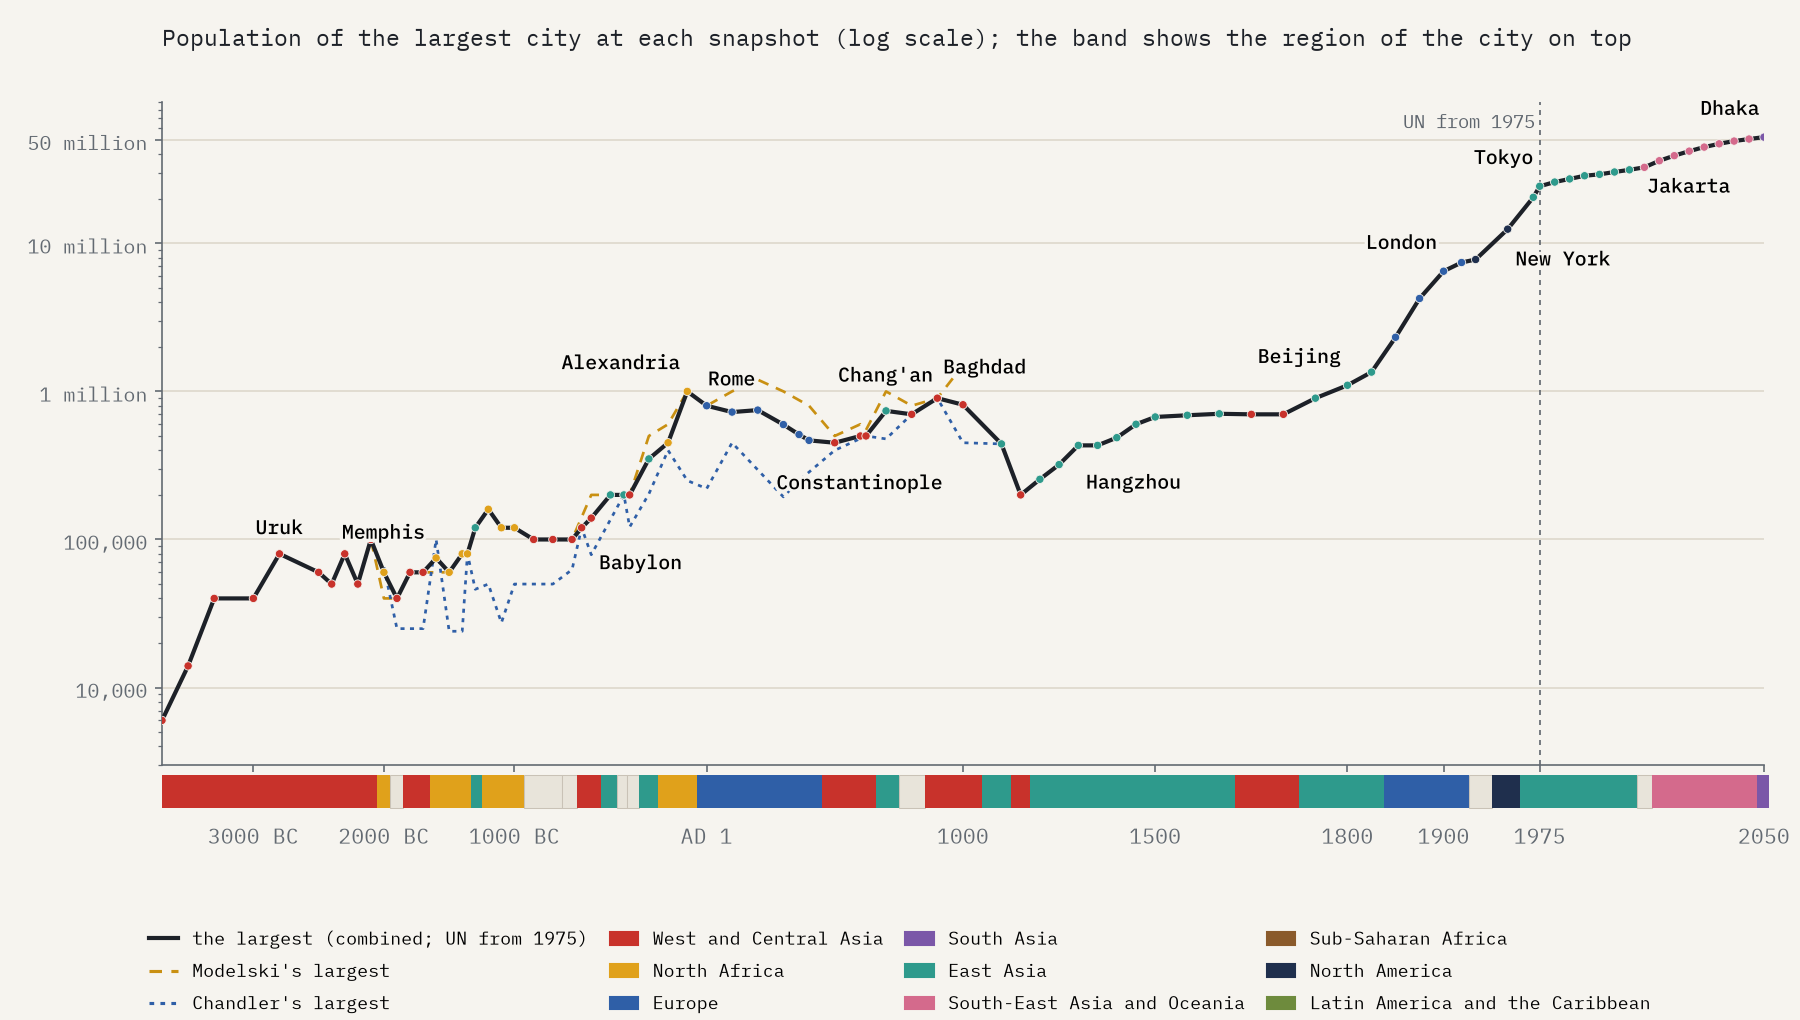
Uruk, in the marshes of southern Iraq, was the largest city in every snapshot from 3500 to 2800 BC, reaching about 80,000 people. Its record stood for 700 years, until Ur reached 100,000 in 2100 BC. Then the crown moved between the capitals of Egypt and Mesopotamia, Memphis, Babylon, Thebes and Pi-Ramesses, with one interruption: Yin, the capital of China’s Shang kings, in 1300 BC. In the first millennium BC the big cities multiplied in China and India too, and Linzi, Alexandria and then Rome took the lead. Modelski puts Rome at 1,200,000 in AD 200; Chandler, more cautious, never gives ancient Rome more than 450,000.
Seven centuries of Chinese capitals
After Rome came Constantinople, Ctesiphon, Chang’an (today’s Xi’an) and Baghdad. From 1100 the crown settled in China: Kaifeng, Hangzhou, Nanjing and then Beijing were the largest city in the world in 13 of the 16 snapshots between 1100 and 1825, broken only by Merv in Central Asia and Ottoman Istanbul. Strikingly, the largest city stayed below a million all that time: between 1100 and 1750 it never held more than 900,000 people in these estimates.
The largest city of 2025 is 38.1 times the size of the largest city of 1800.
London’s century
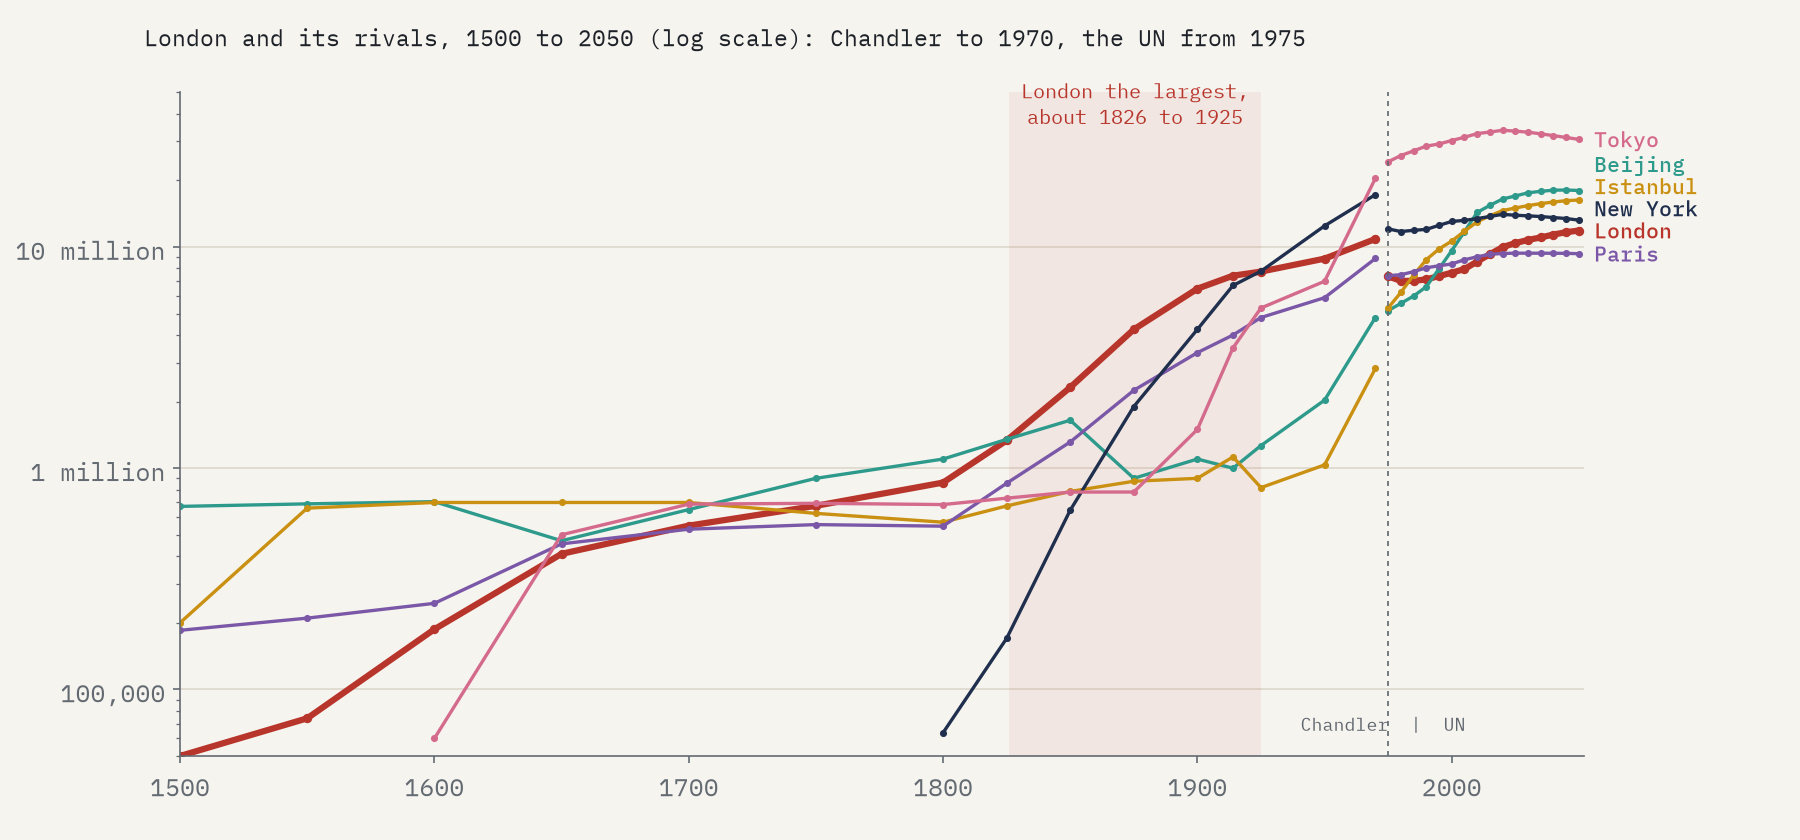
London was 13th in Chandler’s list in 1600. By 1800 it was second only to Beijing, and in 1825 it was 1.1% behind, closer than either figure can be trusted. By 1850 it was clearly the largest city in the world, with 2,320,000 people, and it stayed on top in every snapshot to 1914. In 1925 Chandler has New York and London level, 0.4% apart. Drawing straight lines between the snapshots, London’s reign ran from about 1826 to 1925: roughly 99 years.
The wandering centre
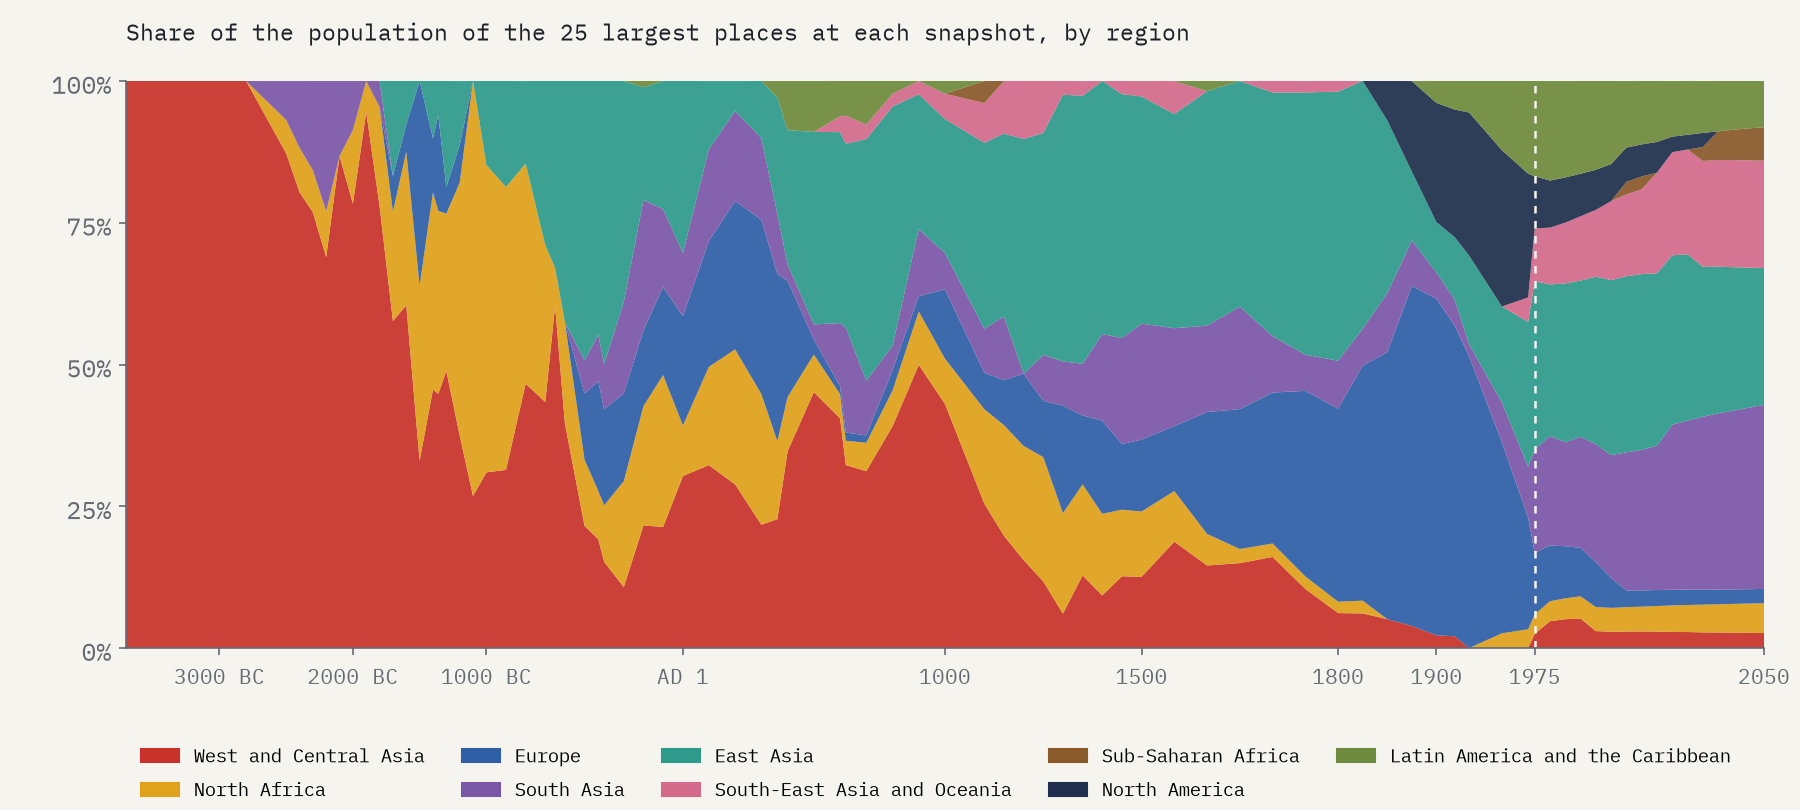
To see the big picture I found the population-weighted centre of the 25 largest cities at every snapshot. Until 800 BC it never left Mesopotamia and its neighbours. As China and India filled up with cities it moved east to Central Asia, and it stayed there, between 59°E and 82°E, from AD 500 to 1825. Then the industrial cities of Europe and America yanked it 5,102 km west in a single century: in 1900, 13 of the 25 largest cities were European. Since 1975 it has raced back east and south. In 2025 it sits over eastern Tibet, and by 2050 it is projected over eastern Nepal, with 19 of today’s 25 largest cities in Asia and 1 in Europe.
What counts as a city?
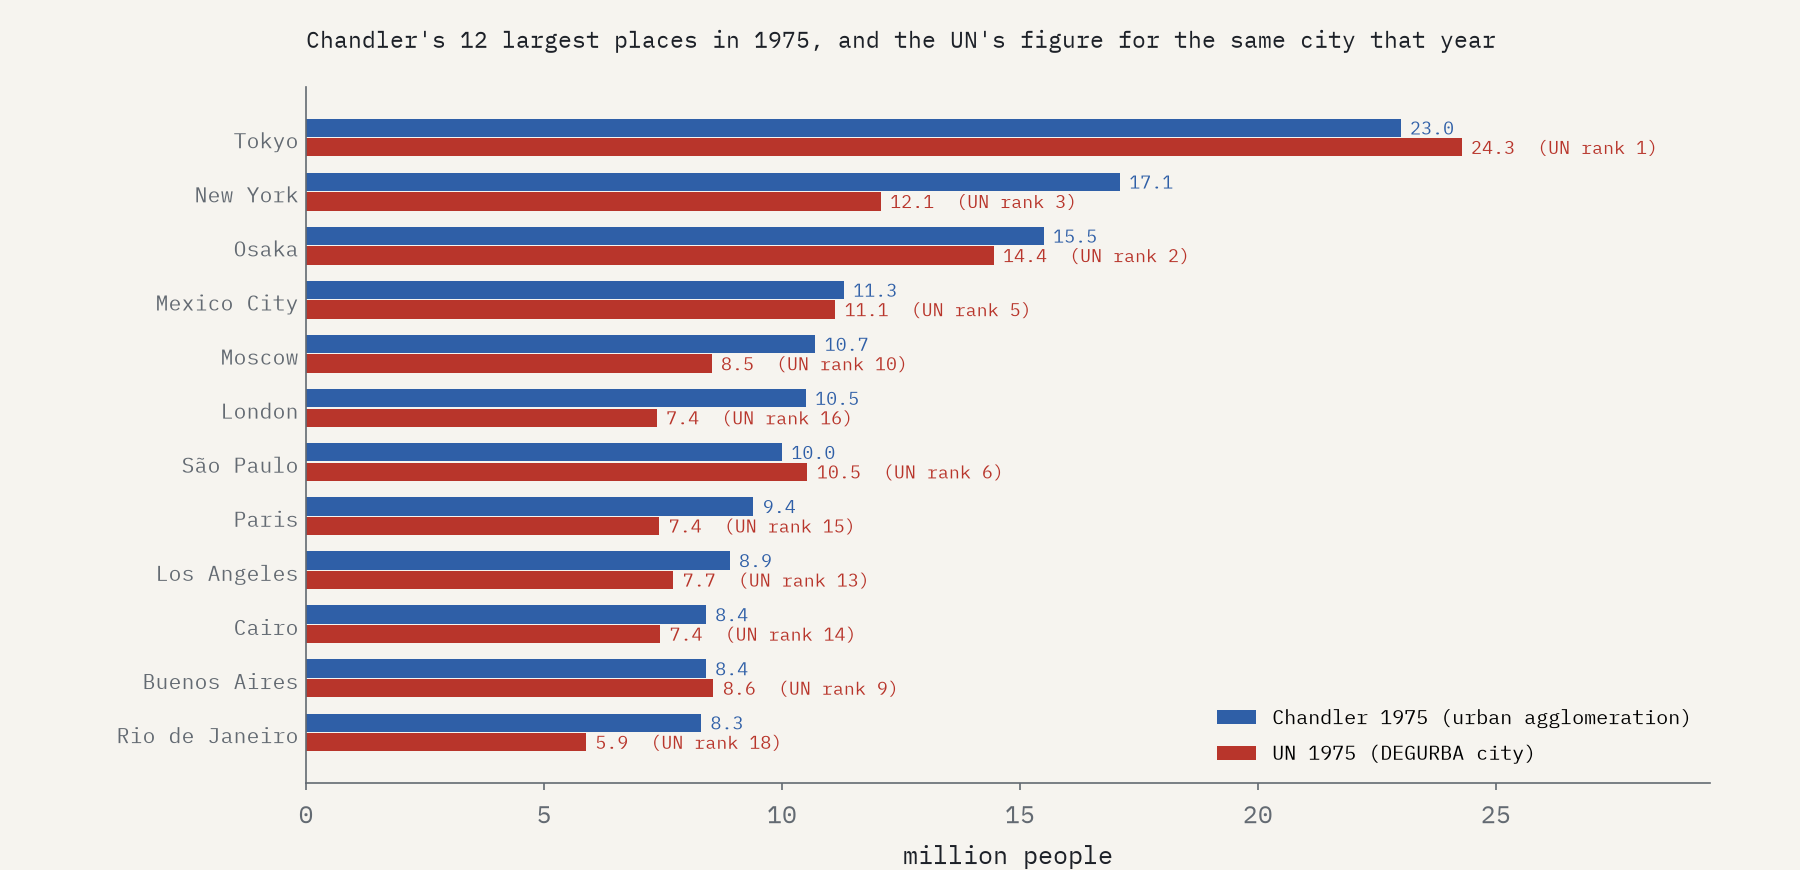
The UN’s 2025 revision defines a city by the Degree of Urbanisation: a continuous cluster of 1 km grid squares with at least 1,500 people per square kilometre and at least 50,000 people in all, drawn from satellite-based population grids, ignoring official boundaries. That reshuffles the familiar rankings. Jakarta, not Tokyo, is the largest city in the world in 2025, with 41.9 million, and Dhaka is second with 36.6 million. American cities shrink, because their suburbs are not dense enough. You can see the effect at the 1975 seam: Chandler’s New York had 17,100,000 people, the UN’s 12,076,416. I have not blended the two kinds of figure: before 1975 is Chandler and Modelski, after is the UN.
2050
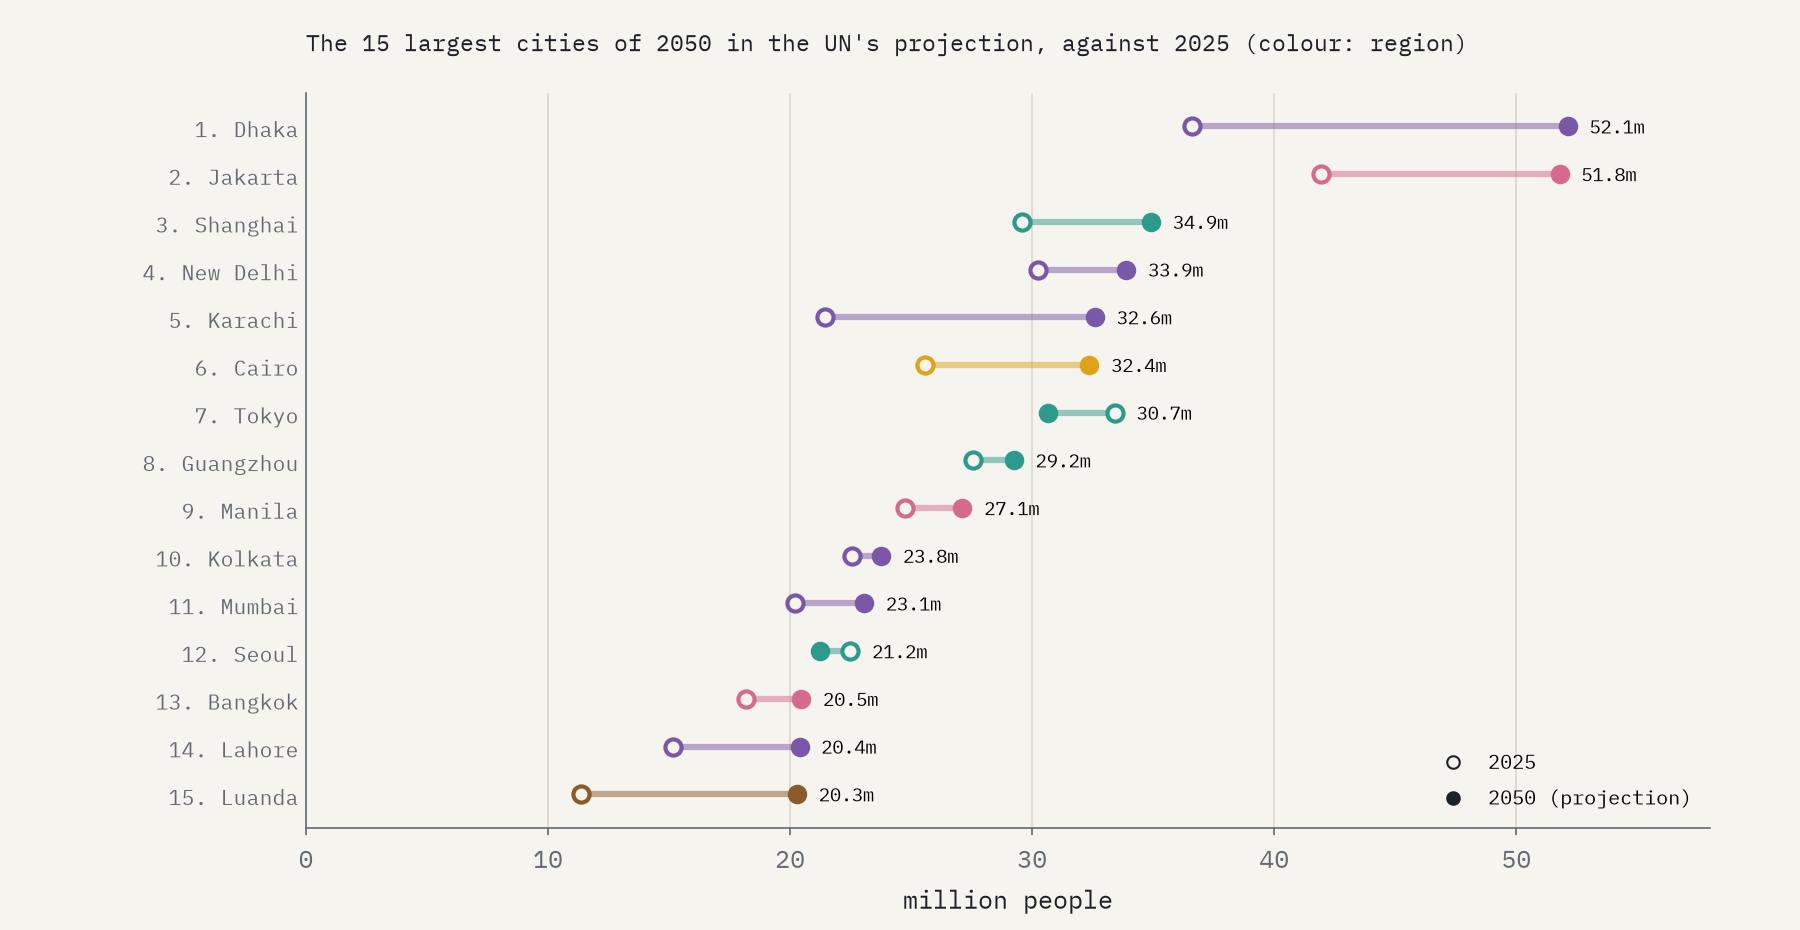
In the UN’s projections Dhaka passes Jakarta in 2049 to become the largest city in the world, with 52.1 million against Jakarta’s 51.8 million, a margin of 0.7%, small enough to call a tie. Karachi gains 11.2 million and enters the top ten. Luanda grows by 78%, Dar es Salaam by 69%, and Lagos climbs from 26th to 21st. Tokyo, the largest city in the world for a generation, is projected to shrink to 30.7 million.
How sure can we be?
Not very, before the modern era. Where both compilations have figures for at least 8 places, they name a different largest city at 10 of 15 snapshots. In AD 1000 Modelski gives Baghdad 1,500,000 people; Chandler gives it 125,000 and crowns Cordoba in Spain instead. The record is also thin outside Europe, the Middle East, India and China: before AD 1000 the compilations hold 11 places in the Americas and 4 in sub-Saharan Africa. And the data needed fixing: Modelski’s cities in the Americas carried exact copies of their AD figures 1,300 years too early, and a few figures were out by a factor of ten, such as Philadelphia at 17.6 million in 1914. Everything I changed is listed in the paper.
How I did this
I used the V2 files of Reba, Reitsma and Seto’s dataset, read as Windows-1252 text, and the UN World Urbanization Prospects 2025 files 18 to 21. At each snapshot every place gets its compiler’s figure for that date, or a log-scale interpolation between the compiler’s nearest dates if they are close enough in time; where both compilations give a figure I take the average, and places within 0.5% of the top count as tied. From 1975 the figures are the UN’s alone. The paper sets out every step, every correction and every caveat, and the code and data are open.
Notes and sources
- Reba, M., Reitsma, F. and Seto, K. C. (2016) Spatializing 6,000 years of global urbanization from 3700 BC to AD 2000, Scientific Data 3, 160034; data on figshare, CC BY 4.0. From Chandler, T. (1987) Four Thousand Years of Urban Growth and Modelski, G. (2003) World Cities: -3000 to 2000.
- United Nations, Department of Economic and Social Affairs, Population Division (2025) World Urbanization Prospects: The 2025 Revision, CC BY 3.0 IGO.
- Natural Earth country outlines (public domain).
- I wrote the text, with drafting and editing assistance from Claude (Anthropic), which also helped prepare the analysis code. I reviewed and checked all text and results.

