
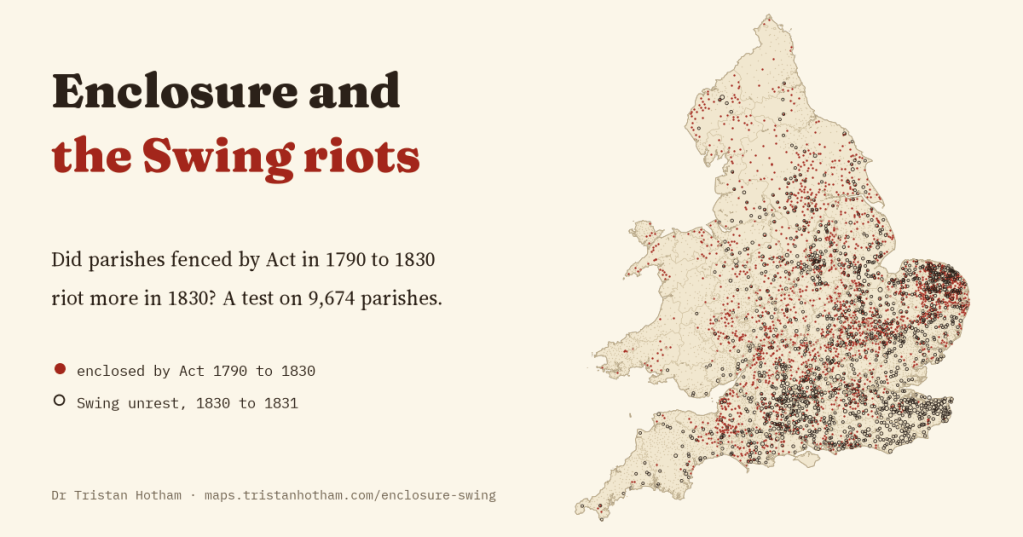
Historians have long said that enclosure, the fencing of open fields and commons by Act of Parliament, helped to cause the Swing riots of 1830. I linked every enclosure Act to the parishes of England and Wales and tested the idea on 9,674 parishes, writing down the test before I ran it. Enclosed parishes did riot a little more, but the reason looks like their size, not their grievance.
In the late summer of 1830, farm labourers in Kent began to smash the threshing machines that were taking away their winter work. By the end of the year the rising had spread across the south and east of England: ricks and barns were burned, crowds marched on farmers and parsons to demand higher wages and lower tithes, and threatening letters arrived signed by an imaginary leader, “Captain Swing”.
Why did it happen? In their classic book Captain Swing, Eric Hobsbawm and George Rudé pointed to a long slide into poverty, and among its causes to parliamentary enclosure, which in the decades before 1830 had fenced the open fields and commons of thousands of parishes and taken away the grazing, fuel and gleaning that helped labouring families get by. More recently the economists Bruno Caprettini and Hans-Joachim Voth showed, parish by parish, that places where threshing machines had spread were much more likely to riot. Their data are open, and so is my own list of every enclosure Act, so I could ask a simple question: once you allow for the machines, did the parishes that Parliament had recently enclosed riot more?
Joining two maps
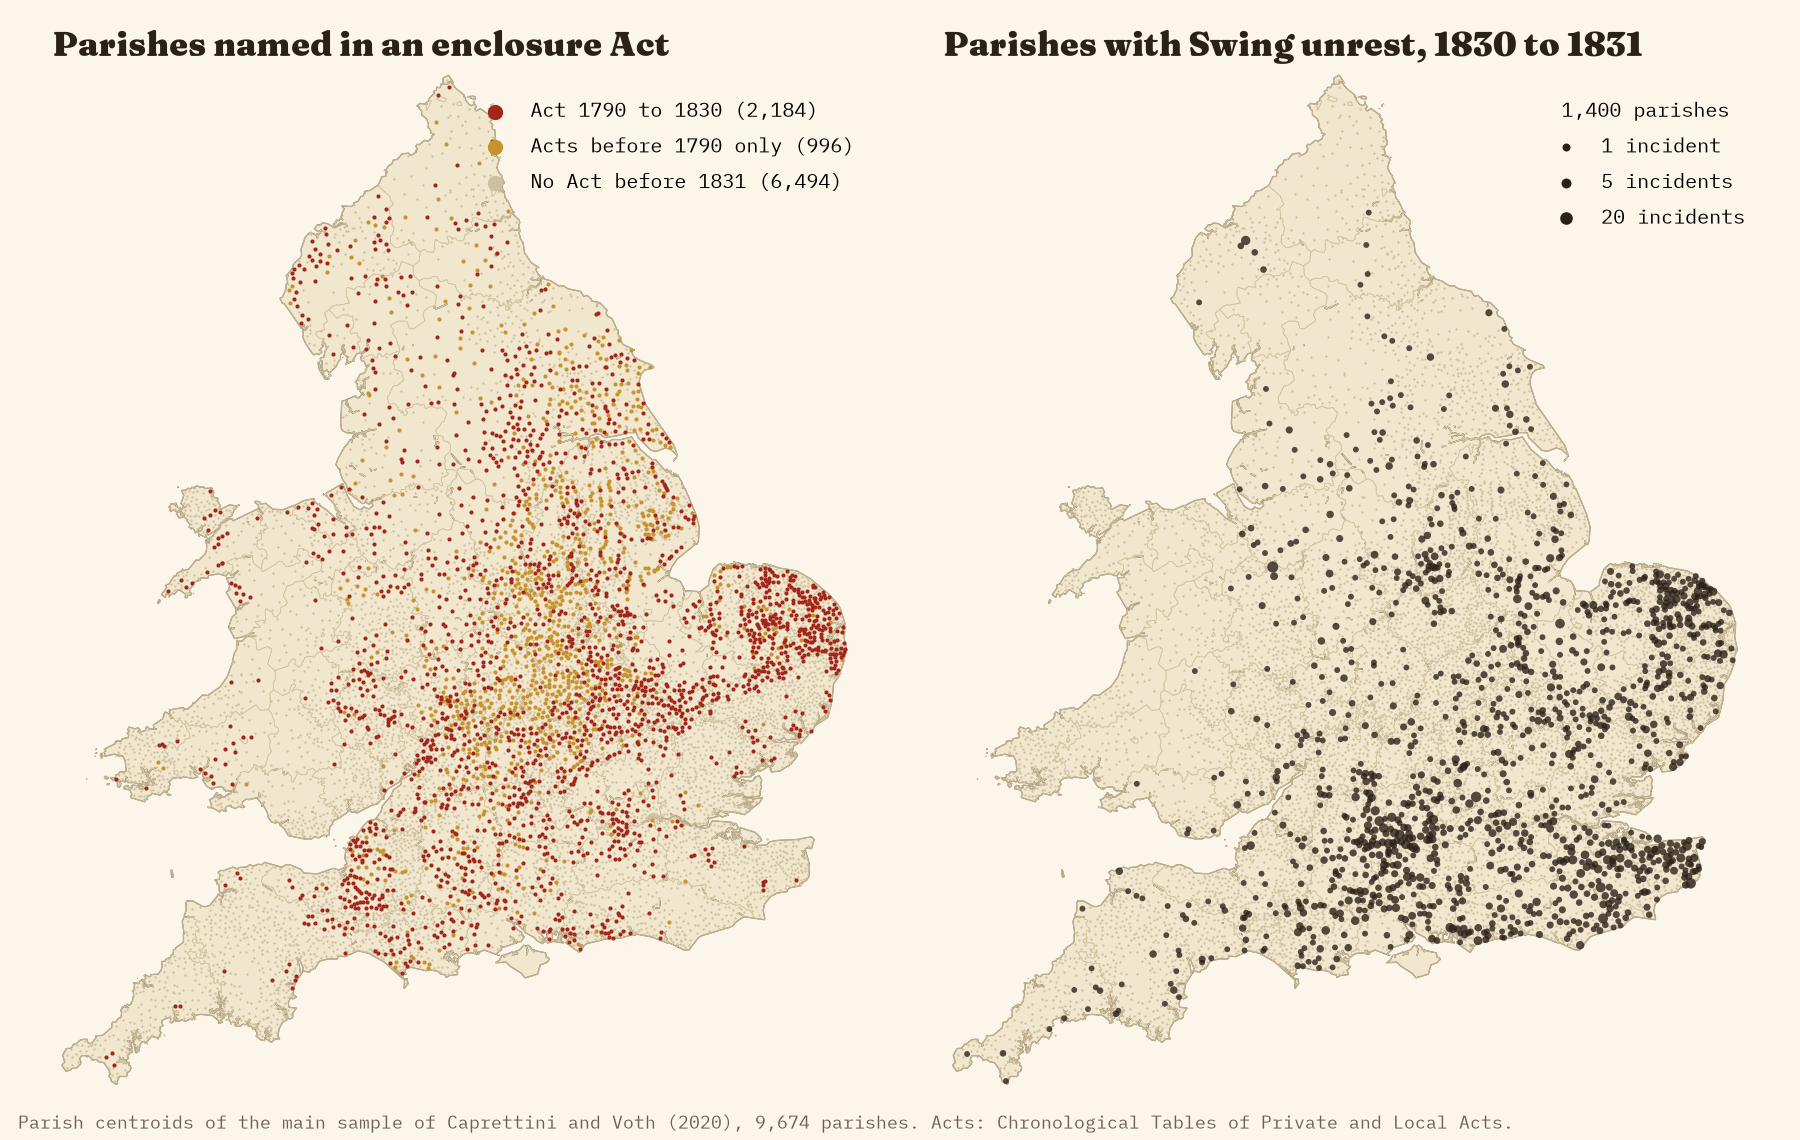
The Acts name places, not parishes, and spell them as clerks did two hundred years ago, so the first job was to match them. I matched each place to a parish by its name within the county given in the Act, or else by where a gazetteer puts it on the map. Of the 3,322 places named in Acts of 1790 to 1830, 79% found a parish. When I checked 100 matches by hand, 97 were right. The ones that failed are mostly hamlets and townships inside bigger parishes, and odd spellings.
The two maps already hint at the answer. Parliamentary enclosure was thickest in the Midlands and Norfolk. Swing was thickest in Kent, Sussex, Hampshire, Wiltshire and Berkshire, where much of the land had been enclosed long before, without an Act. So I compared parishes within the same county, and allowed for threshing machines, population density, farm work, soils and distance from where the rising began.
I wrote the test down first
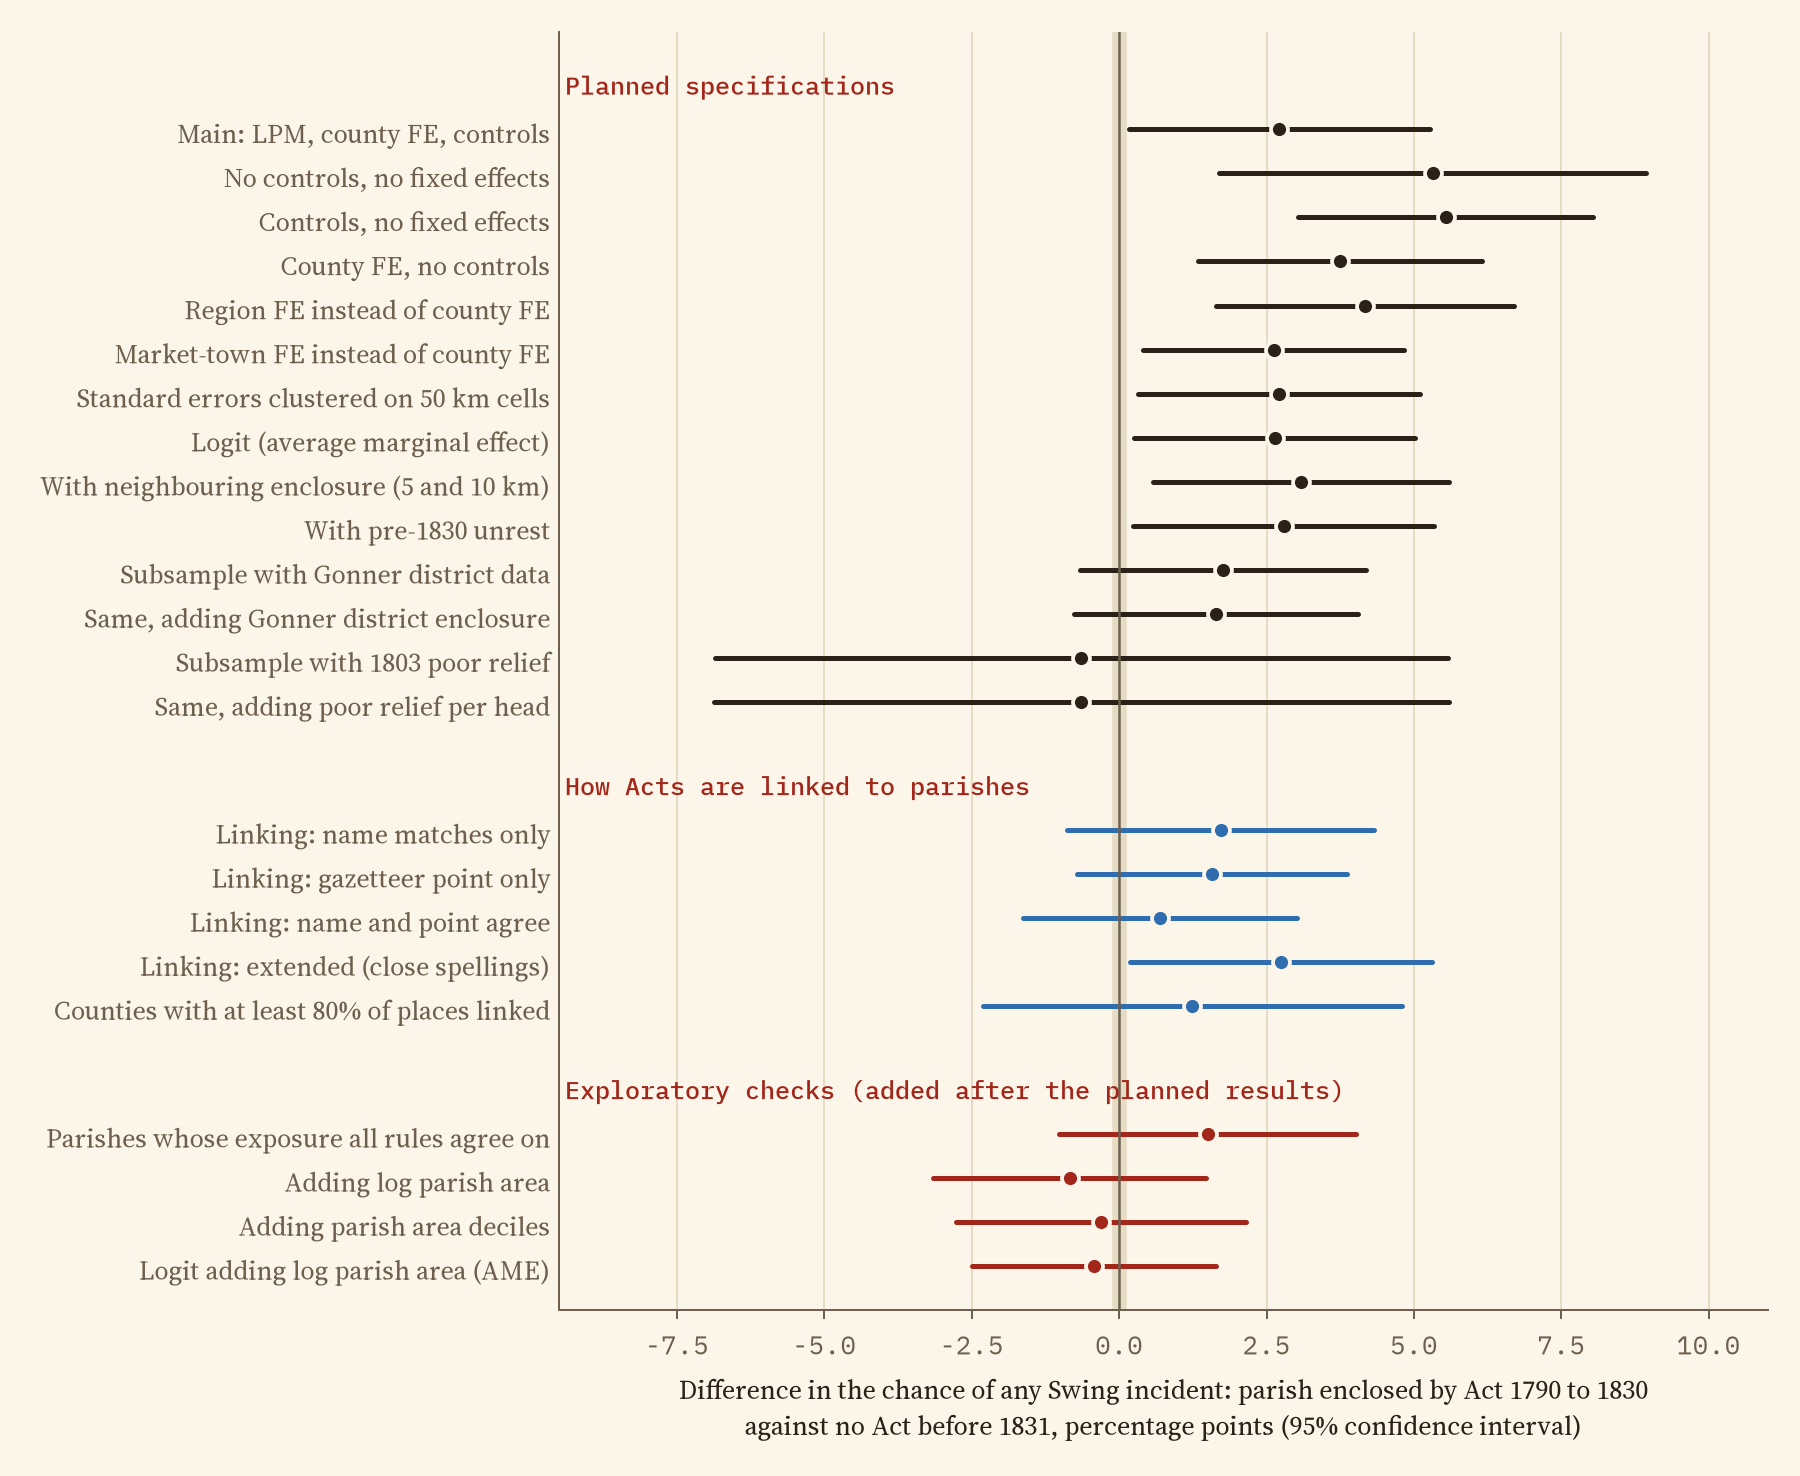
A question like this can be asked in dozens of ways, and it is easy to keep asking until you get the answer you want. So before I ran anything on the riots I wrote down the main test, the checks I would make, and what result would count against the idea. The planned test does find a gap: parishes named in an enclosure Act between 1790 and 1830 were 2.7 percentage points more likely to see a Swing incident than parishes with no Act (the likely range is 0.2 to 5.3 points). With about 14% of parishes seeing unrest, that is a modest difference, but by the rules I set myself it counts in favour.
Old enclosure looks just the same
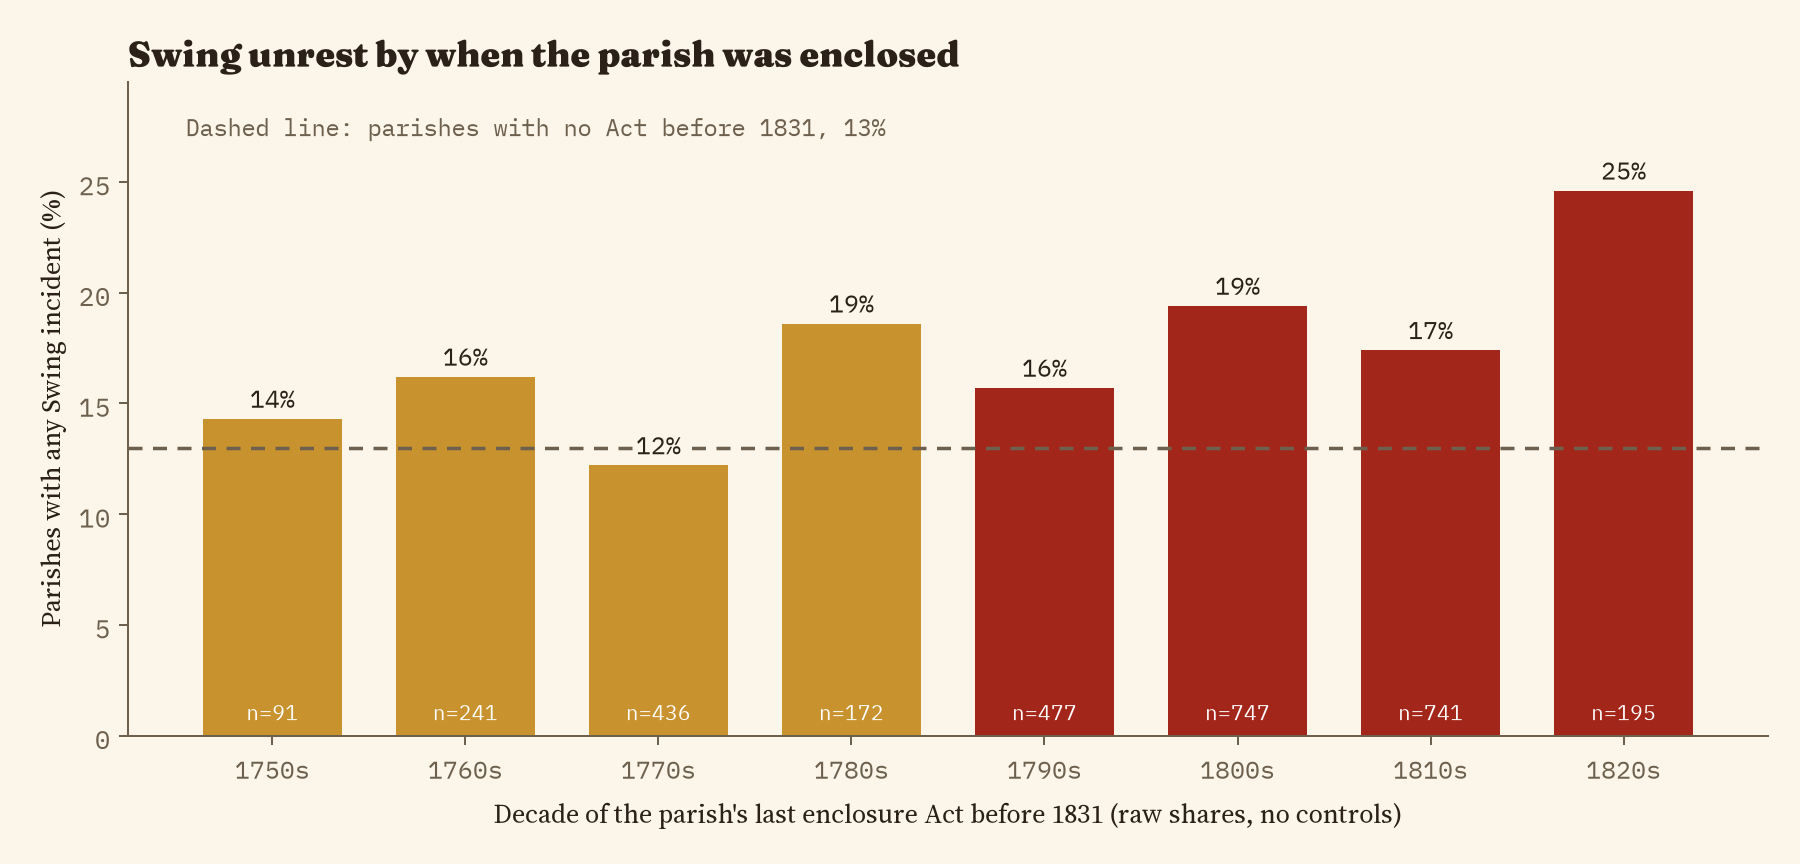
If losing the commons left a raw grievance, it should be rawest where the loss was fresh. It is not. Parishes whose only enclosure Acts came before 1790, so that most labourers of 1830 had never known the open fields, show a gap of 3.1 points, the same as for recent enclosure. Parishes enclosed in the 1820s did riot most often in the raw figures, 25% of them, but there are only 195 of them and the difference is too uncertain to lean on.
The gap is the size of the parish
Then I noticed something my plan had missed. The riots are counted as “at least one incident in the parish”, and parishes came in very different sizes. A big parish has more farms, more ricks, more people and more chances for something to happen. In the biggest fifth of parishes 22% saw unrest, against 8% in the smallest fifth. Big parishes were also twice as likely to be named in an enclosure Act.
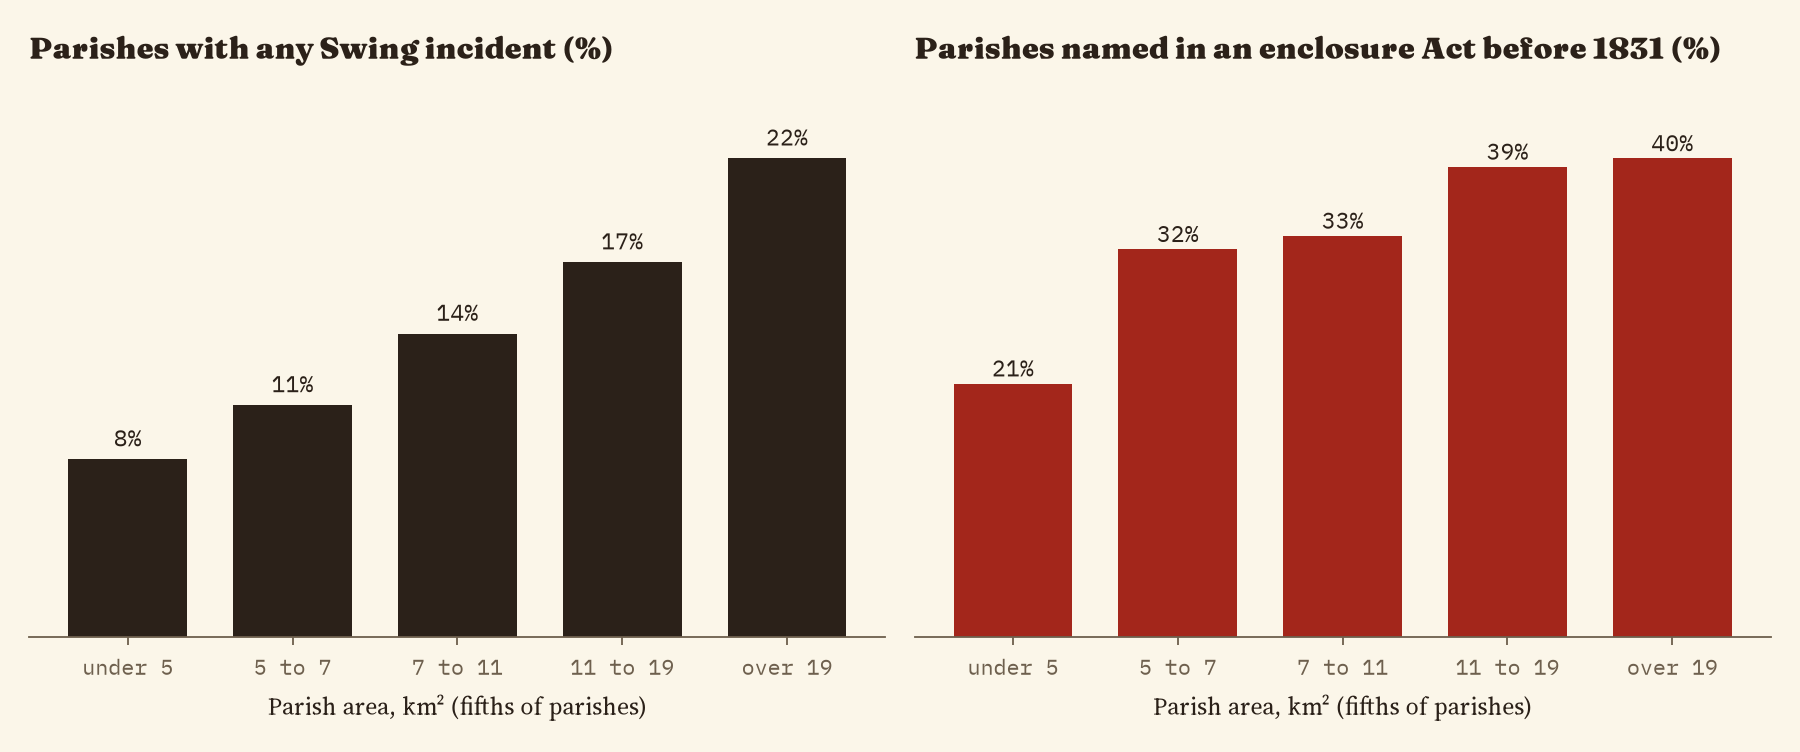
When I add the area of each parish to the test, the gap disappears: -0.8 points, with a likely range of -3.2 to 1.5. Because I added this after seeing the first result, it should carry less weight than the planned test, and I say so in the paper. But the reason is simple, and the change is large.
Enclosed parishes rioted a little more in 1830, but no more than parishes enclosed two generations earlier, and no more than other parishes of the same size.
Testing it hard
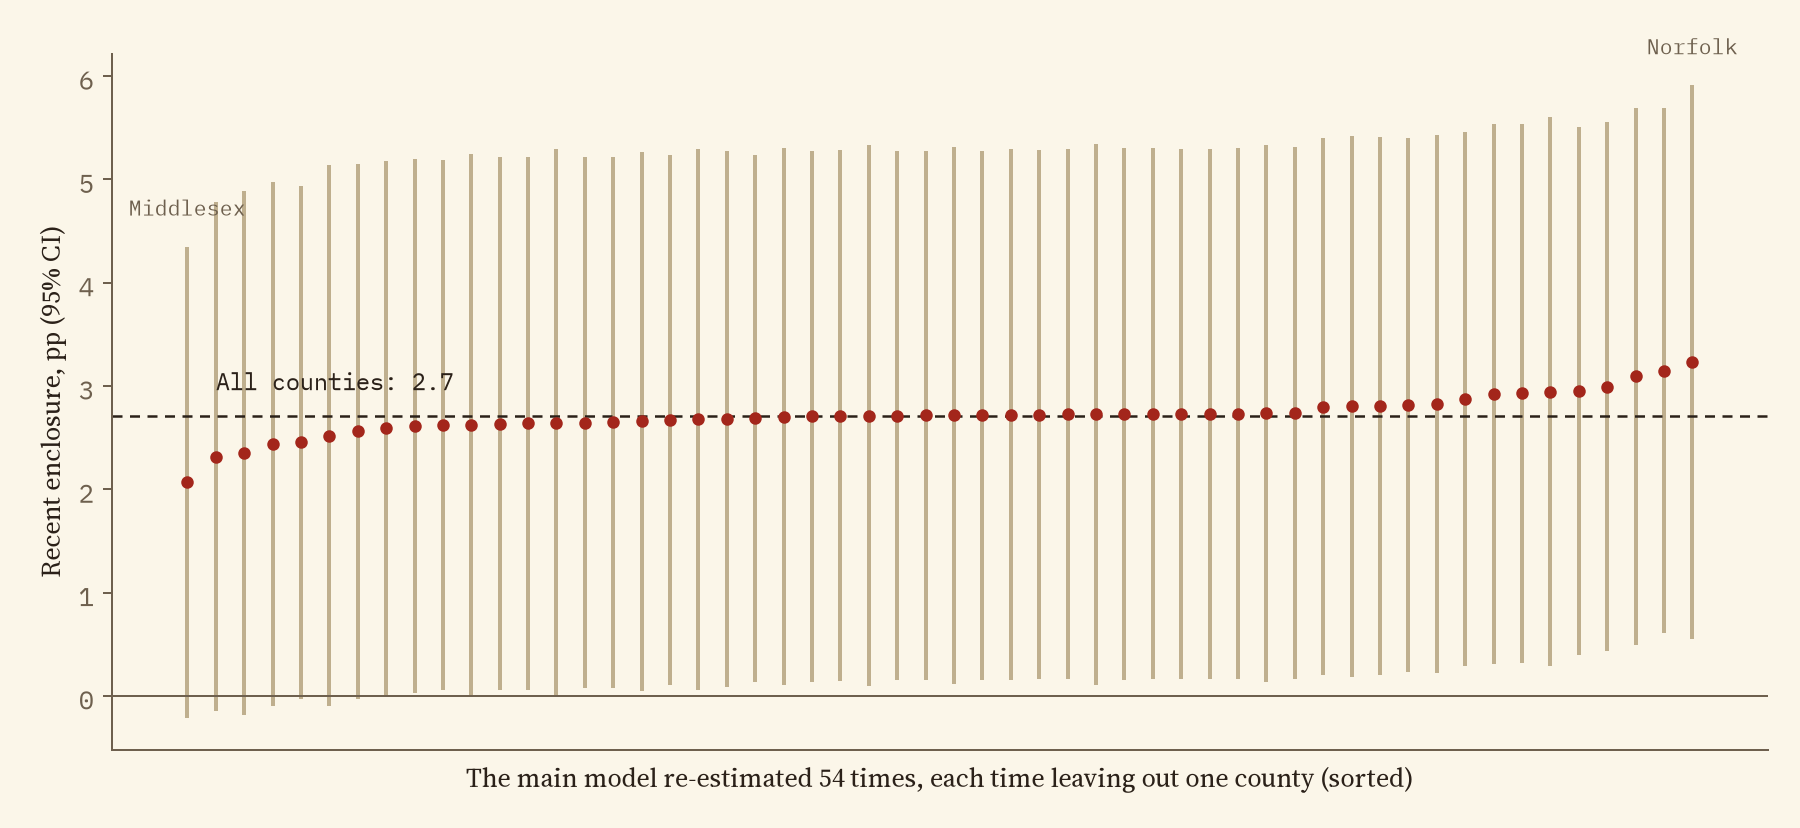
I tried the test many ways. Leaving out each county in turn moves the planned gap only between 2.1 and 3.2 points, so no single county drives it. Parishes that Parliament enclosed only after the riots, between 1831 and 1870, show no extra unrest at all (-4.5 points). But the gap shrinks when I match Acts to parishes more strictly: using only matches where the name and the map point agree, it falls to 0.7 points. And the three versions in the chart that allow for parish size all put it close to zero.
What this does and does not say
This does not show that enclosure was harmless or that it played no part in the misery behind Swing. Its effects on wages and poor relief could have spread across whole districts, many southern labourers had lost their common rights long before any Act, and an Act that fenced one small common counts here the same as one that enclosed a whole parish. What the data do not support is the narrower idea that the parishes Parliament had enclosed in the decades before 1830 were where the rising broke out. Caprettini and Voth point instead to the threshing machines; in these data the machines’ link to unrest roughly halves once parish size is allowed for, so that question deserves the same care.
How I did this
The parishes, riots, threshing machines and 1801 census figures come from the open replication data of Caprettini and Voth, who built on the Swing Riots Project’s parish record of incidents. The 4,104 enclosure Acts come from the Chronological Tables of Private and Local Acts, from my earlier map of every enclosure Act. The test compares parishes within each of 54 counties. The paper gives the full plan, the matching rules, every model and its limits. Everything here is correlation from historical records, not proof of cause.
Notes and sources
- Parish data: B. Caprettini and H.-J. Voth (2020), Rage against the machines: labor-saving technology and unrest in industrializing England, American Economic Review: Insights 2(3), 305 to 320, and their replication data (openICPSR 117044, CC BY 4.0). Incidents from M. Holland (ed.), Swing Unmasked (2005).
- Enclosure Acts: Chronological Tables of Private and of Local Acts, legislation.gov.uk (Open Government Licence v3.0), as compiled in my enclosure study; place points from Wikidata (CC0). Base map: OpenFreeMap, OpenStreetMap contributors (ODbL).
- Further reading: E. J. Hobsbawm and G. Rudé, Captain Swing (1969); J. M. Neeson, Commoners (1993); K. D. M. Snell, Annals of the Labouring Poor (1985); L. Shaw-Taylor, Parliamentary enclosure and the emergence of an English agricultural proletariat, Journal of Economic History (2001); C. J. Griffin, The Rural War (2012).
- I wrote the text, with drafting and editing assistance from Claude (Anthropic), which also helped prepare the analysis code. I reviewed and checked all text and results.

