
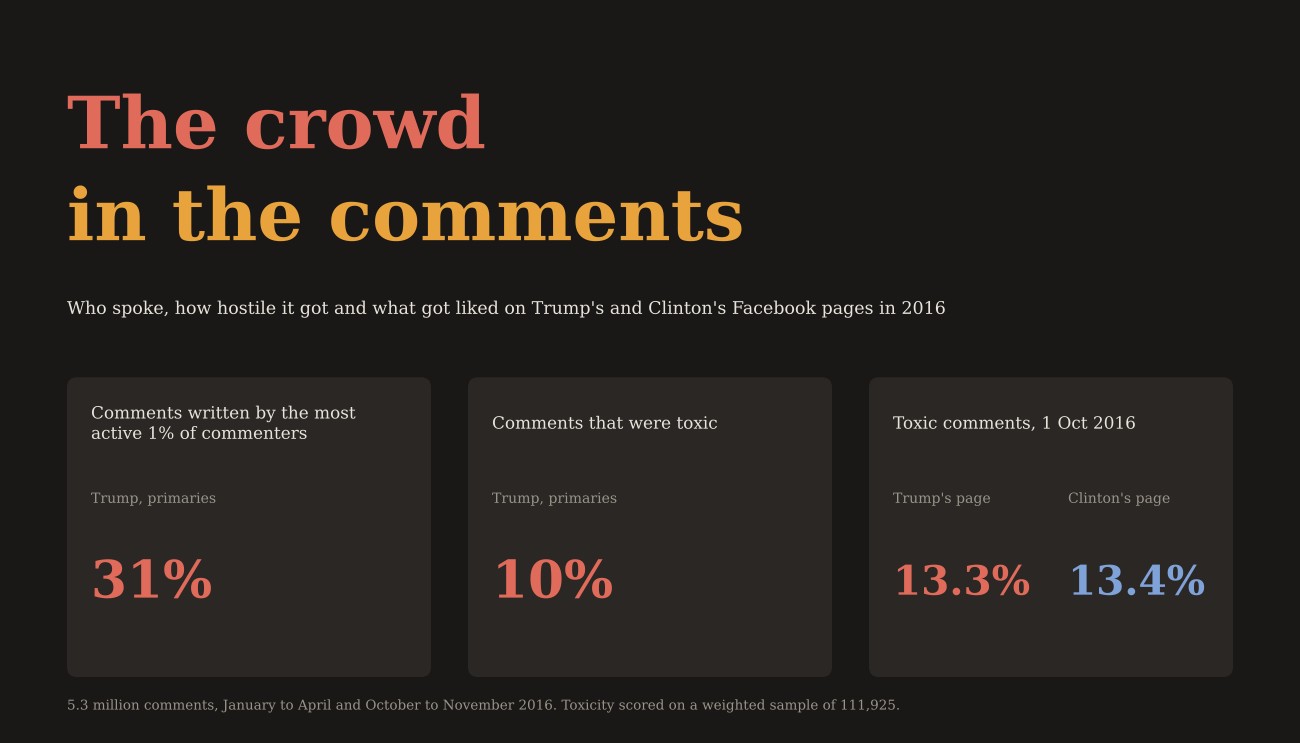
Everyone has a picture of what the comments under a presidential candidate’s Facebook post looked like in 2016. A wall of rage. Bots, trolls, all caps, everyone shouting. I had the chance to check, because during my PhD I collected them. Not a few: 5.3 million comments, every one that could be retrieved from 730 posts on Donald Trump’s page during the Republican primaries, plus posts from both Trump’s and Hillary Clinton’s pages on the same day in October.
The people are anonymous to me. Each commenter is a scrambled code, but the same person gets the same code on every post and on both pages. That means I can follow one anonymous person through the whole campaign, and see how they behave on Trump’s page and then on Clinton’s. I scored a weighted sample of 111,925 comments with an open toxicity classifier and checked it against a simple swear-and-insult dictionary run over every comment. The paper is Who Speaks in the Candidate’s Comment Section? Participation, Toxicity and Reward on Donald Trump’s and Hillary Clinton’s Facebook Pages in 2016, free on Zenodo.
The preprint
Open access, free to read, share and cite. 18 pages, 7 figures. Not peer reviewed. Aggregate data behind the charts are in the record; no comment text is shared.
Cite as: Hotham, T. (2026). Who Speaks in the Candidate’s Comment Section? Participation, Toxicity and Reward on Donald Trump’s and Hillary Clinton’s Facebook Pages in 2016. Zenodo. https://doi.org/10.5281/zenodo.23287107
A crowd with a core
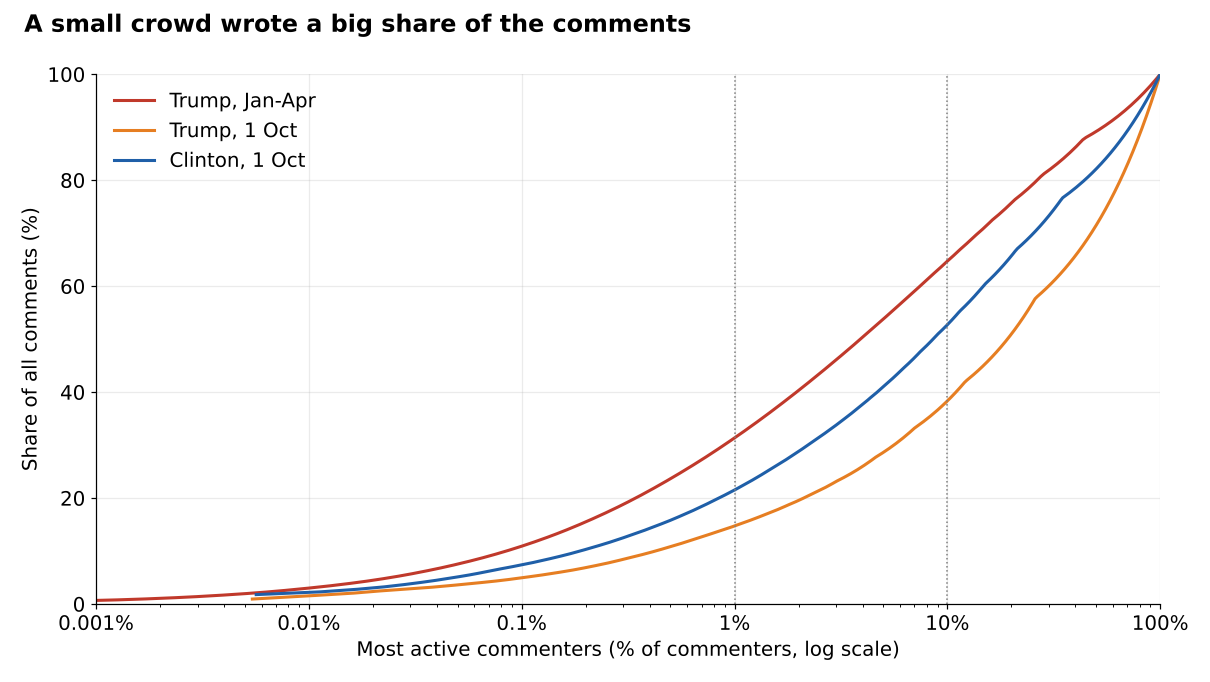
Just over 1.1 million different people commented on Trump’s page between January and April 2016. More than half of them commented once and never came back. Meanwhile the most active 1%, about 11,000 people, wrote 31% of everything. The busiest single account wrote 7,451 comments in three months. That is about 80 a day, every day.
So if you scrolled Trump’s comments in March 2016, a big slice of what you read came from the same regulars, who turned up week after week as a much bigger, more casual crowd washed in and out around them.
One in ten, every week
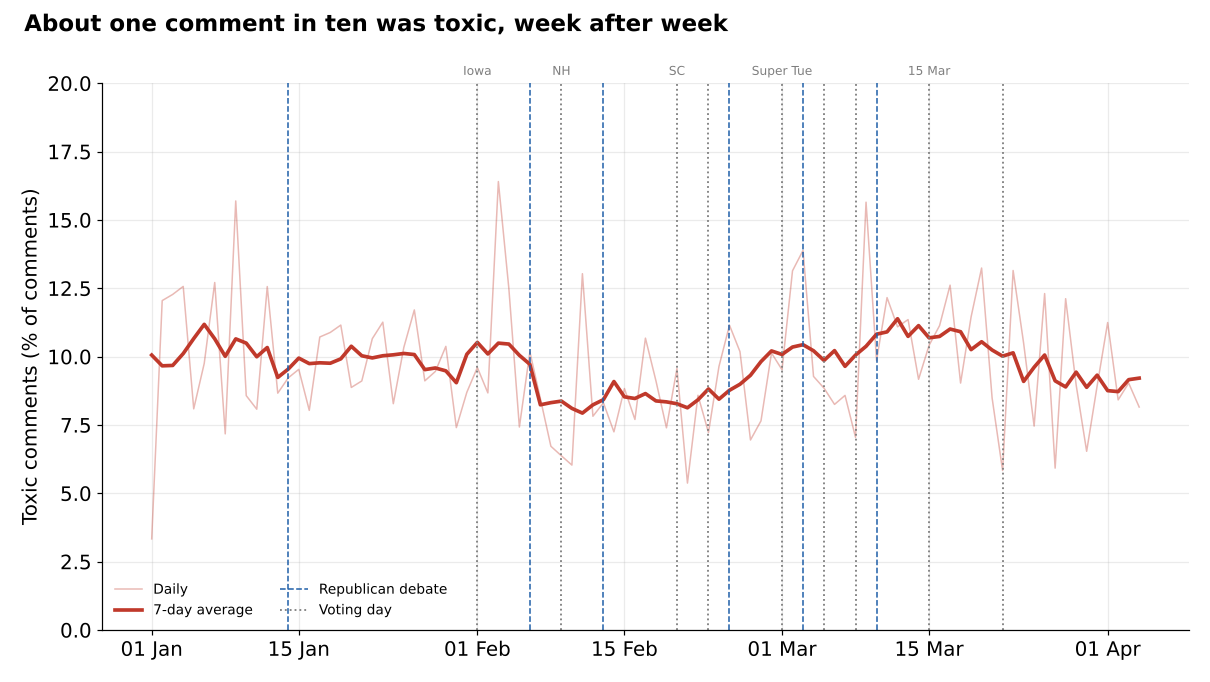
About one comment in ten was toxic: rude, insulting or abusive enough for the classifier to flag it. Insults were the most common kind. Threats and attacks on groups were rare. One in ten does not sound like a wall of rage, but over three months it still adds up to roughly half a million toxic comments on one page.
What surprised me was how flat the line is. Iowa, New Hampshire, Super Tuesday, the debates, the cancelled Chicago rally: none of them moves it much. Posts on debate days were a little more toxic on the classifier, but the dictionary does not back that up. Posts on voting days were a little less toxic on both measures, perhaps because they were full of cheering and calls to vote. What did change was who people talked about: the Republican rivals through February and March, and then Clinton coming back into view from mid-March.
Nastiness did not win likes
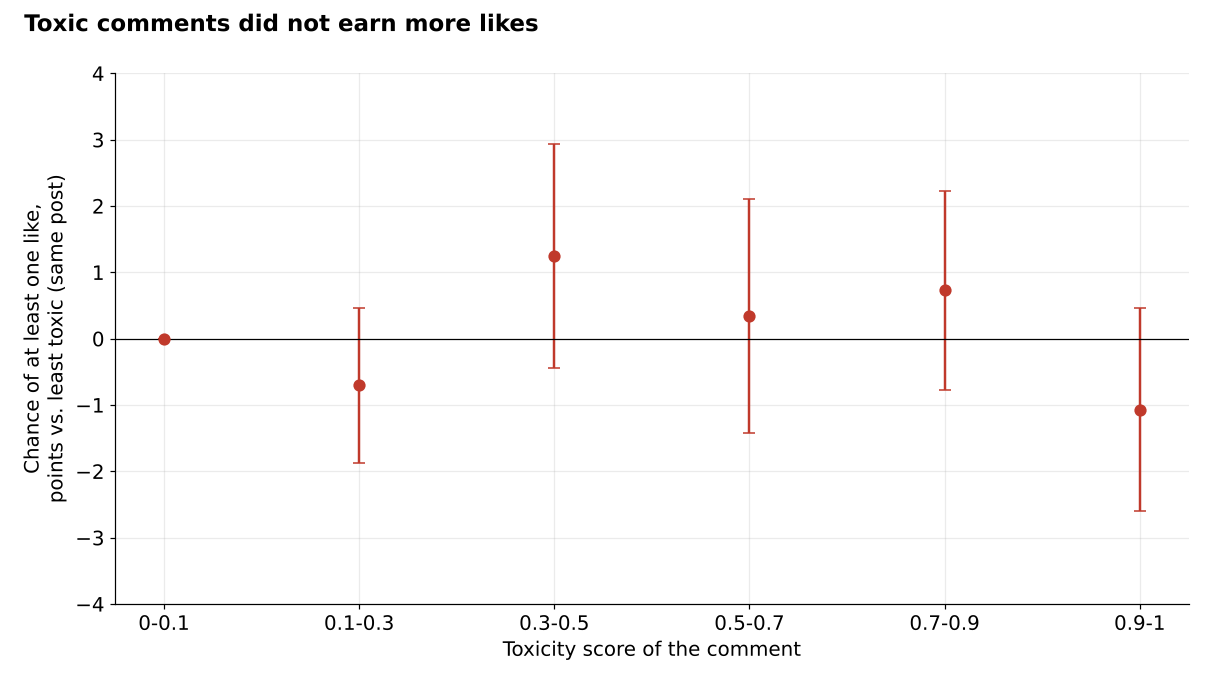
There is good research showing that outrage gets rewarded online, and that people who get likes for outrage produce more of it. So I expected toxic comments to collect more likes. They did not. Compared with other comments on the same post, written at a similar point in the thread, a toxic comment was exactly as likely to get at least one like. The handful of comments that racked up huge numbers of likes were, if anything, less often toxic. Likes on Trump’s page neither clearly rewarded nor clearly punished hostility.
The regulars were not the worst
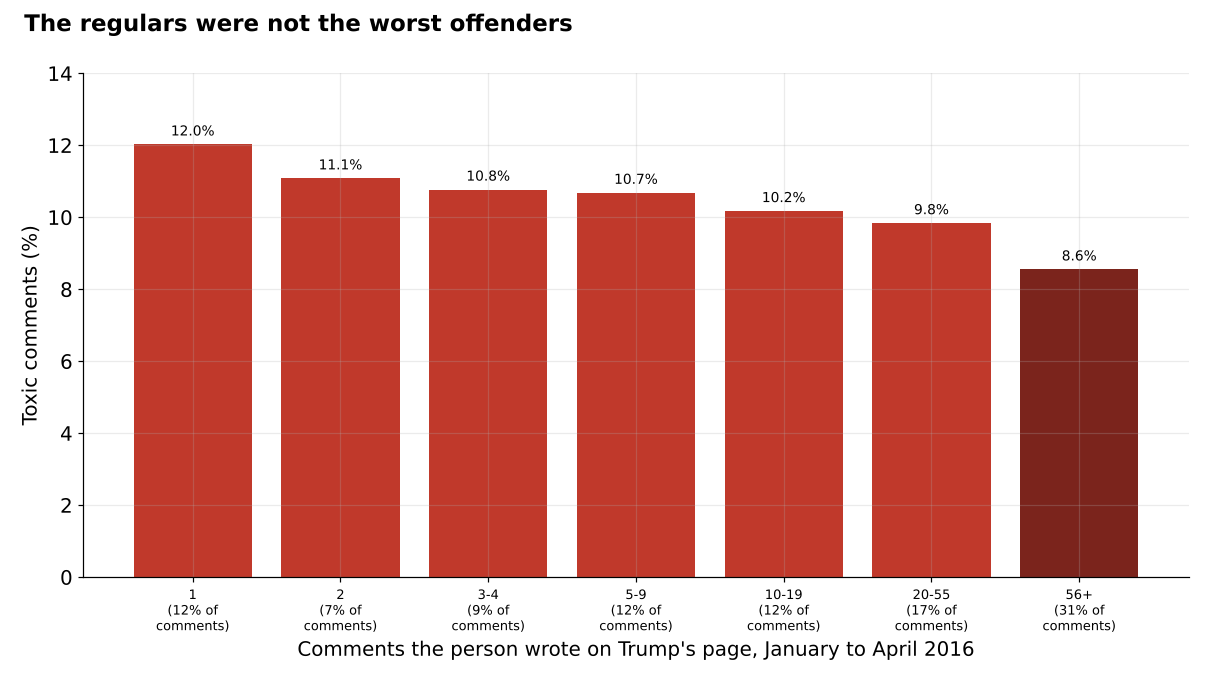
The obvious suspects are the superusers, the people posting 80 comments a day. They were not more toxic. On the classifier they were slightly less toxic than people who commented once (8.6% against 12.0%); on the dictionary they were the same. Hostility was spread right across the crowd, from the one-off commenter to the daily regular. If you wanted to clean up a comment section by dealing with its most active users, you would miss most of it.
Trump versus Clinton, same day
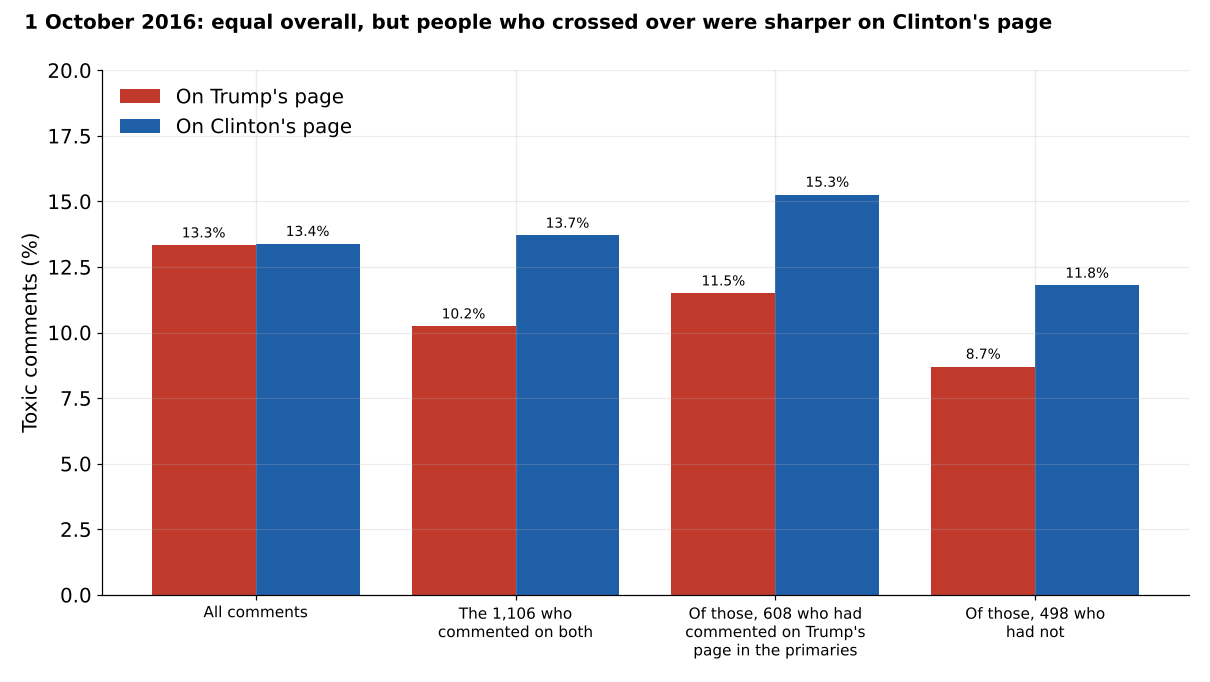
On 1 October 2016 I have comments from both candidates’ pages. Trump’s rhetoric was widely described as more combative, so you might expect his comment section to be nastier. It was not. 13.3% of comments on Trump’s posts were toxic, and 13.4% on Clinton’s. No meaningful difference. Clinton’s page was more of a debating hall, with far more replies to other commenters (40% against 25%), while Trump’s page drew more reactions per post.
The anonymous codes let me do one more thing. 1,106 people commented on both pages that day. Comparing each person with themselves, they were more toxic on Clinton’s page than on Trump’s: 13.7% against 10.2%. That held whether or not they had commented on Trump’s page back in the primaries. You can read it two ways, and I do not think the data can choose between them: these people were calmer on Trump’s page, or sharper on Clinton’s. Either way, the same people behaved differently depending on whose page they were on.
The caveats
These are the comments that survived. Many primary posts were collected months later, so anything deleted by the campaign, Facebook or the authors in the meantime is missing, and if the worst comments were removed, the real numbers were higher. The classifier was trained on Wikipedia comments and is not a human reader; it agrees well with the dictionary, but a couple of results (the debate-day bump, and the size of the cross-page gap) are weaker on the dictionary. The two-candidate comparison is one day, five days after the first debate. And mentioning someone is not the same as attacking them. The paper sets all of this out in detail.
Read it
Hotham, T. (2026). Who Speaks in the Candidate’s Comment Section? Participation, Toxicity and Reward on Donald Trump’s and Hillary Clinton’s Facebook Pages in 2016. Preprint, Zenodo. https://doi.org/10.5281/zenodo.23287107
It goes with my other preprints from the same PhD data, including whether Trump’s YouTube numbers predicted the county vote and whether populists win on Facebook.
The views in this post and the paper are my own.

