
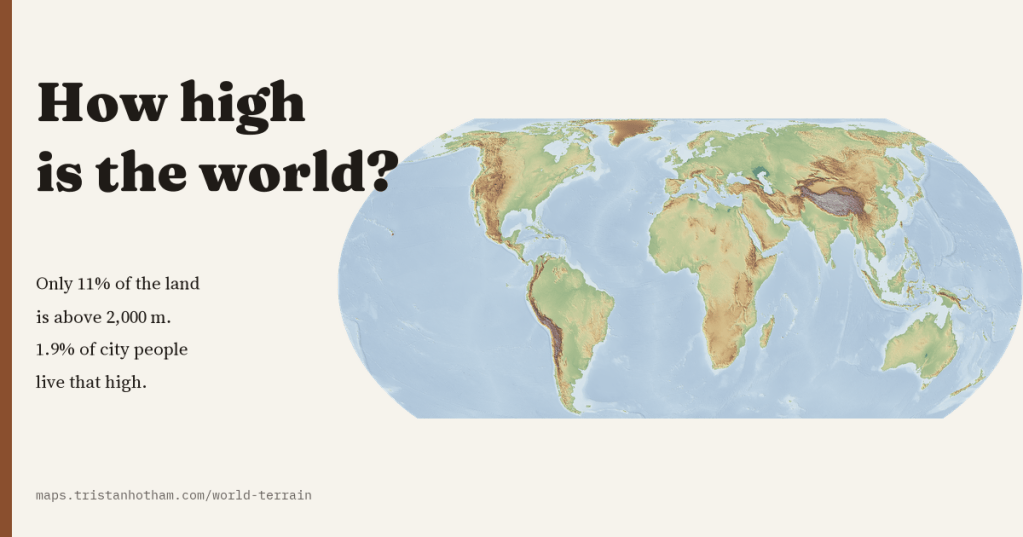
Only 11% of the world’s land rises more than 2,000 m above the sea, and only 1.9% of the people in its cities live that high. I made a map of the height of the whole planet, sharp from continents down to valleys, to see how high the world really is and how high we really live.
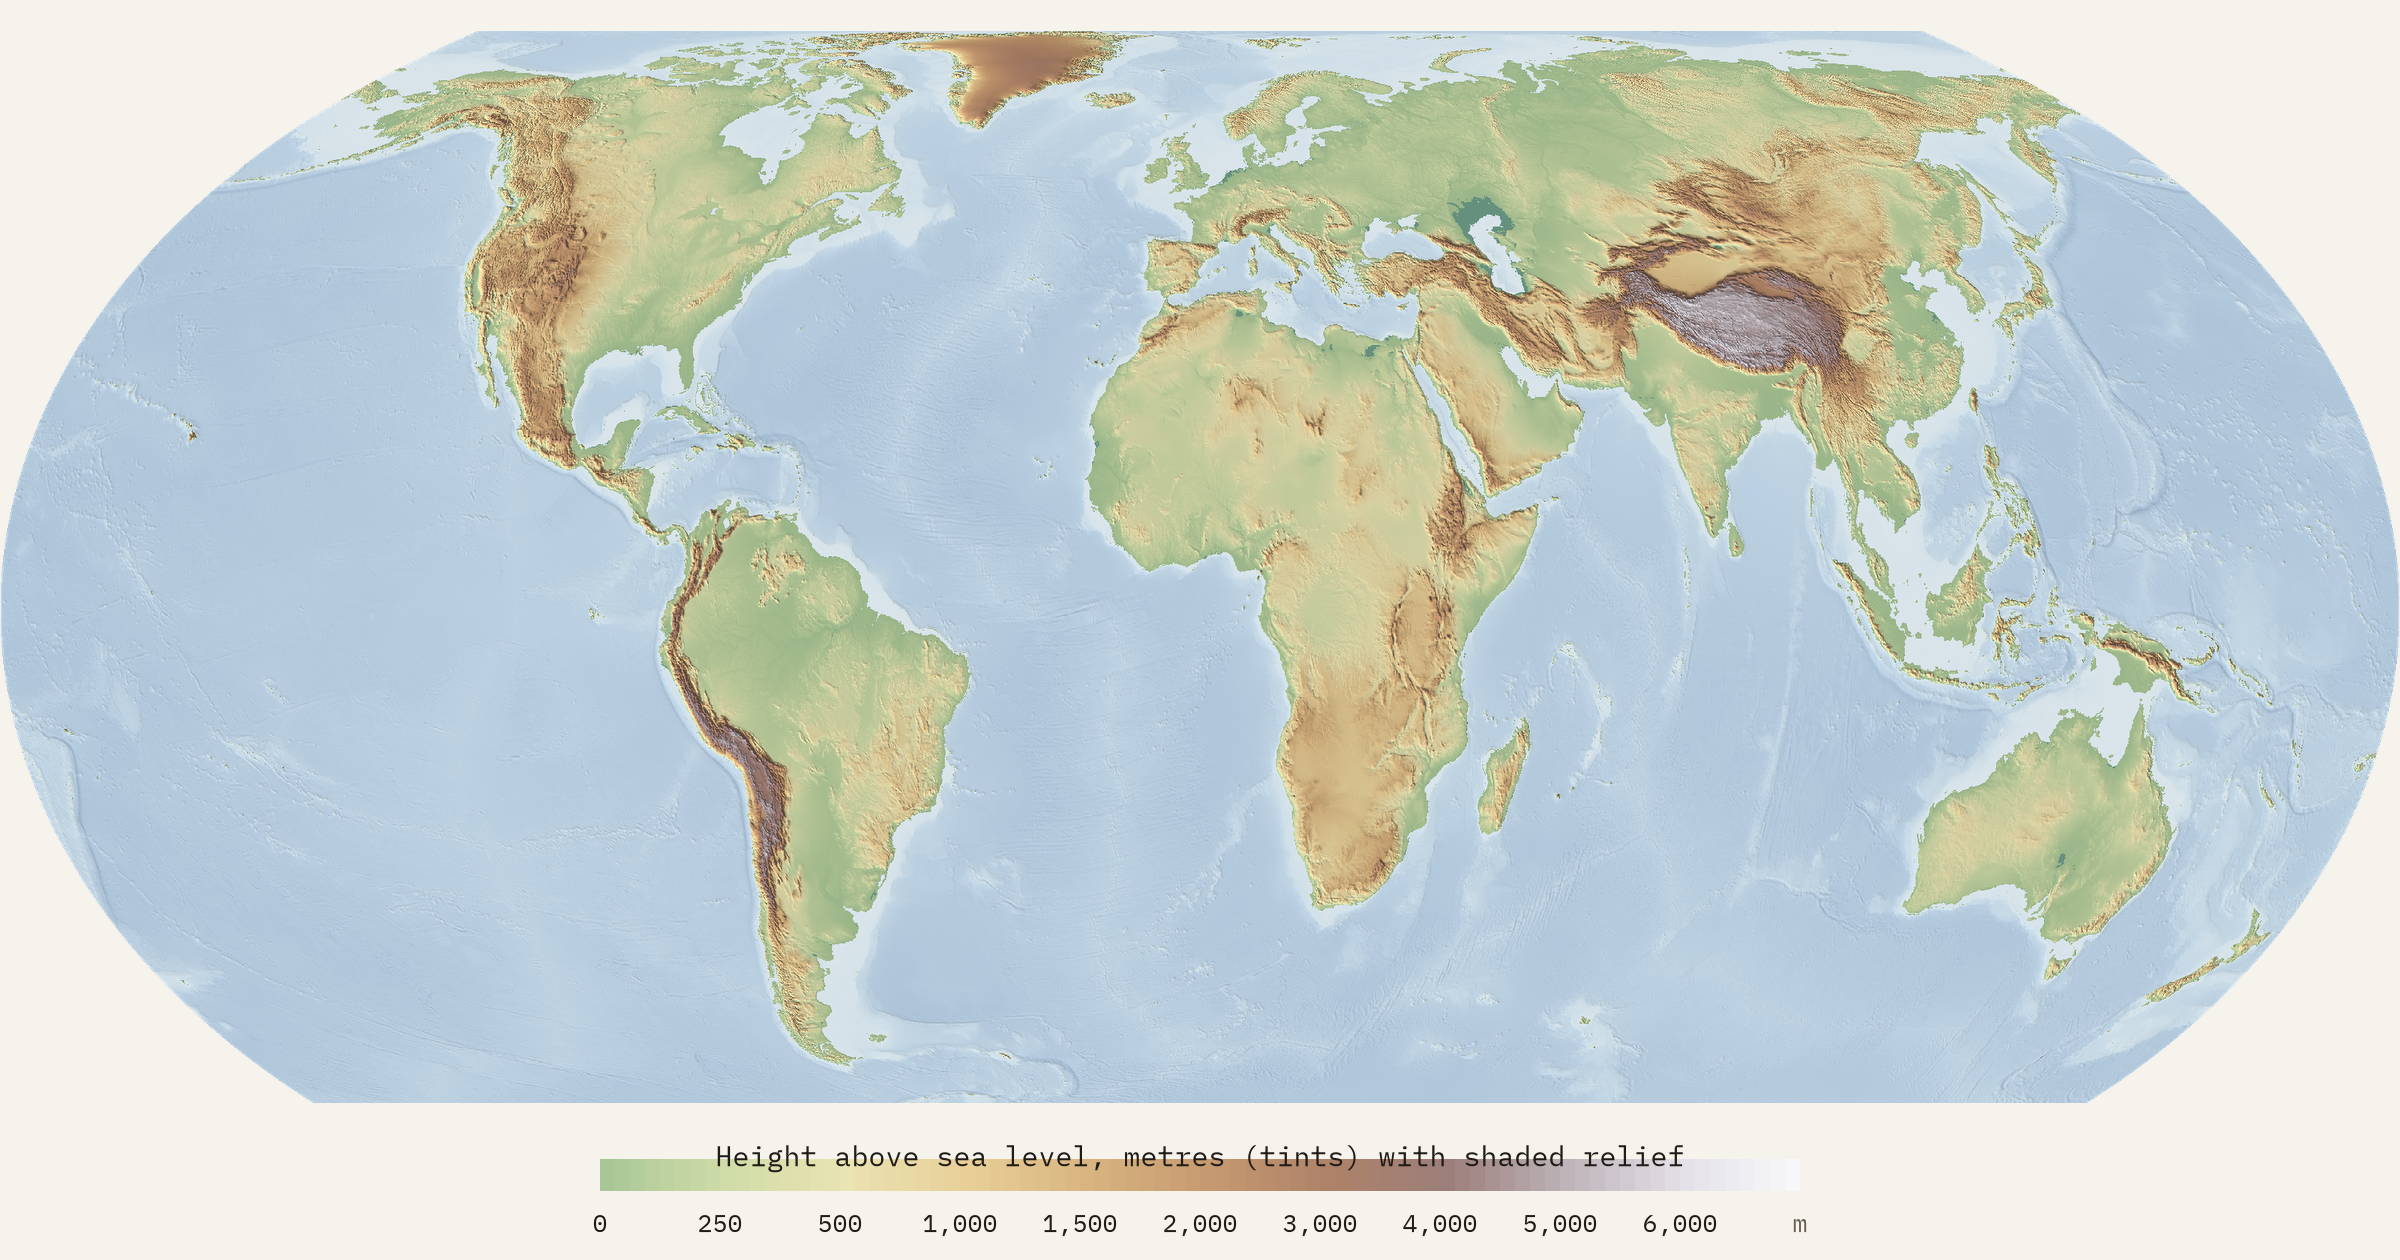
Height above sea level is one of the first things we learn about a place, and one of the things maps show worst. It decides where snow lies and rivers run, what grows, how hard it is to breathe and where it is easy to build. I wanted a map of it for the whole world that stays sharp whether you look at a continent or a single valley, and that tells you the height of any spot you click.
The raw material is a remarkable open dataset: the terrain tiles first built by Mapzen and now hosted by Amazon, which stitch together the Space Shuttle’s radar survey of the Earth, global elevation models and national surveys from the United States to New Zealand. Each tile is a picture whose colours are a code for height. The interactive map decodes them in your browser as you move, and turns them into colour and shaded relief at every zoom.
Most of the world is low
To measure the land I used the same tiles at their coarsest level, a world grid of cells about 9.8 km across, weighting every cell by its true area on the globe. Line up all the land from highest to lowest and you get what geographers call a hypsometric curve. It is surprisingly flat. The average height of the world’s land is 807 m, but half of it is below 432 m. Only 26% is more than 1,000 m up, 11% more than 2,000 m and 0.5% more than 5,000 m.
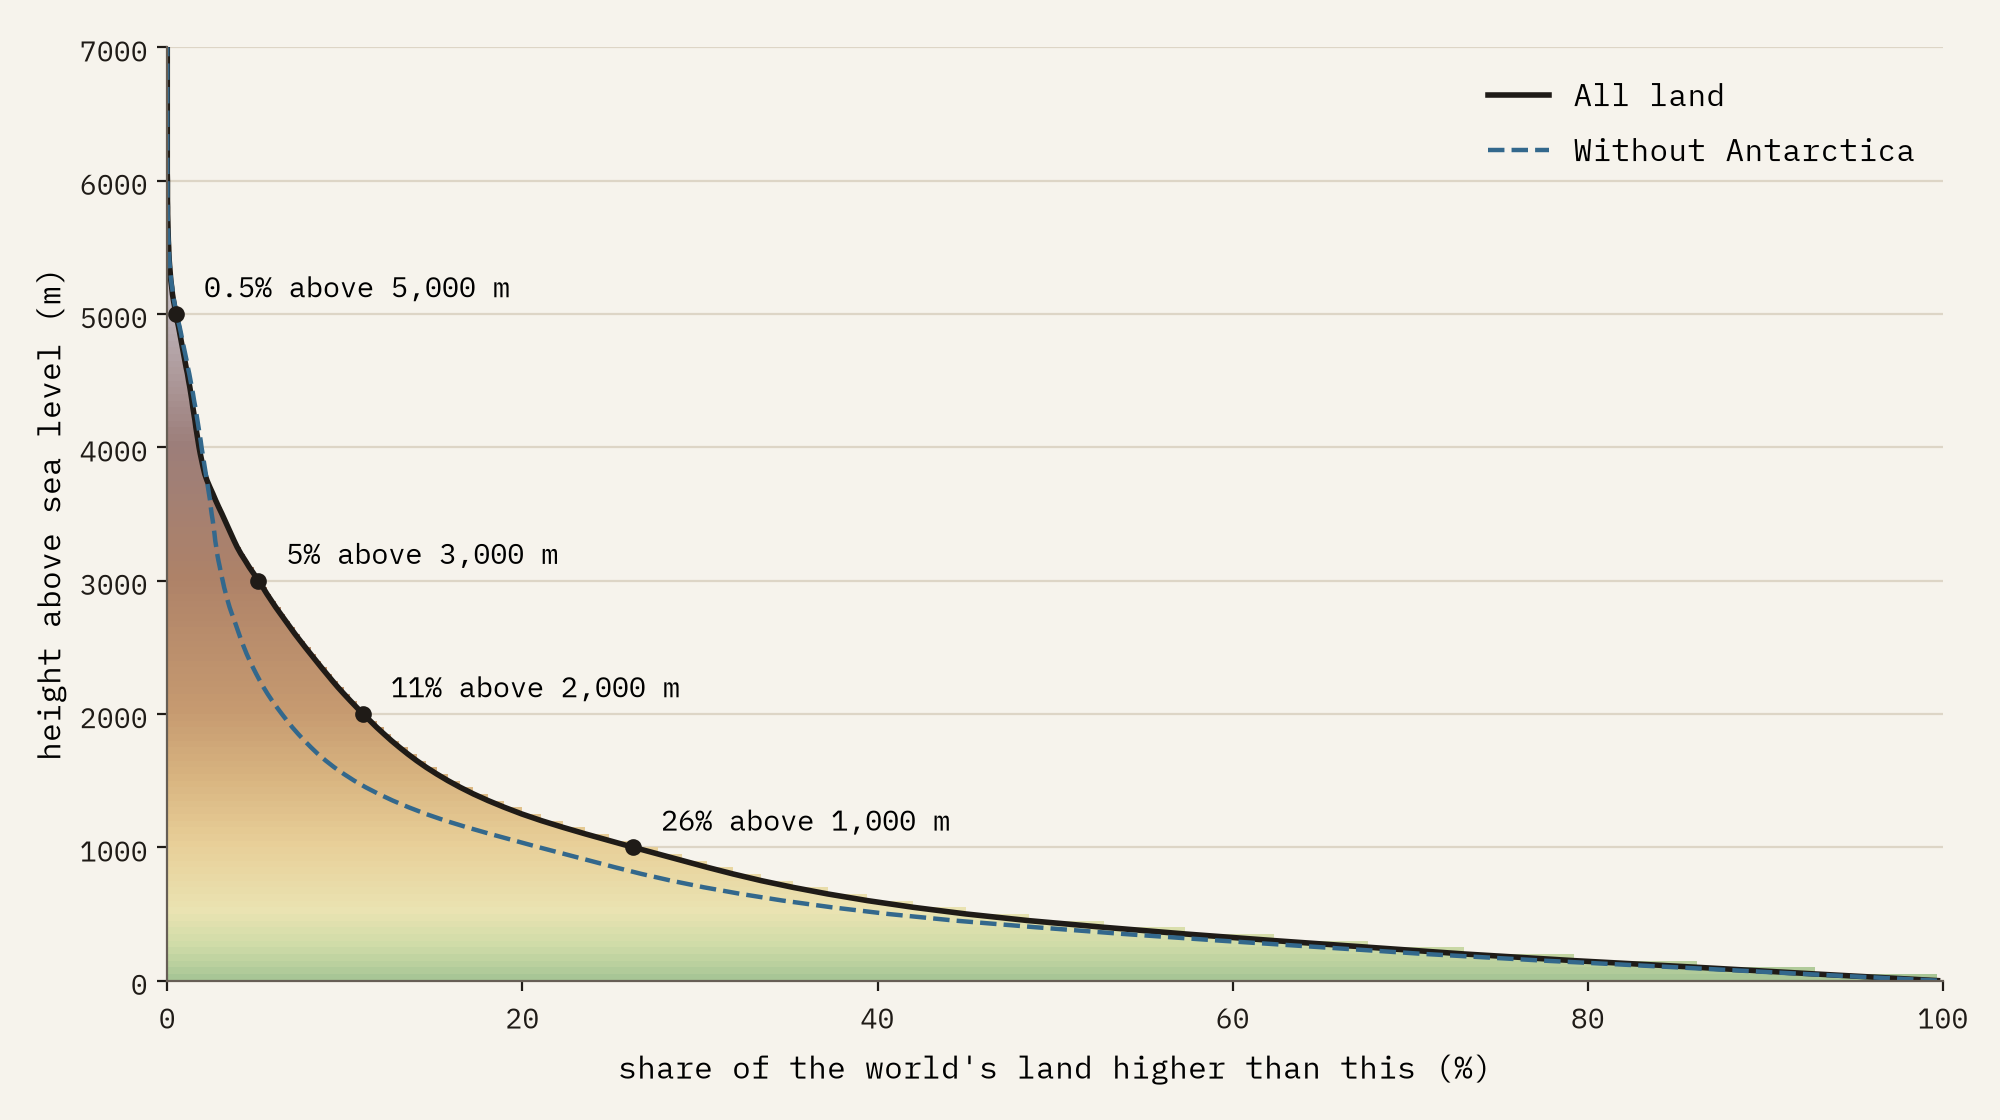
Much of that high land is ice. Antarctica’s ice sheet averages 2,208 m, so without it the rest of the land averages 678 m, and only 6.5% of it is above 2,000 m. And the land itself is a thin crust on a mostly drowned planet: 30% of the Earth’s surface is above sea level at all, and the sea floor lies on average 3,713 m down.
From Tajikistan to the Netherlands
By continent, icy Antarctica is highest, then Asia (1,059 m on average), North America (740 m), Africa (629 m), South America (587 m), Europe (370 m) and Oceania (301 m). The highest countries are the mountain states of central Asia, Tajikistan (2,961 m), Bhutan and Kyrgyzstan, with Lesotho in fourth place: even its lowest 10 km cell is 1,454 m up. The lowest is the Netherlands, at 10 m. The United Kingdom averages 158 m.
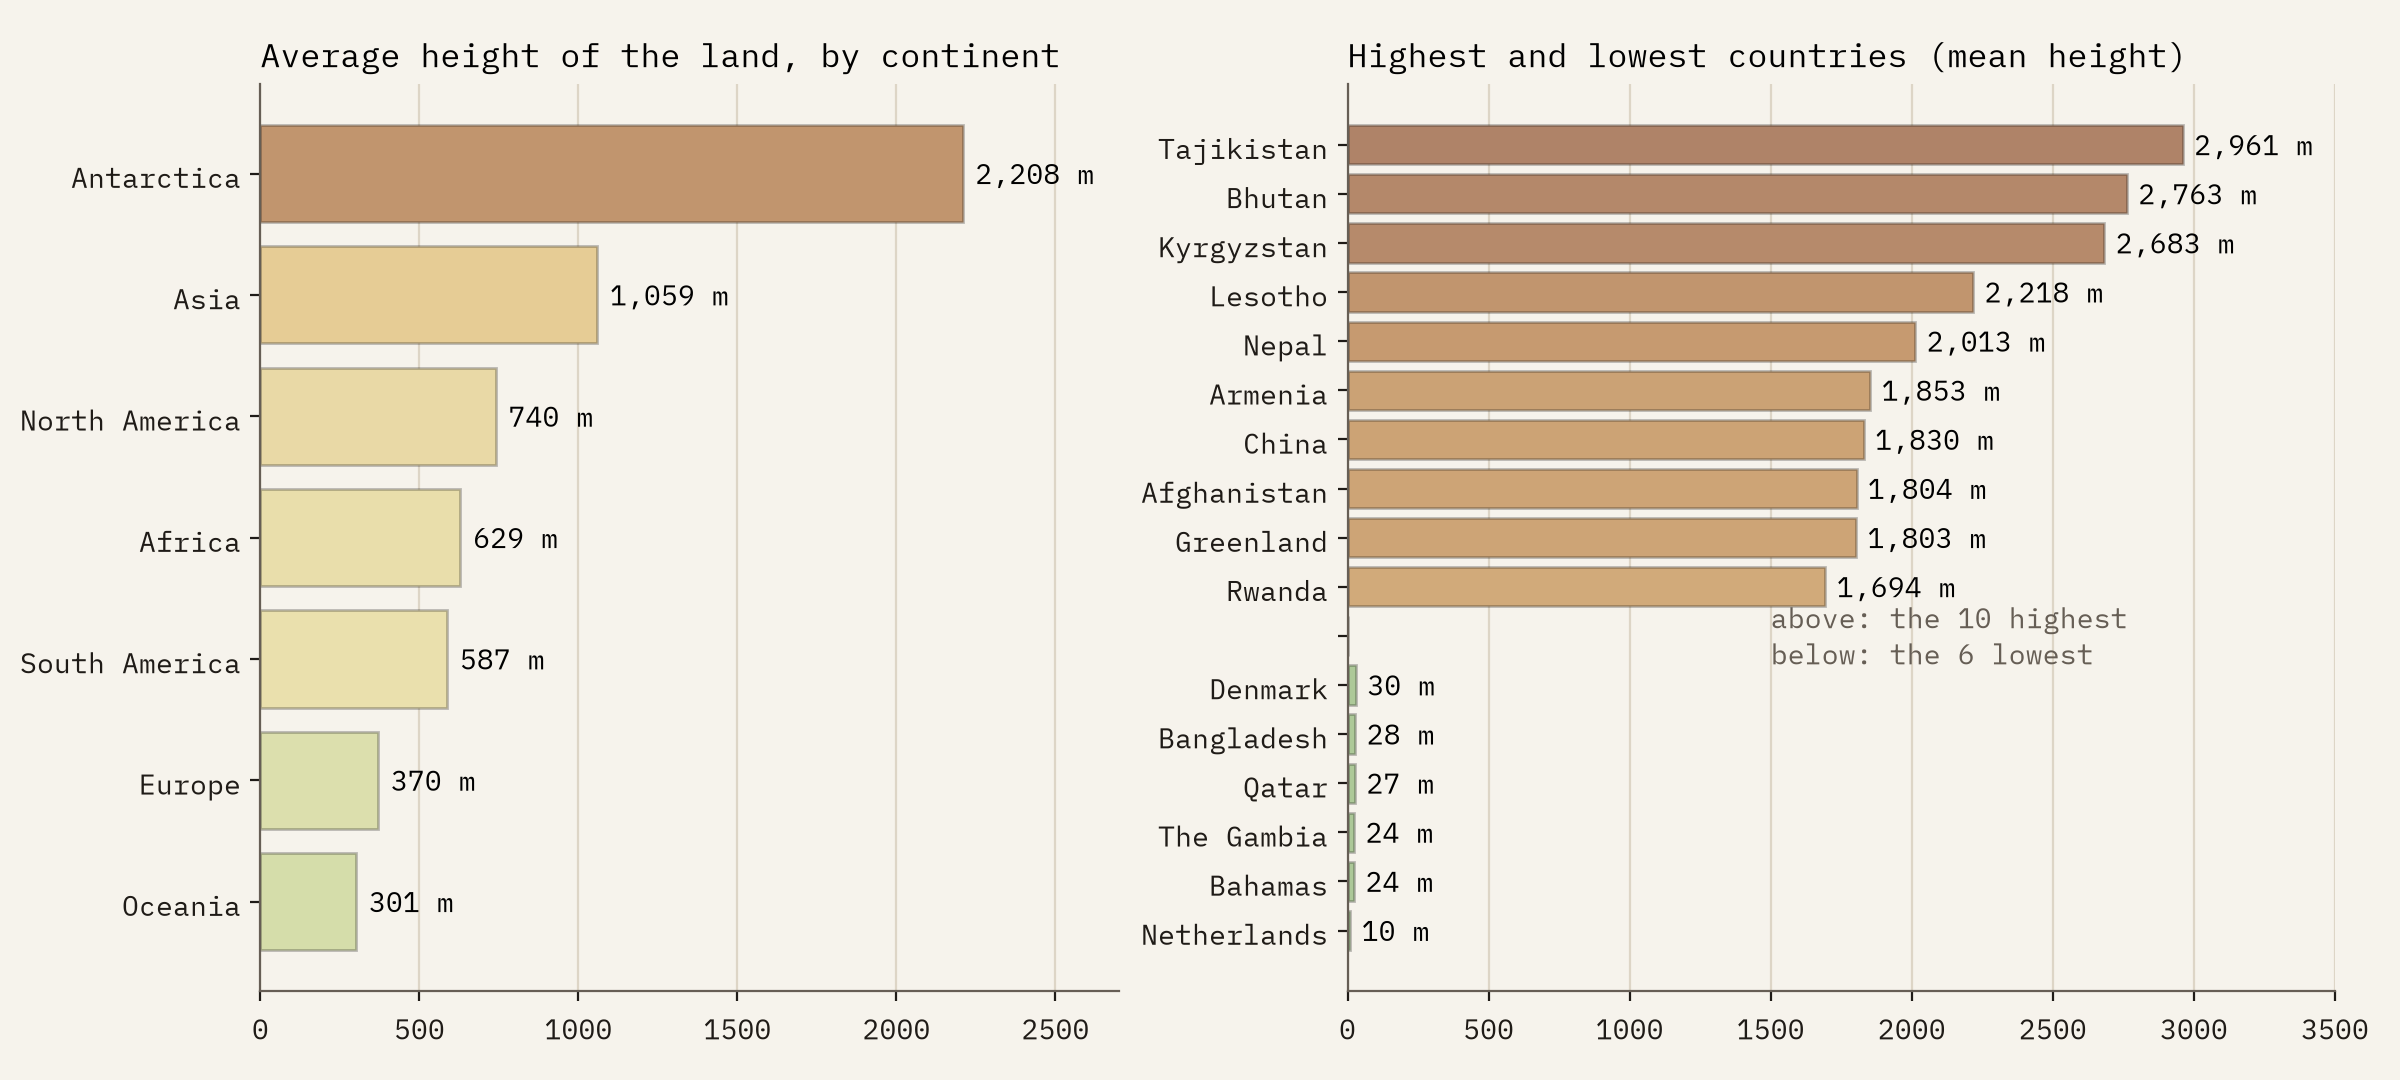
A grid of 10 km smooths the world. The highest cell in it, on the flank of Everest, is 6,727 m, 2,122 m short of the summit, and countries smaller than about a hundred cells, such as Andorra or Liechtenstein, are left out of the ranking.
Mountains, measured twice
For the peaks I took every mountain, hill, summit and volcano in Wikidata with a height, 136,410 of them. Wikidata records units, so the 3,057 heights given in feet convert cleanly, but I still checked every height against the terrain around it: a summit can rise well above its surroundings, but not impossibly far. That caught a few wrong units and left 134,657 summits on the map. The highest point of 189 countries matches an independent list.
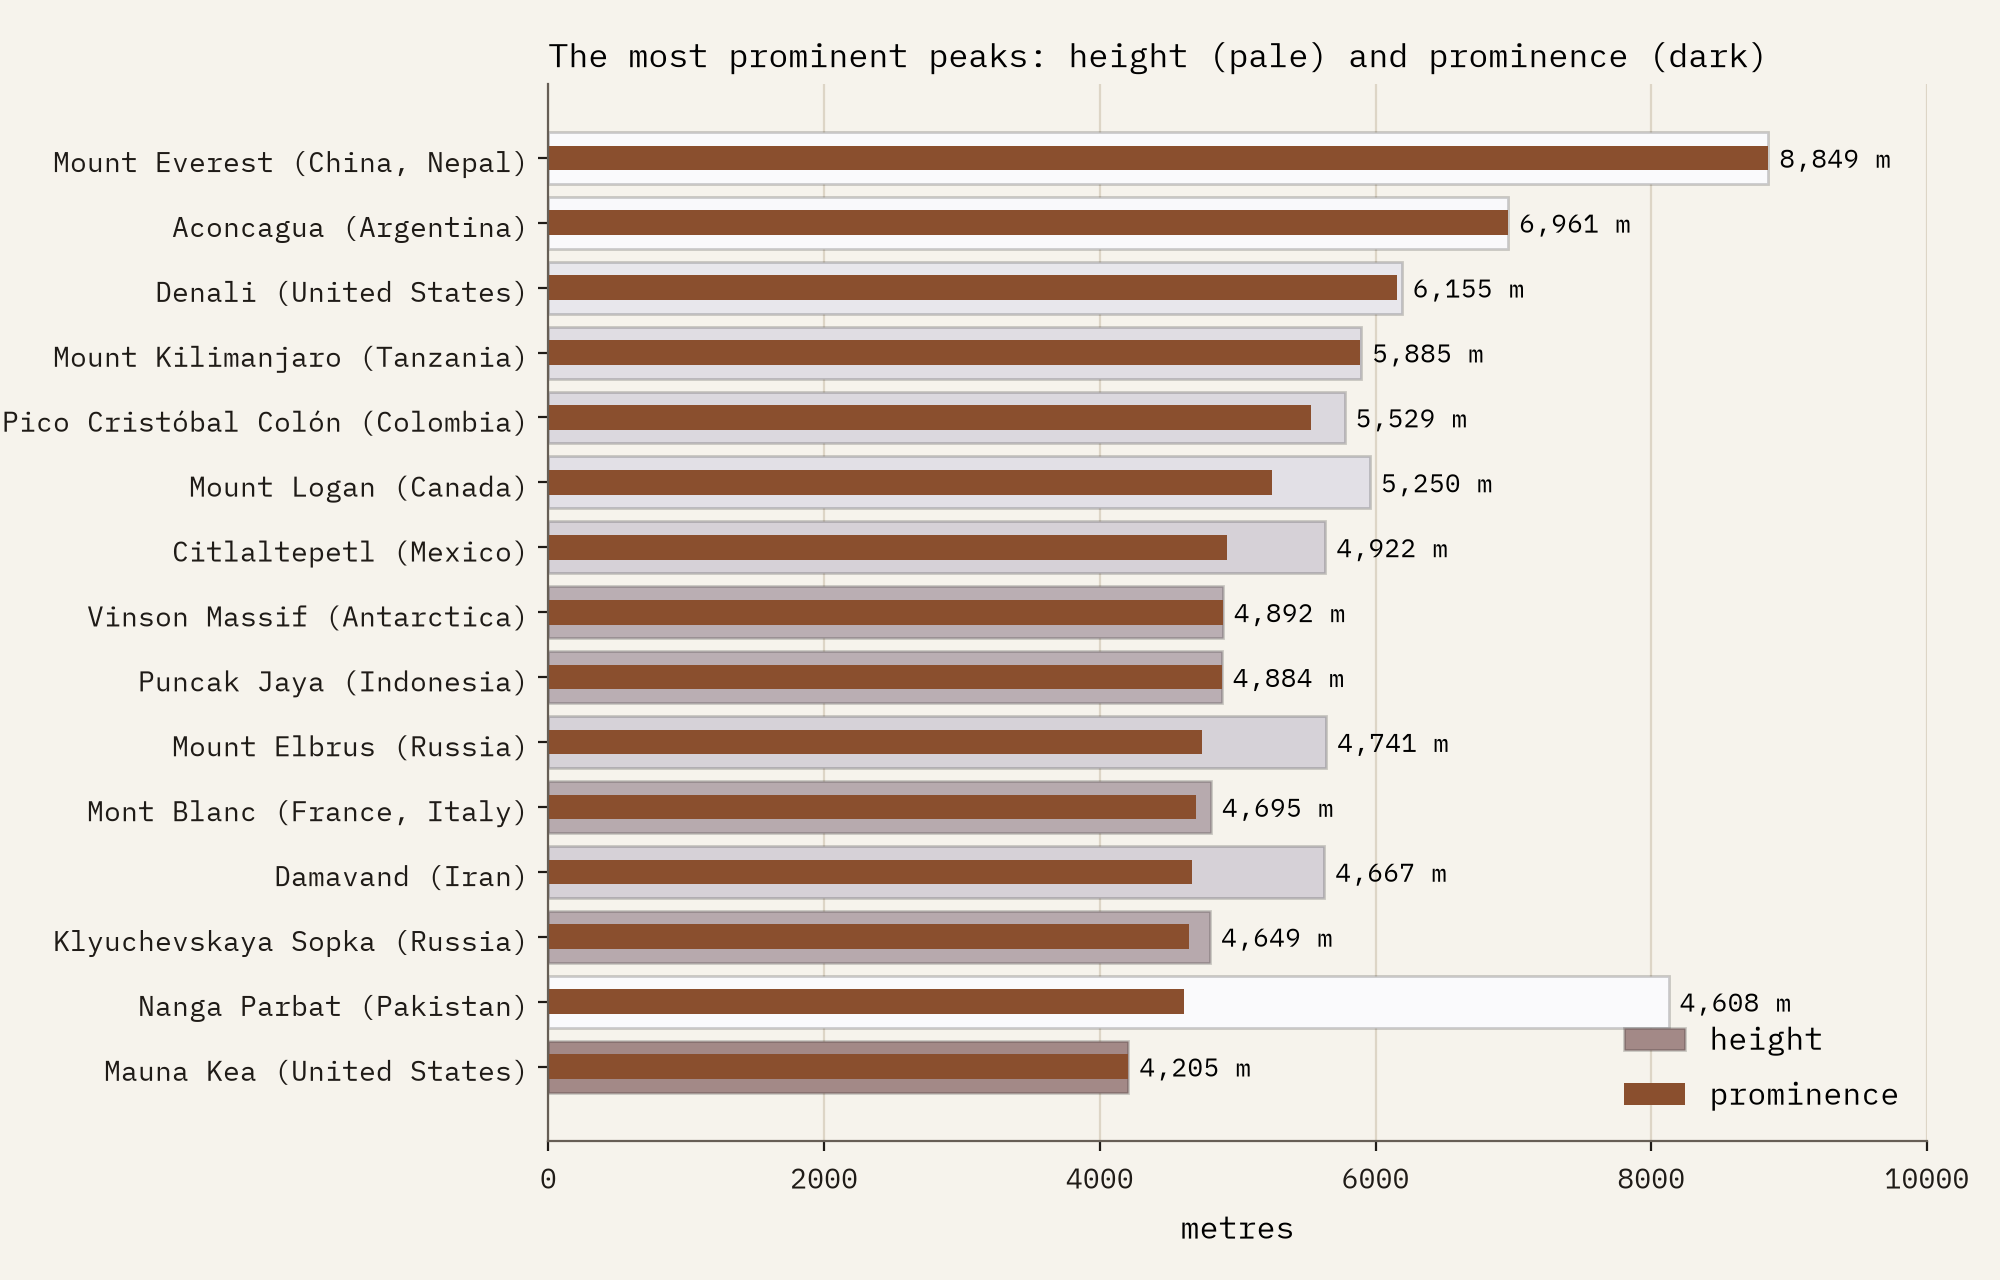
Height is not the only way to rank a mountain. Prominence asks how far you must descend from a summit before you can climb anything higher. Everest’s prominence is its whole height; next come Aconcagua (6,961 m), Denali and Mount Kilimanjaro, then Colombia’s Pico Cristóbal Colón, which rises 5,529 m from the Caribbean shore. K2, the second highest mountain on Earth, is only 22nd by prominence.
High land, low people
Then I set the land against the people. Wikidata gives a height and a population for 4,325 cities of 50,000 or more, home to 2.6 billion people. Half of them live below 92 m. Above 2,000 m lies 11% of the world’s land but only 1.9% of these people, 5.7 times fewer.
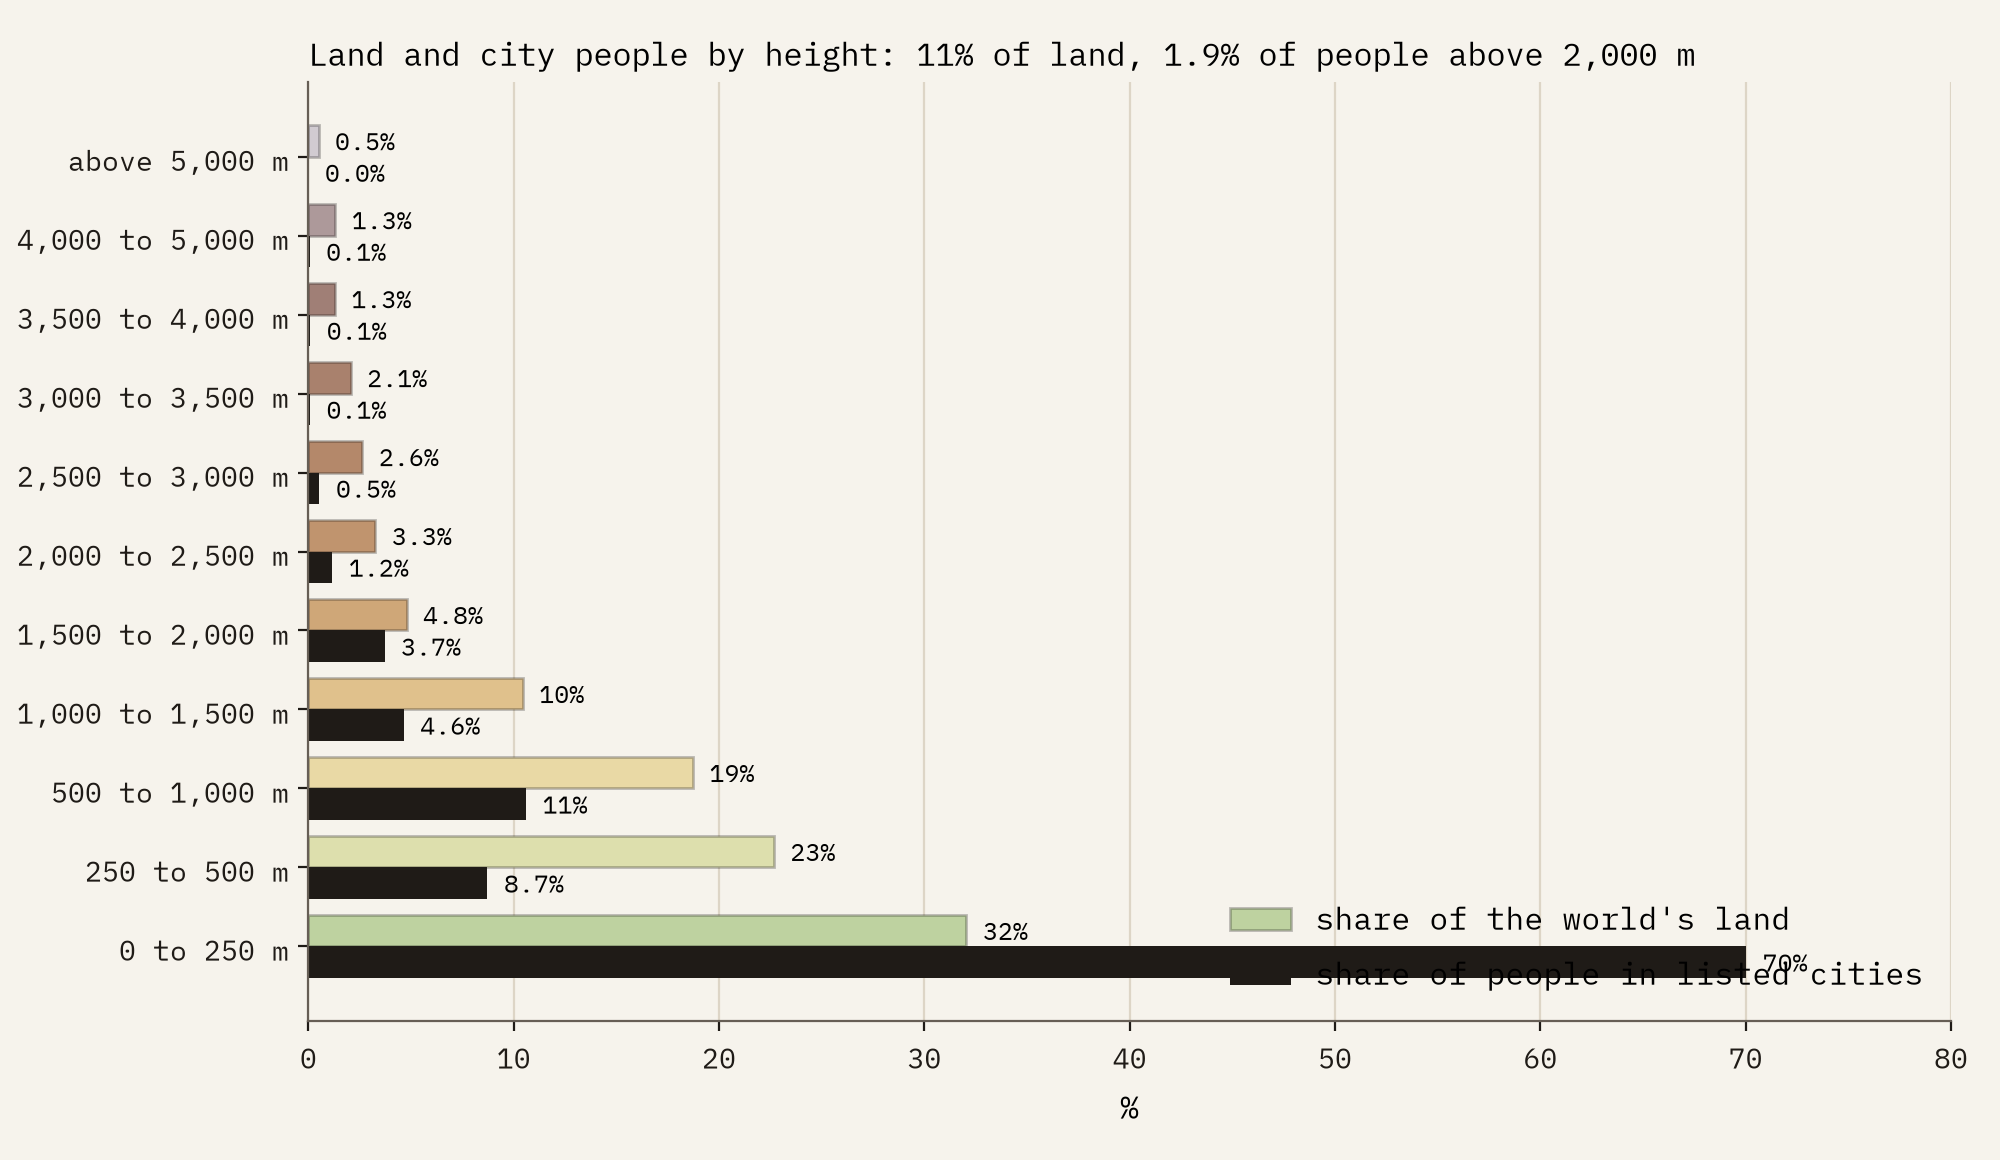
11% of the world’s land is above 2,000 m. 1.9% of its city dwellers are.
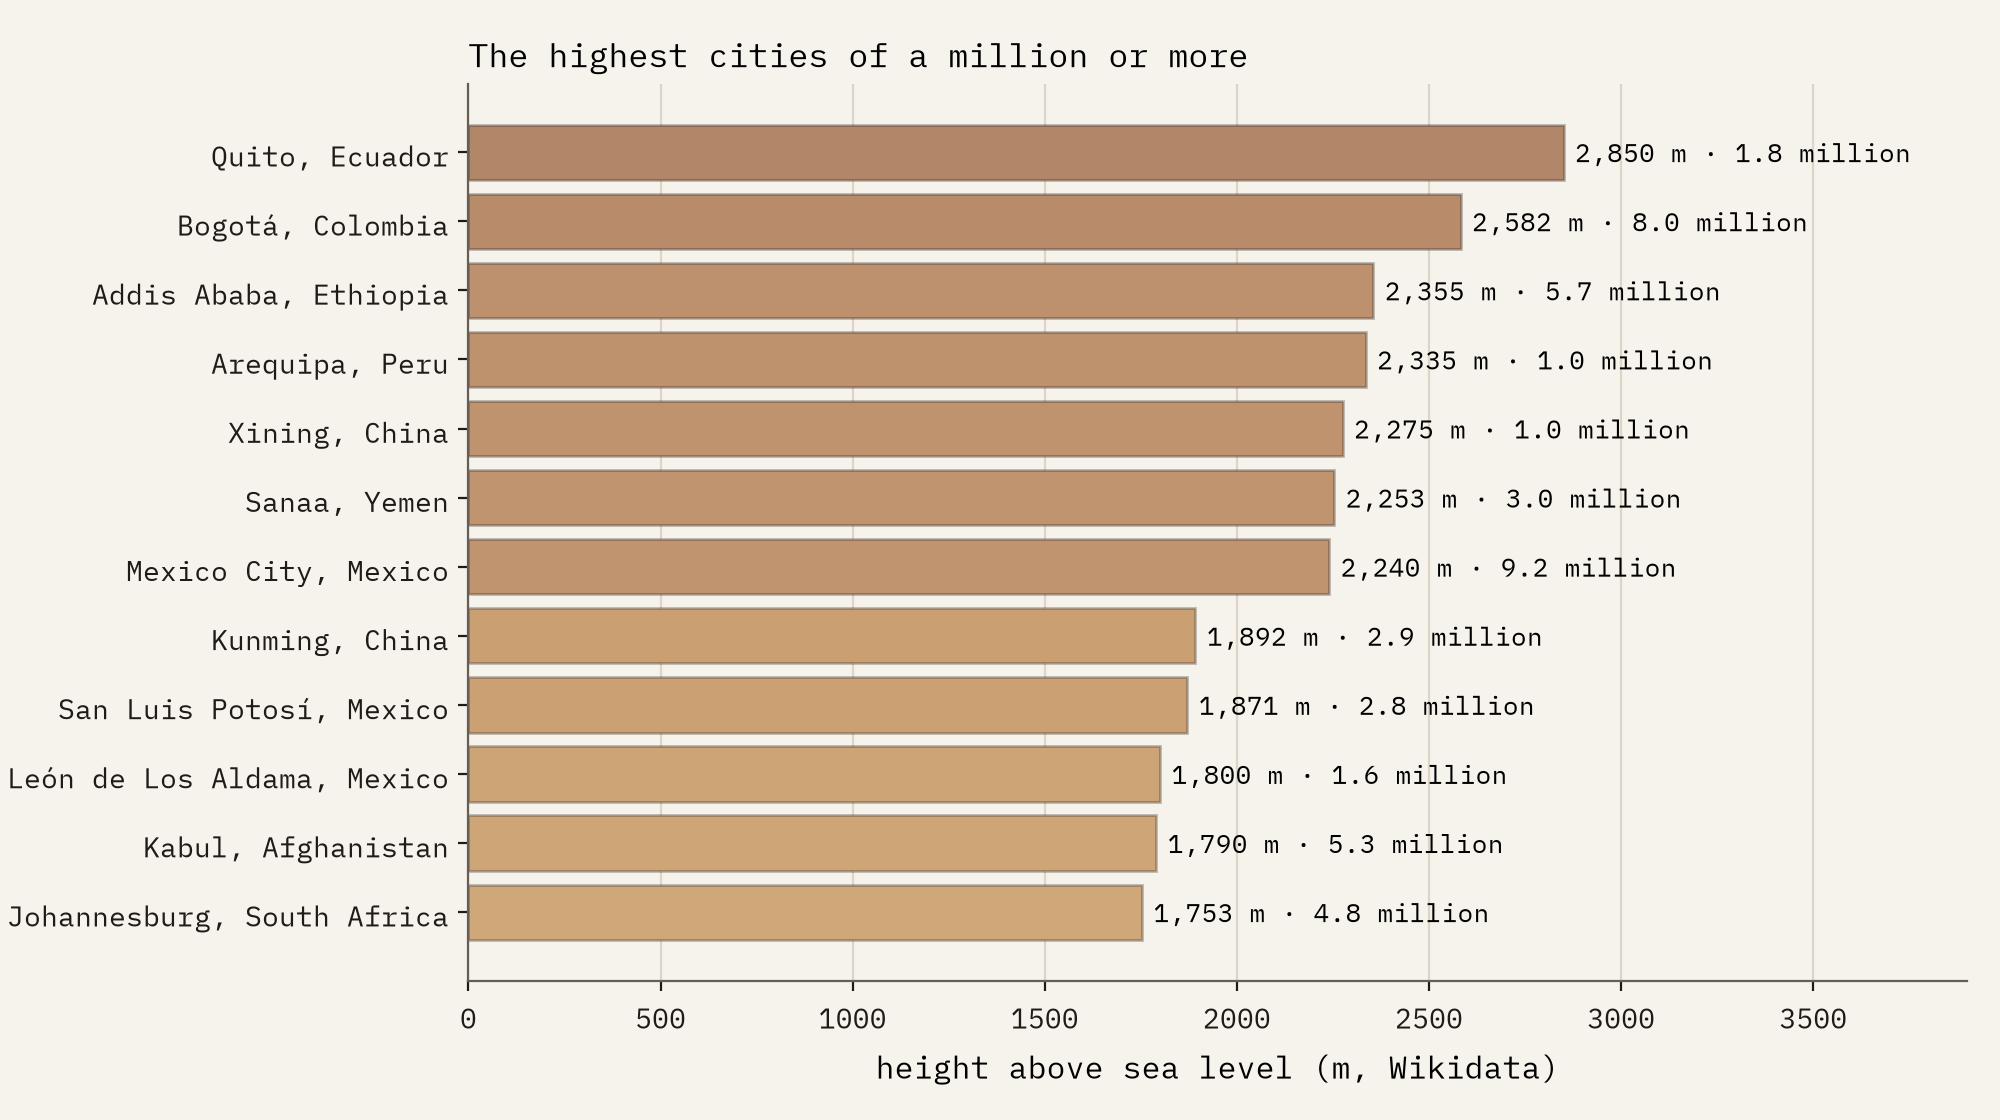
The exceptions are glorious. Quito, at 2,850 m, is the highest city of a million or more, and Mexico City, Bogotá and Addis Ababa are the biggest above 2,000 m. La Paz is the highest capital at 3,640 m, and its neighbour El Alto stands at 4,150 m. In all, 18 of the listed cities are above 3,000 m.
Below the sea
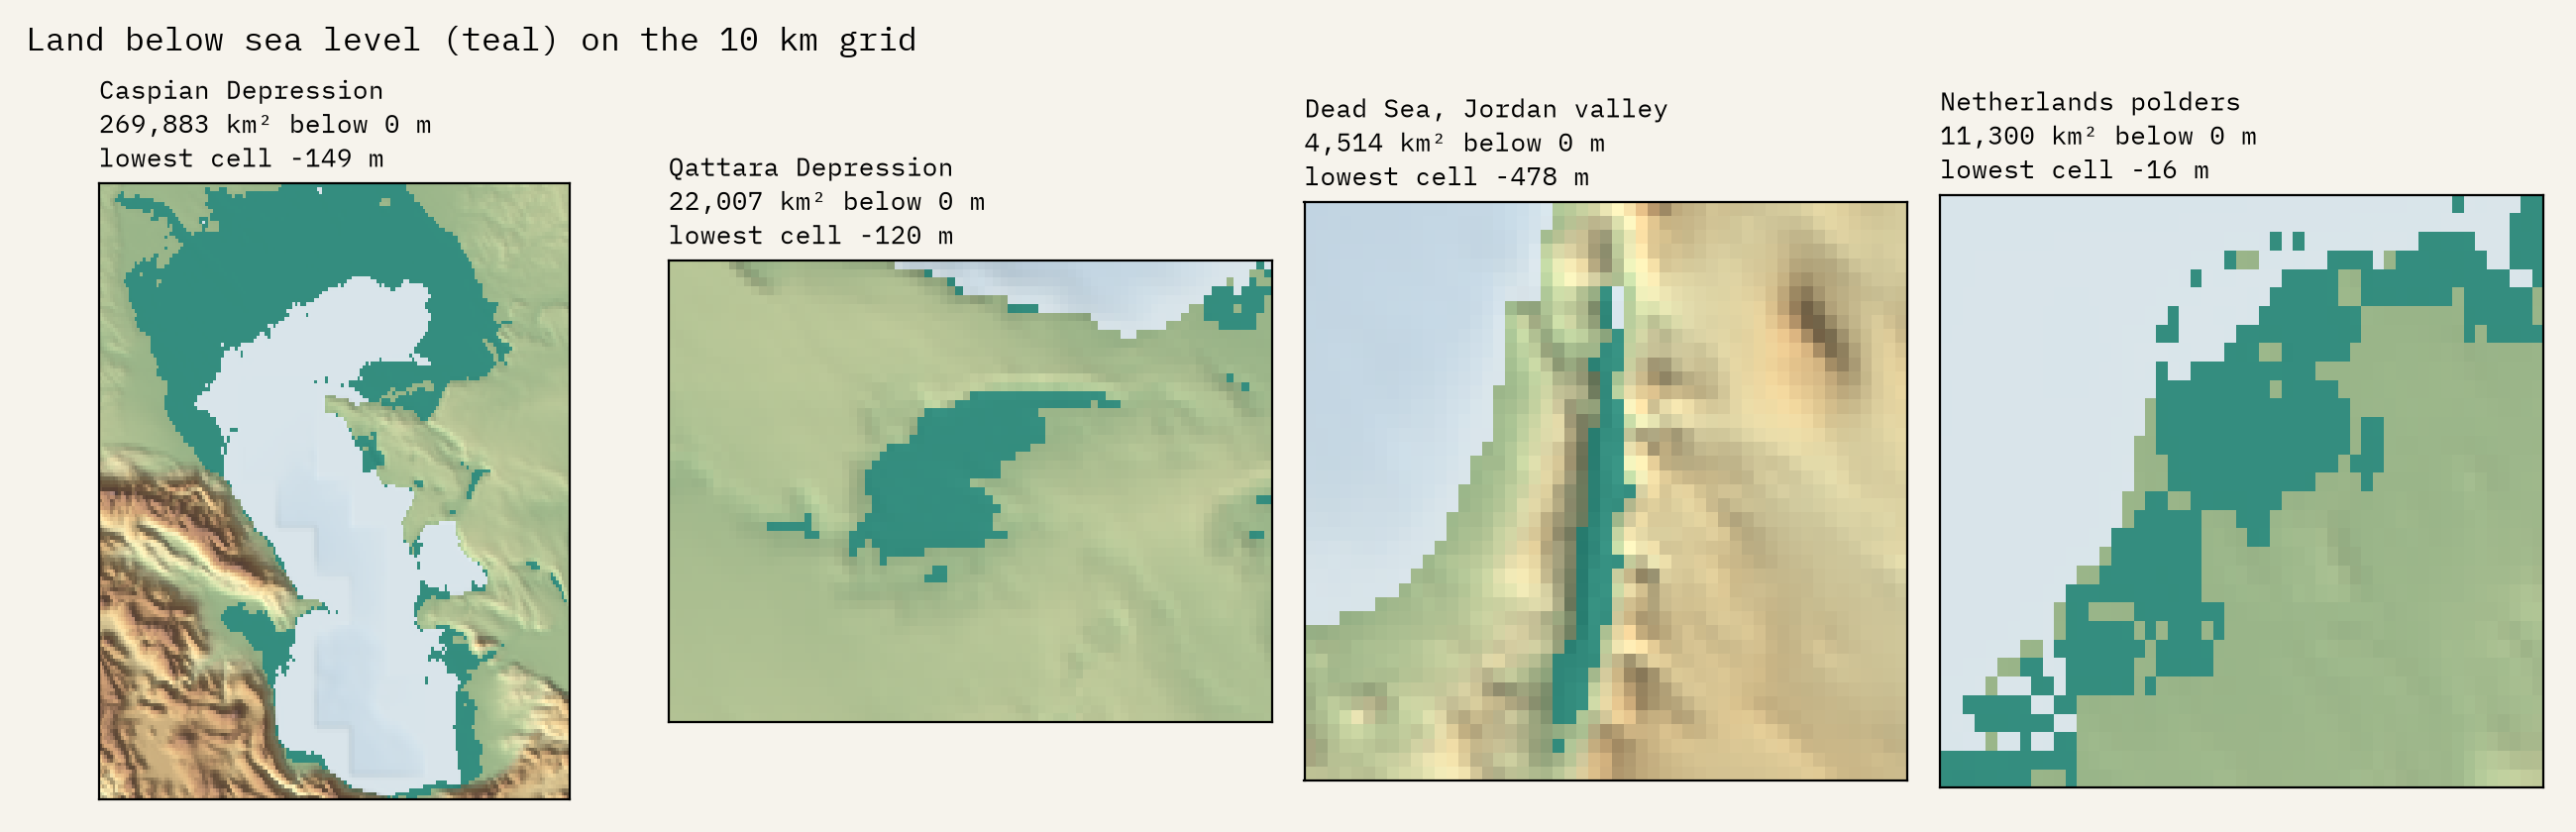
A little land lies below sea level, kept dry by deserts or dykes. On the 10 km grid the named depressions add up to 355,893 km², and 76% of that is the plain around the Caspian Sea, where Baku sits 28 m below sea level. Then come Egypt’s Qattara Depression, the salt pan of Kati Thanda-Lake Eyre, the polders of the Netherlands and the Afar depression. The Dead Sea shows as a narrow trench reaching 478 m down.
How I did this
The statistics use the zoom 4 level of the AWS Terrain Tiles, a 4,096 by 4,096 grid in the Web Mercator projection, with every cell weighted by its true area. Land is Natural Earth’s countries less their lakes; coastal cells, which mix land with sea floor, are not allowed below sea level; Antarctica south of 85 degrees comes from ETOPO10; and 13 corrupt cells were repaired. Peaks and cities come from Wikidata, checked against the terrain, with peaks added from Natural Earth and Wikipedia. The interactive map draws the same tiles live at every zoom, with tints, shading, height steps and a readout of any point. The numbers are smoothed to about 10 km, so they understate peaks and valleys and say little about tiny countries; the paper sets out every step and caveat.
Notes and sources
- AWS Terrain Tiles (Mapzen, Terrarium format), combining SRTM, GMTED2010, ETOPO1, NED and 3DEP, the Canadian DEM, EU-DEM, Geoscience Australia, LINZ, INEGI, OS Terrain 50, ArcticDEM and others; full sources and terms.
- ETOPO10, a 10 arc minute grid derived from NOAA’s ETOPO1 (public domain).
- Wikidata mountains, summits, volcanoes and cities. CC0.
- Natural Earth countries, lakes, places and elevation points. Public domain.
- English Wikipedia, List of mountain peaks by prominence. CC BY-SA 4.0.
- A peakbagger.com list of national high points, used only as a check.
- I wrote the text, with drafting and editing assistance from Claude (Anthropic), which also helped prepare the analysis code. I reviewed and checked all text and results.

