
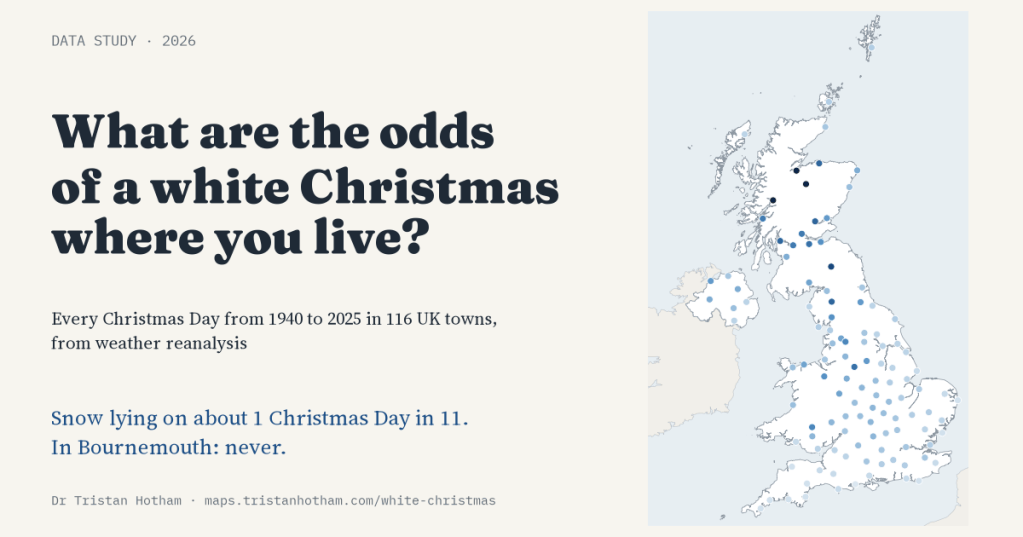
Every December the same question comes round: will it snow on Christmas Day? I went back through every Christmas Day from 1940 to 2025 in 116 towns across the UK to work out the odds where you live. The short answer: lower than the cards suggest, very different from town to town, and decided by a handful of years.
Ask the Met Office whether a Christmas was white and you get a famously generous answer. For the bookmakers, a single snowflake seen falling on 25 December at one of its stations is enough. By that rule a white Christmas somewhere in the country is fairly common. But it is not what most of us picture. We picture snow on the ground.
Weather stations are patchy, so I used weather reanalysis instead: ERA5 and ERA5-Land, the European reconstructions of the weather everywhere on Earth, hour by hour, built by blending a weather model with millions of observations. Through the free Open-Meteo service I pulled Christmas Day for 116 towns, from big cities to Lerwick, Stornoway and Bournemouth, and sorted each one into snow falling, snow lying (more than 1 cm on the ground), both, or neither.
About one Christmas in 11
Across all the towns, snow lay on the ground on 8.8% of Christmas Days since 1950, about one in 11. Snow fell on 8.8% of them since 1940. The picture postcard, snow falling onto snow that is already lying, came along on just 3.6%, about one Christmas in 28.
Where you live matters enormously. In 76 years of data, snow never lay on Christmas Day in Bournemouth. It lay just once in 9 more towns, all in southern and eastern England, Devon and Cornwall, and all on or near the coast. London managed 5 snowy Christmases, Birmingham 6, Manchester 7, Edinburgh 11 and Glasgow 13.
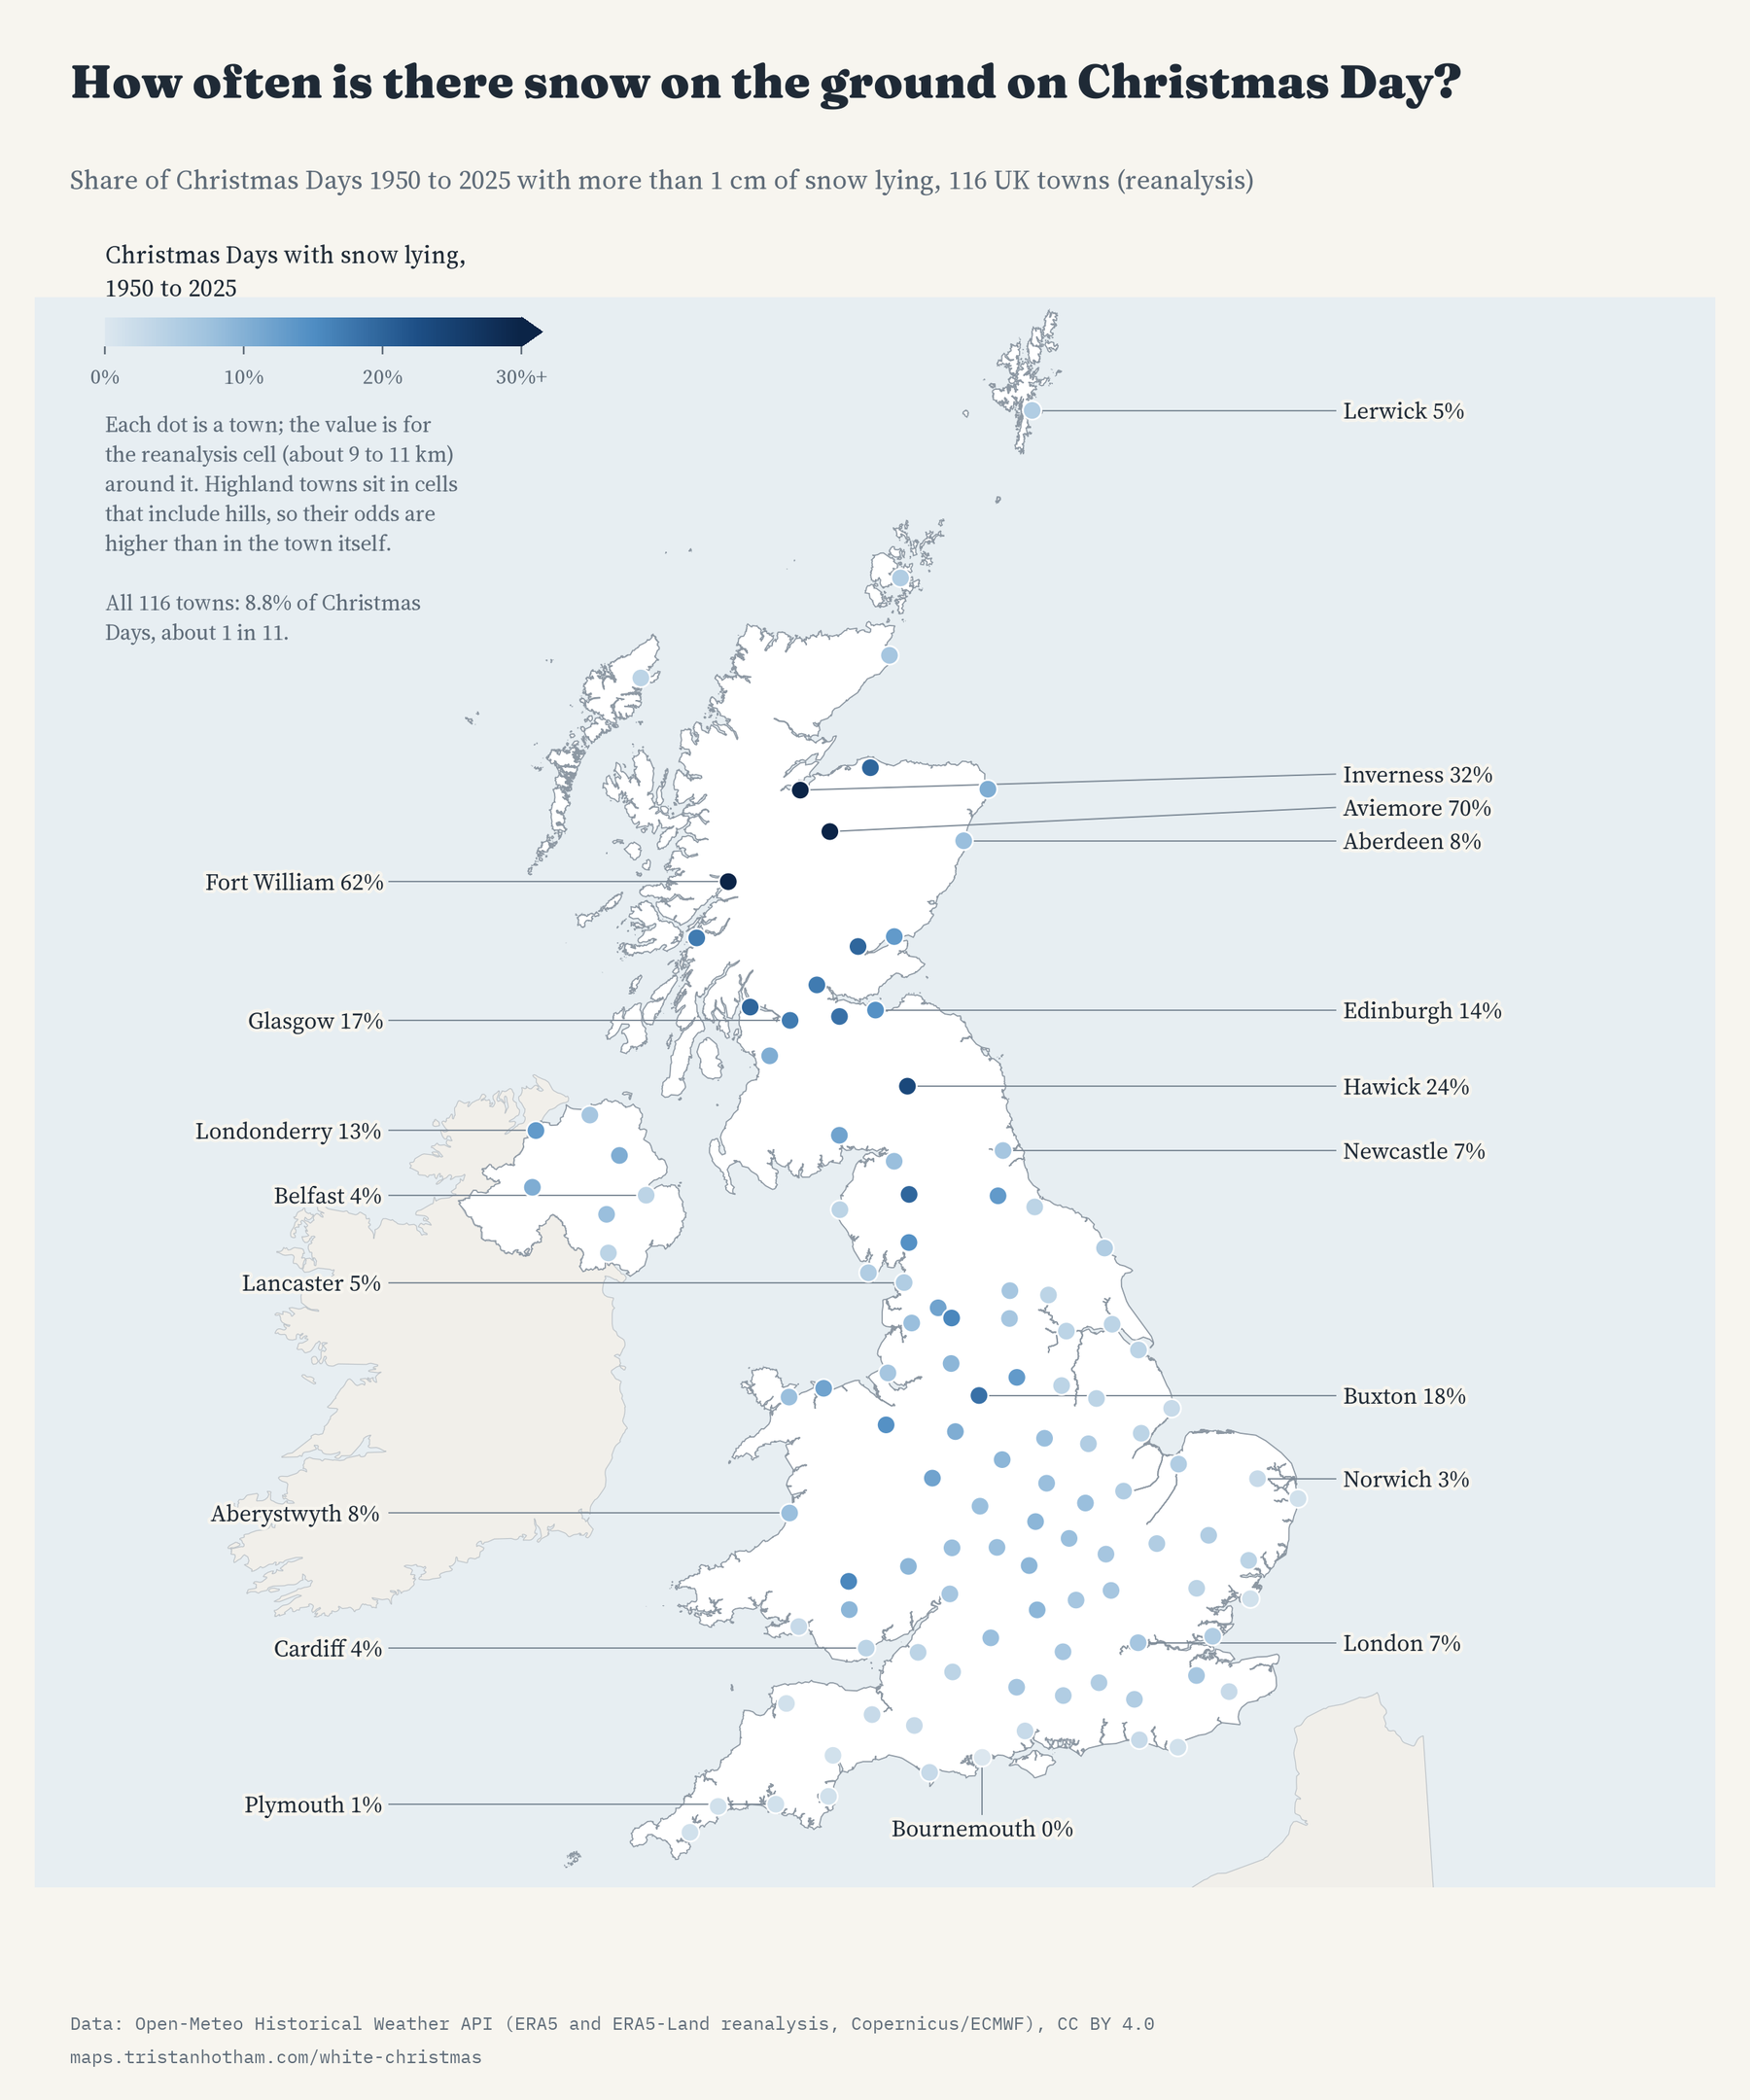
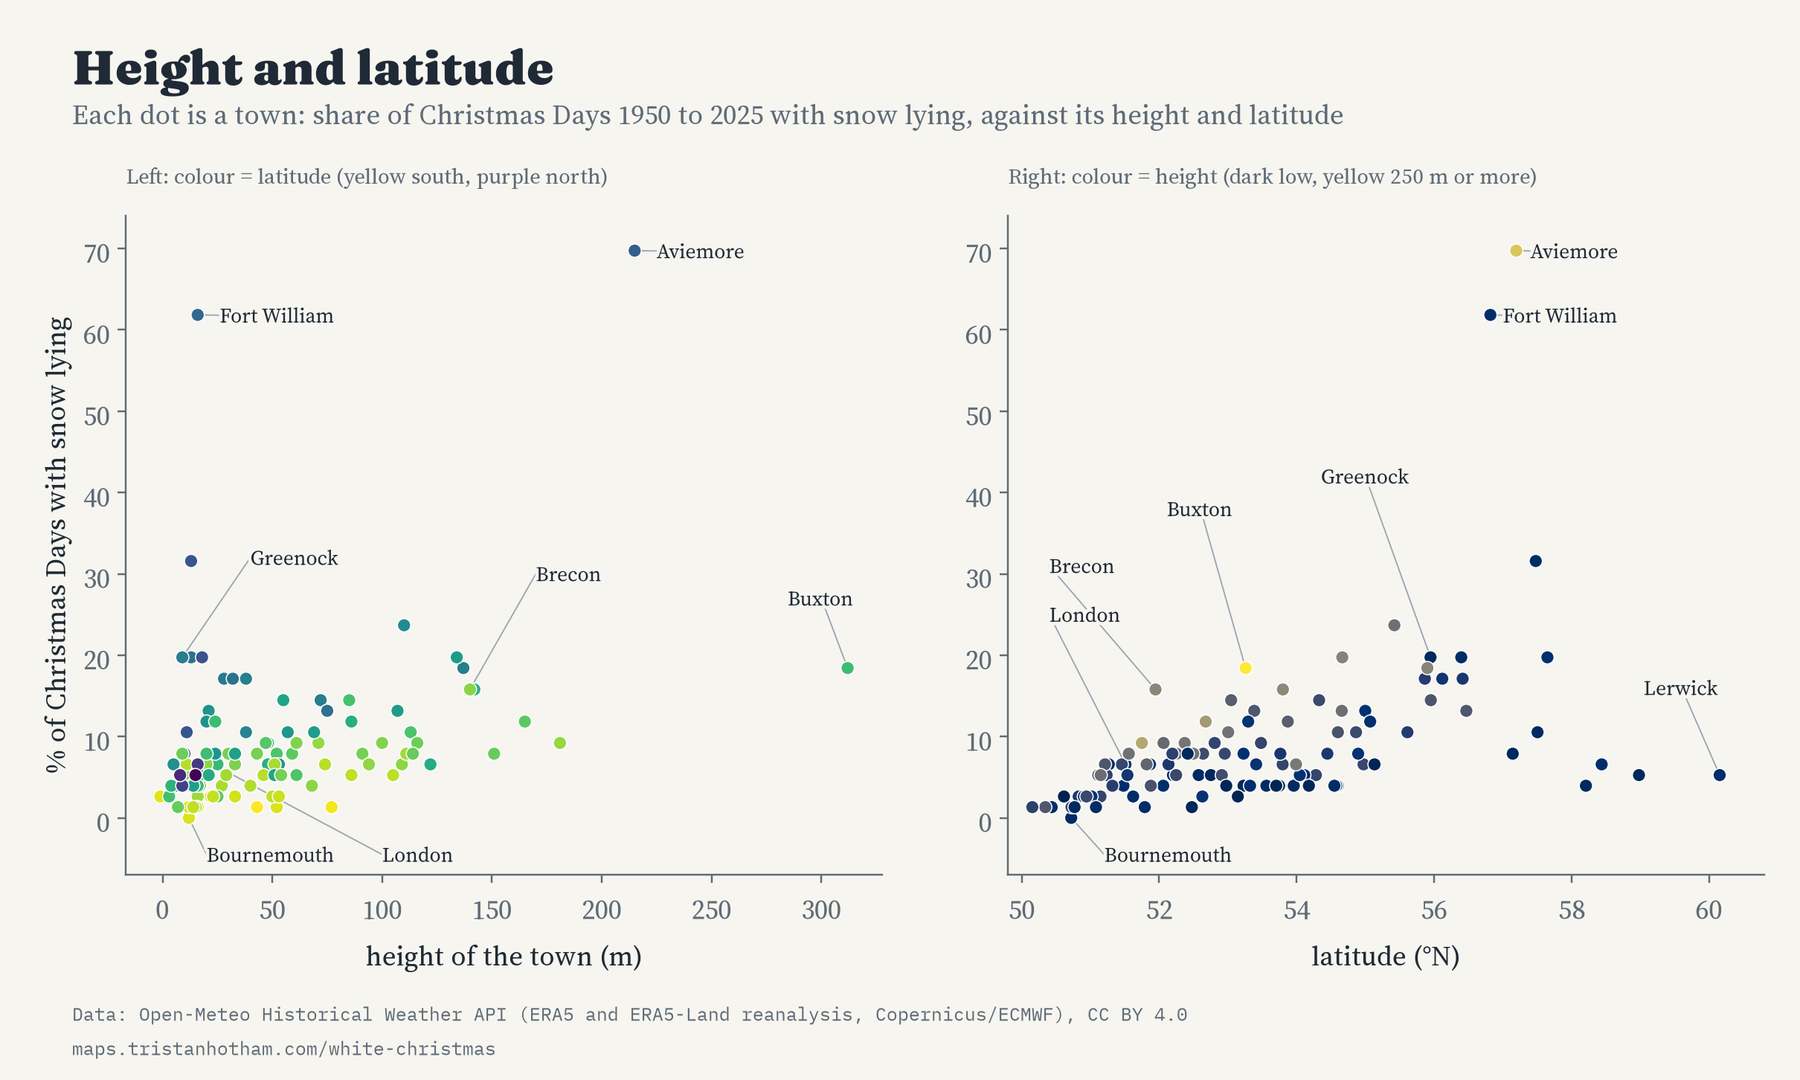
Two things do most of the work: height and latitude. Every 100 m of height multiplies the odds of snow on the ground by about 3.4, and every degree further north by about 1.6. Buxton, at 312 m the highest town I looked at, had a snowy Christmas 14 times. Scotland as a whole had snow lying on 19% of town Christmases, England on 6%.
The top of the list comes with a warning. Aviemore (70%) and Fort William (62%) look like near certainties, but the reanalysis works in squares about 9 to 11 km across, and theirs take in the slopes of the Cairngorms and the Nevis range. The model is also known to put too much snow on mountains. Those numbers describe the hills around the towns as much as the high street.
A few big years
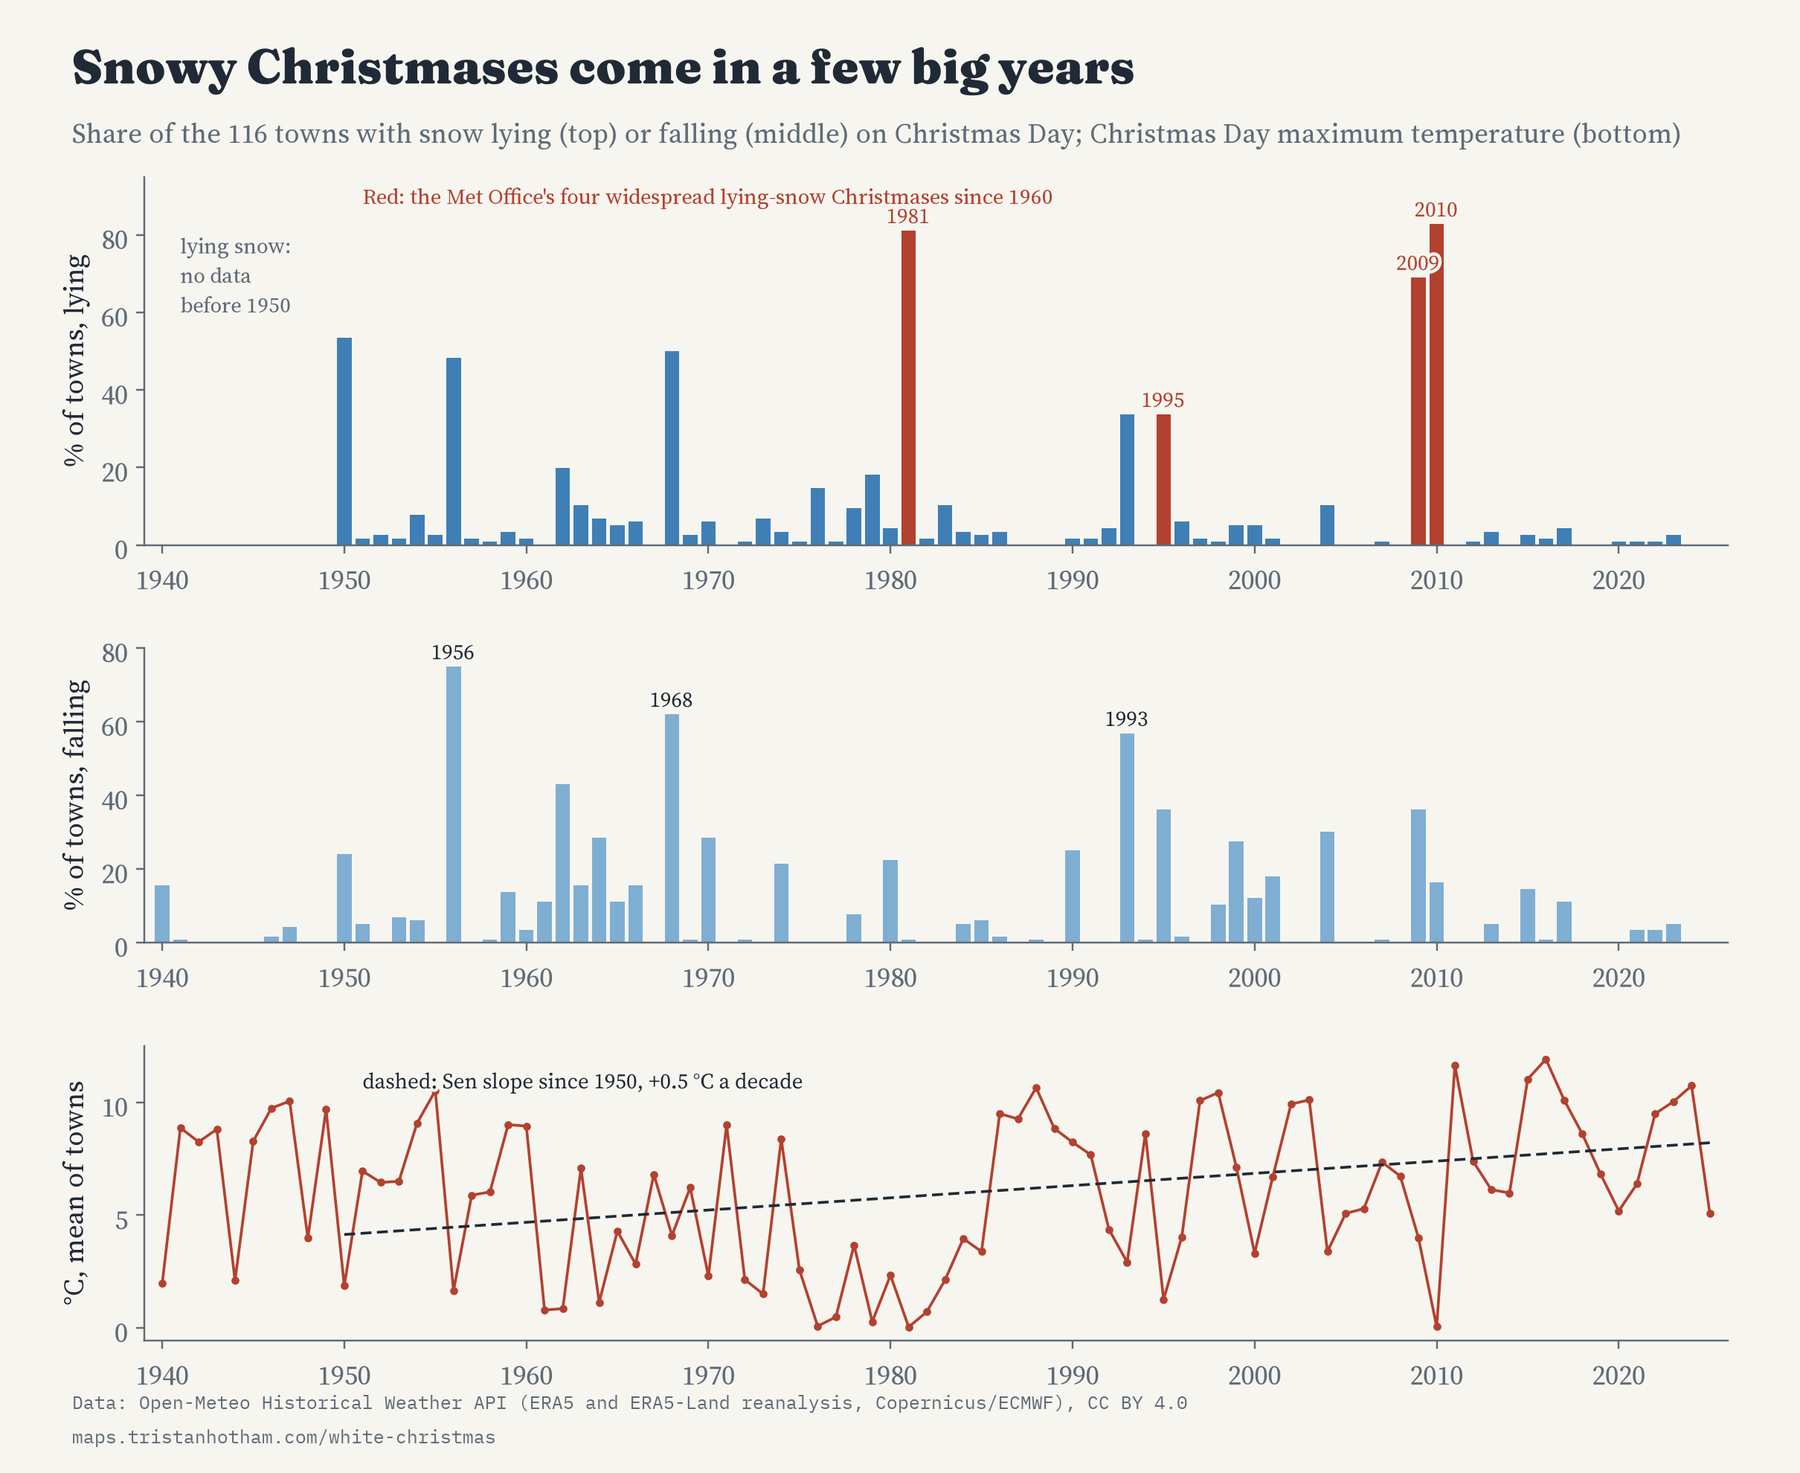
The most striking thing in the data is how lumpy it is. White Christmases do not trickle along at one in 11 in each town. They arrive all at once, in a few years when snow covers most of the country, with long gaps between. In 2010 snow lay in 96 of the 116 towns. In 1981 it lay in 94, even though hardly any fell on the day itself: it had fallen before Christmas and was still there. In 2024 and 2025, it lay in none.
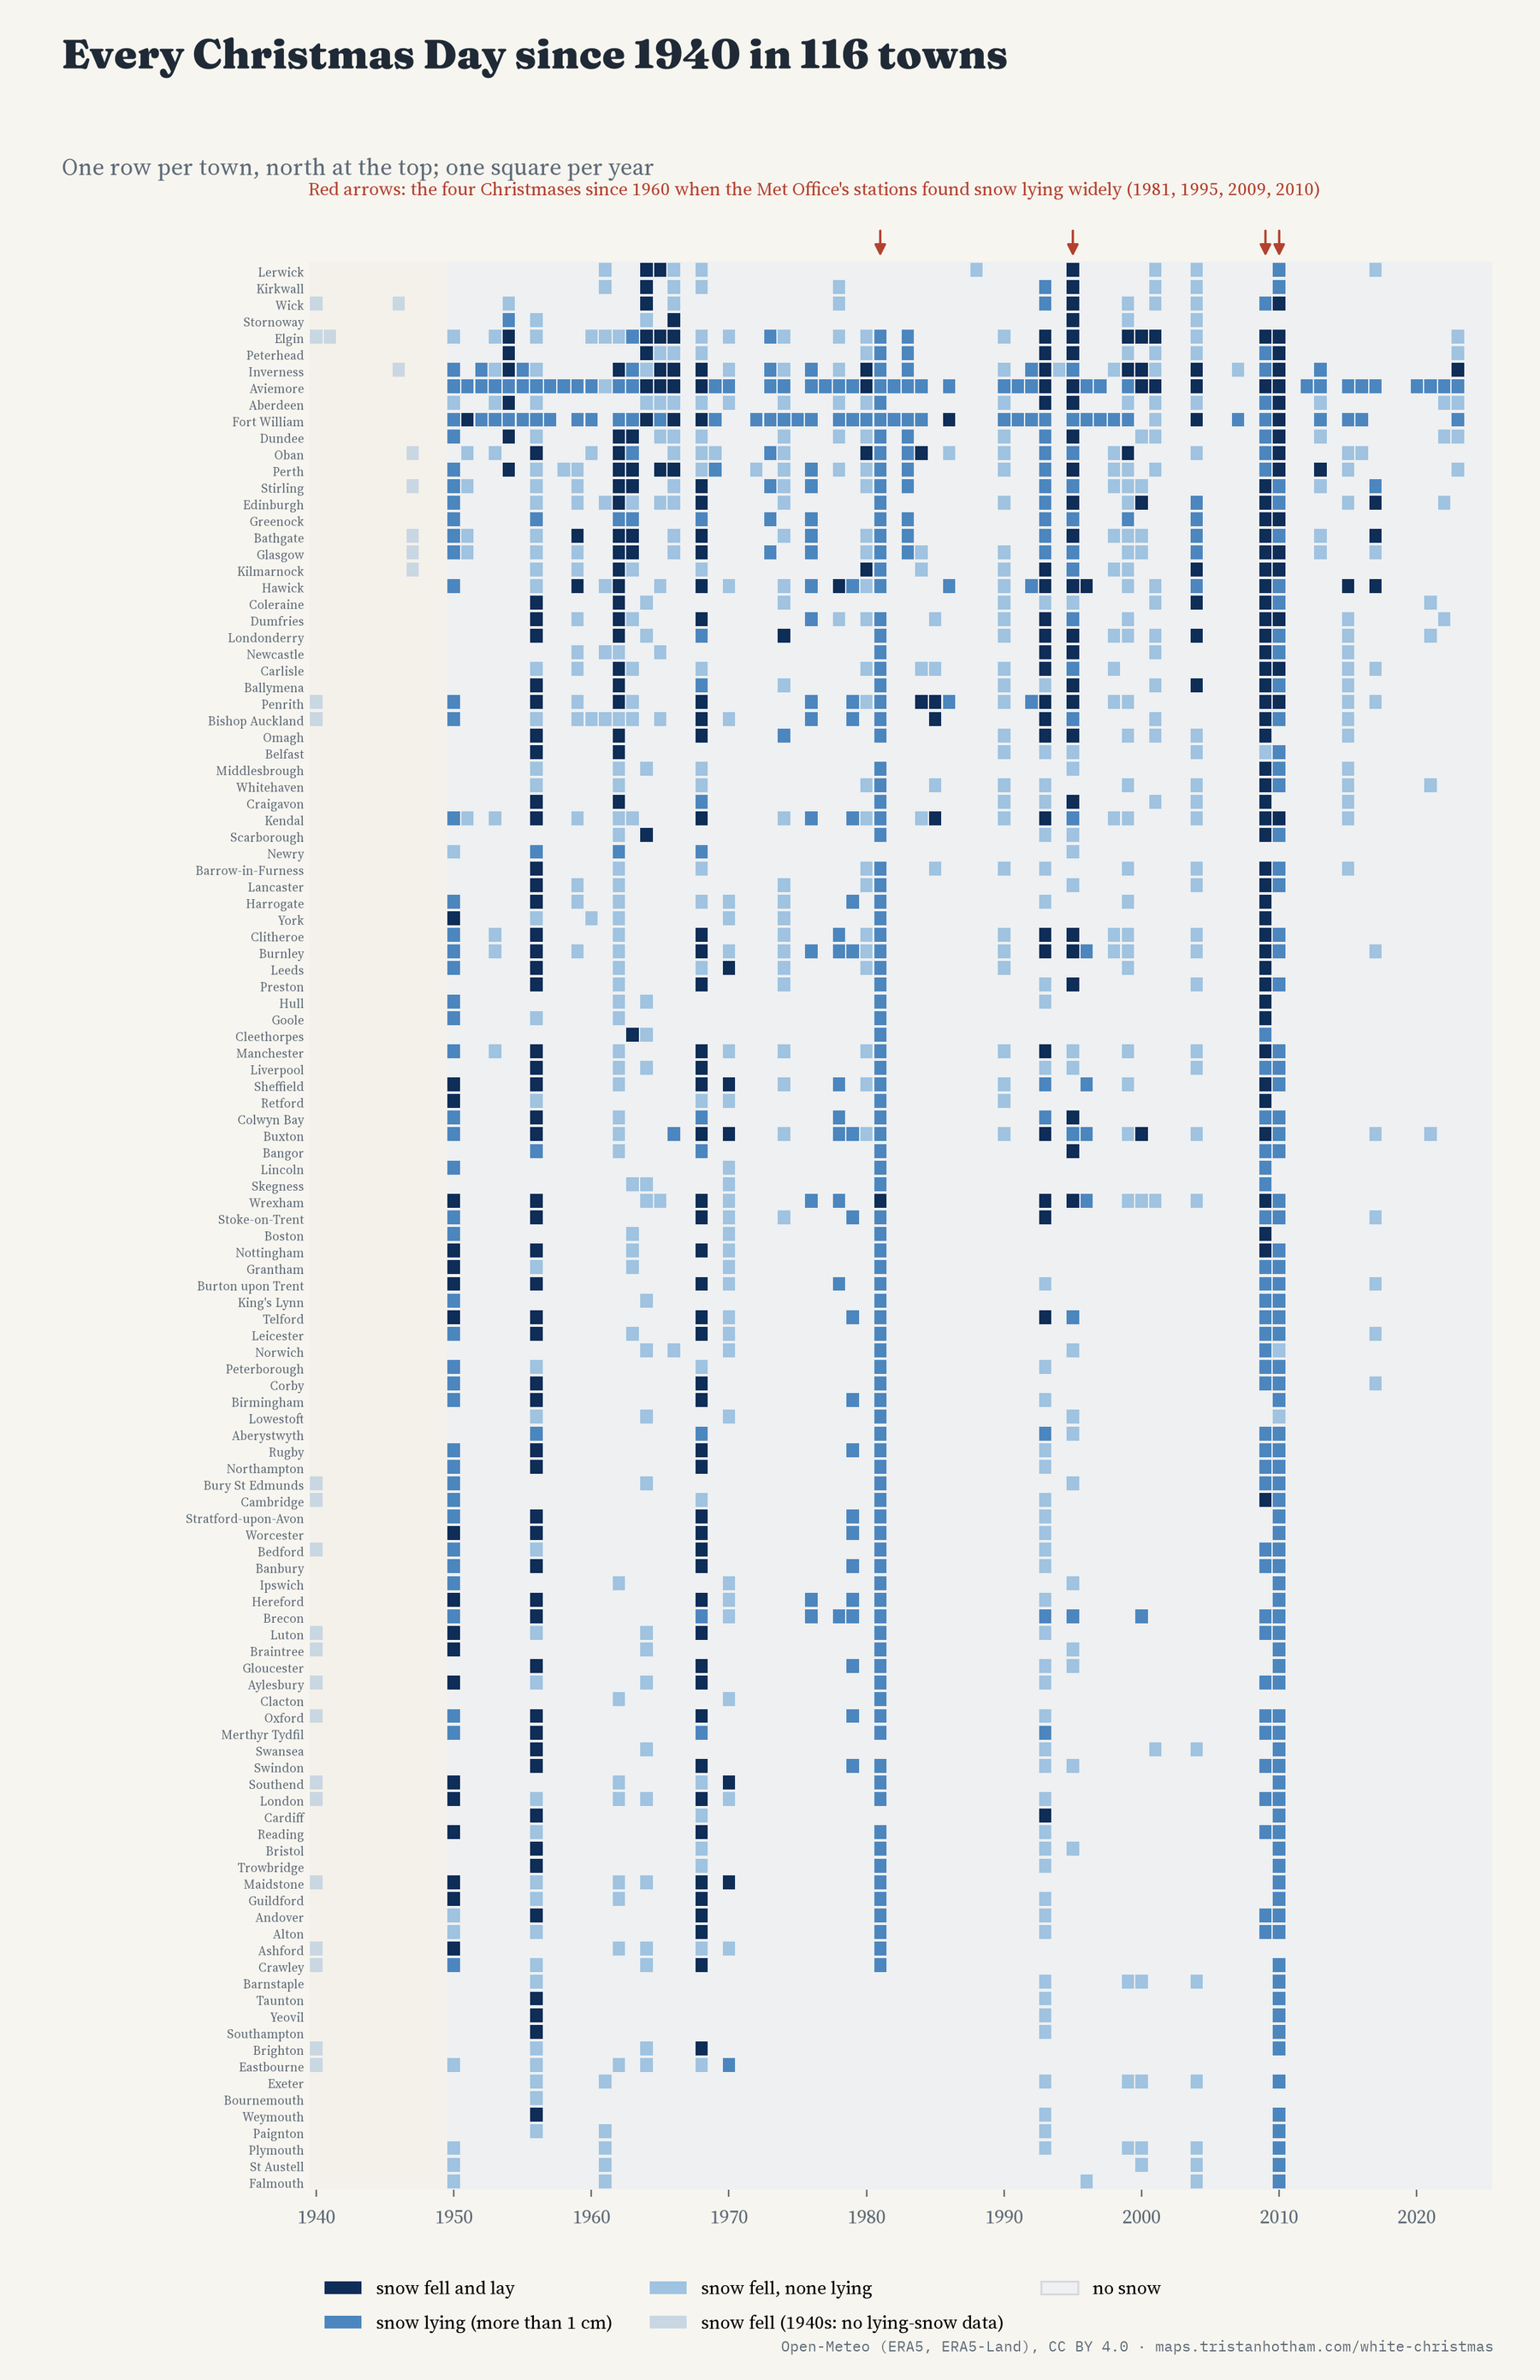
Does a reconstruction get this right? The Met Office lists four Christmases since 1960 when more than 40% of its stations had snow on the ground at 9 in the morning: 1981, 1995, 2009 and 2010. In the reanalysis those four come first, second, third and fifth out of all 66 Christmases since 1960. The chance of that happening by luck is about 7 in a million. I was relieved.
White Christmases do not trickle along. They arrive all at once, in a few years when snow covers most of the country.
Getting rarer?
Probably, but it is closer than you might think. Split the years since 1950 in half and snow lay on 10.4% of town Christmases from 1950 to 1987, against 7.3% from 1988 to 2025. Christmases with no lying snow in any of the towns went from 4 of 38 to 14 of 38, and a standard trend test on the yearly share of towns with snow lying finds a decline unlikely to be chance. The last Christmas with snow lying in at least one town in ten was 2010. Christmas Day itself has warmed by about 0.5°C a decade since 1950.
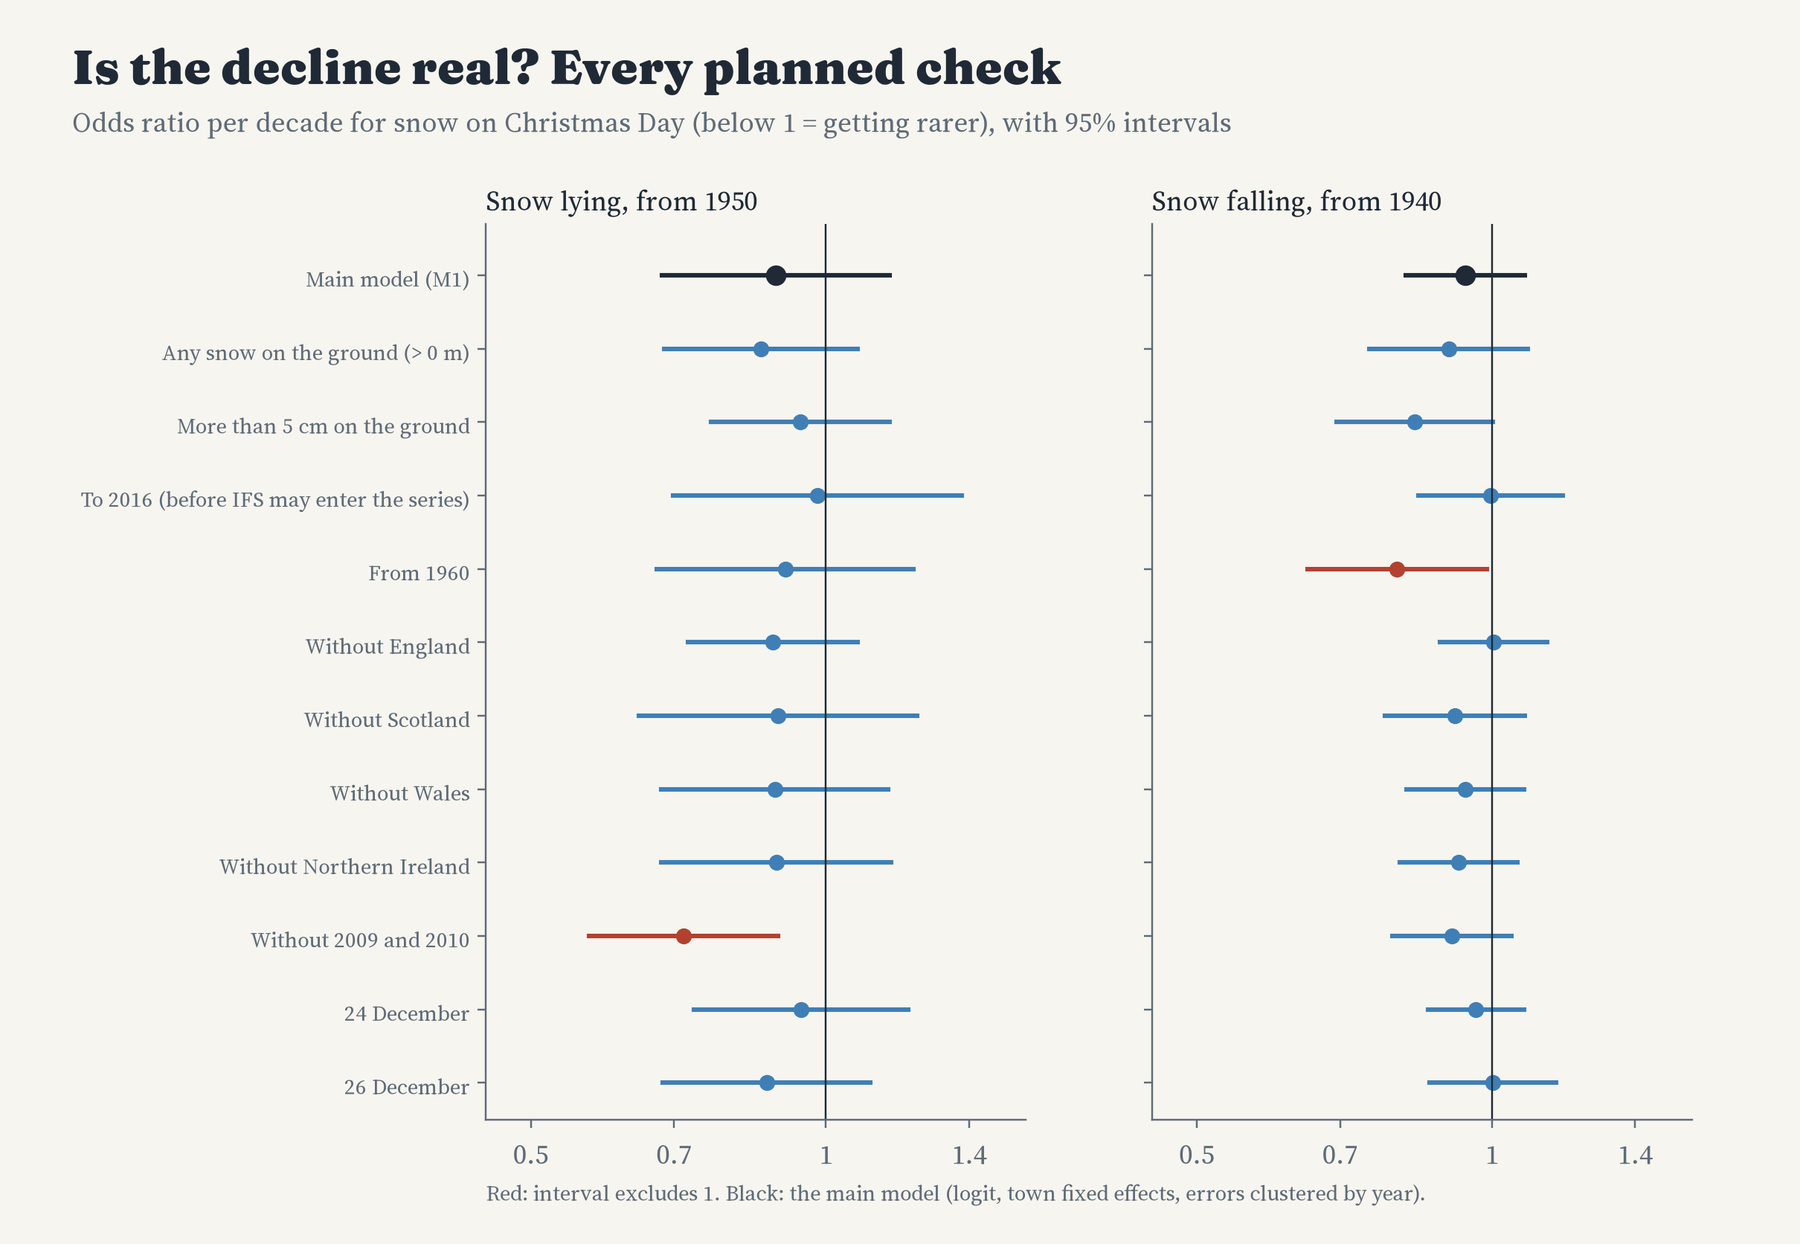
But I wrote down my main test before looking at the results, and it does not find a decline it can tell apart from chance. The reason is 2009 and 2010: two of the three snowiest Christmases in 66 years came recently, and they balance out a lot of green ones. Leave just those two years out and the decline is clear. Leave them in and it is not. So the honest answer is that white Christmases have probably become rarer, as you would expect when the day is getting warmer, but a run of lucky years can still turn up.
How I did this
For each town and each year I took the snowfall, the depth of snow on the ground and the top temperature on 24, 25 and 26 December from the Open-Meteo Historical Weather API, which serves ERA5 (from 1940) and ERA5-Land (from 1950). Snow depth only exists from 1950, so lying snow starts there. “Falling” means any snowfall at all in the reanalysis square; “lying” means more than 1 cm on the ground at some point on Christmas Day. The trend model compares each town with itself over time and treats each Christmas as one piece of evidence, since every town shares the same weather that day.
There are limits. A reanalysis is a model guided by observations, not a weather station at the end of your road, and it cannot see the single flake that counts for the bookmakers. It averages over squares several miles across and overdoes snow on hills. The 1940s were less well observed than later decades, and from 2017 the service may switch to a different model for snowfall and temperature. I checked what difference that makes in the paper. And one day a year is a small sample to spot a trend in.
Notes and sources
- Open-Meteo Historical Weather API (Zippenfenig 2023), CC BY 4.0, retrieved 2026. Contains modified Copernicus Climate Change Service information: ERA5 (Hersbach et al. 2020, Quarterly Journal of the Royal Meteorological Society) and ERA5-Land (Muñoz-Sabater et al. 2021, Earth System Science Data).
- Met Office, “Will it be a white Christmas?” (2024), for the snowflake definition and the four widespread snowy Christmases since 1960.
- Further reading: A. L. Kay, “A review of snow in Britain” (Progress in Physical Geography, 2016); I. Brown, “Snow cover variability in Great Britain during a changing climate” (Weather, 2020).
- Base map: OpenFreeMap, OpenStreetMap contributors (ODbL). Boundaries: ONS (Open Government Licence v3.0) and Natural Earth.
- I wrote the text, with drafting and editing assistance from Claude (Anthropic), which also helped prepare the analysis code. I reviewed and checked all text and results.

