
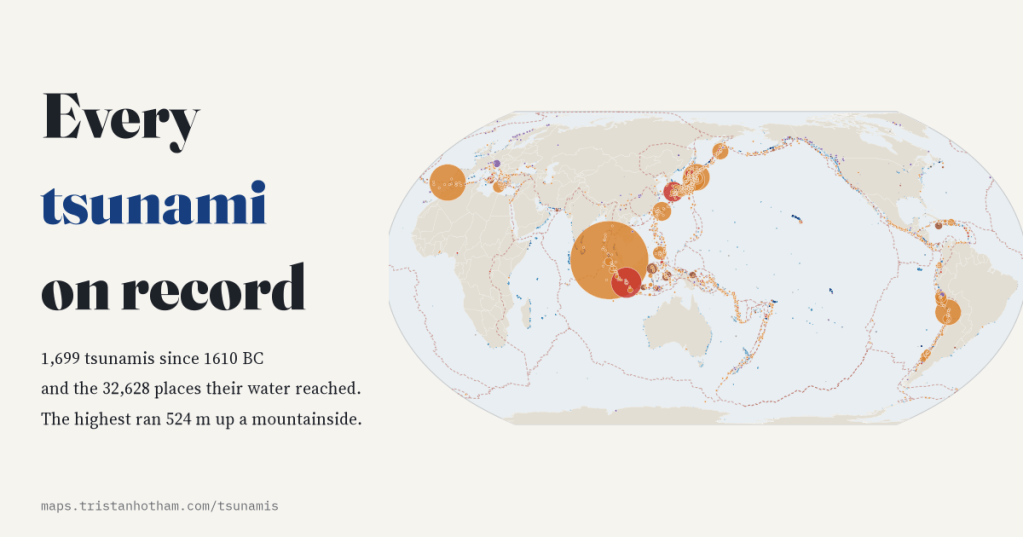
I mapped every tsunami in NOAA’s Global Historical Tsunami Database, 1,699 of them since the eruption of Thera, and every place their water was recorded: where they start, how high the sea ran, how far it travelled and who it killed.
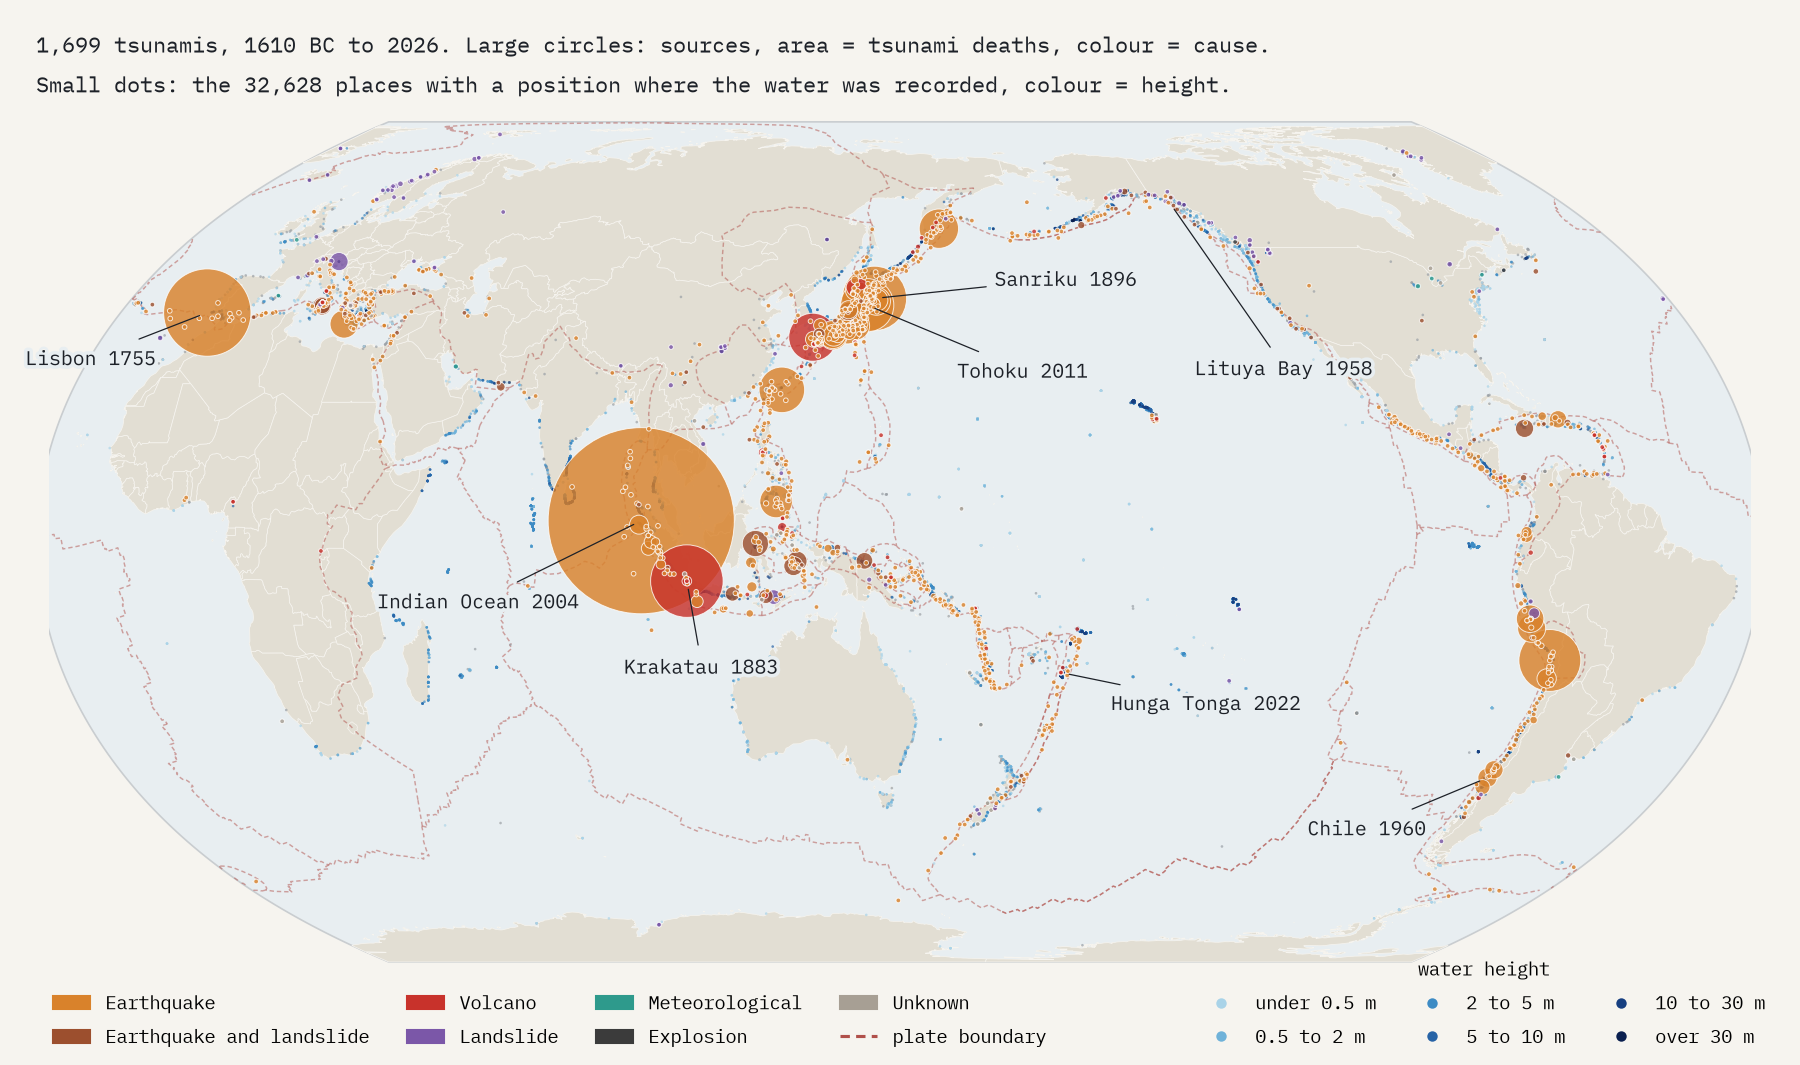
NOAA’s National Centers for Environmental Information keep a list of every tsunami they can find evidence for, from Bronze Age geology to the deep-ocean pressure sensors that now catch waves a few centimetres high. The list is free for anyone to use. It holds 3,138 possible sources, of which NCEI rates 1,699 as definite or probable tsunamis, and 35,129 records of where the water arrived: survey marks, tide gauges and eyewitness reports. I put them all on one map.
Earthquakes, mostly, and mostly in the Pacific
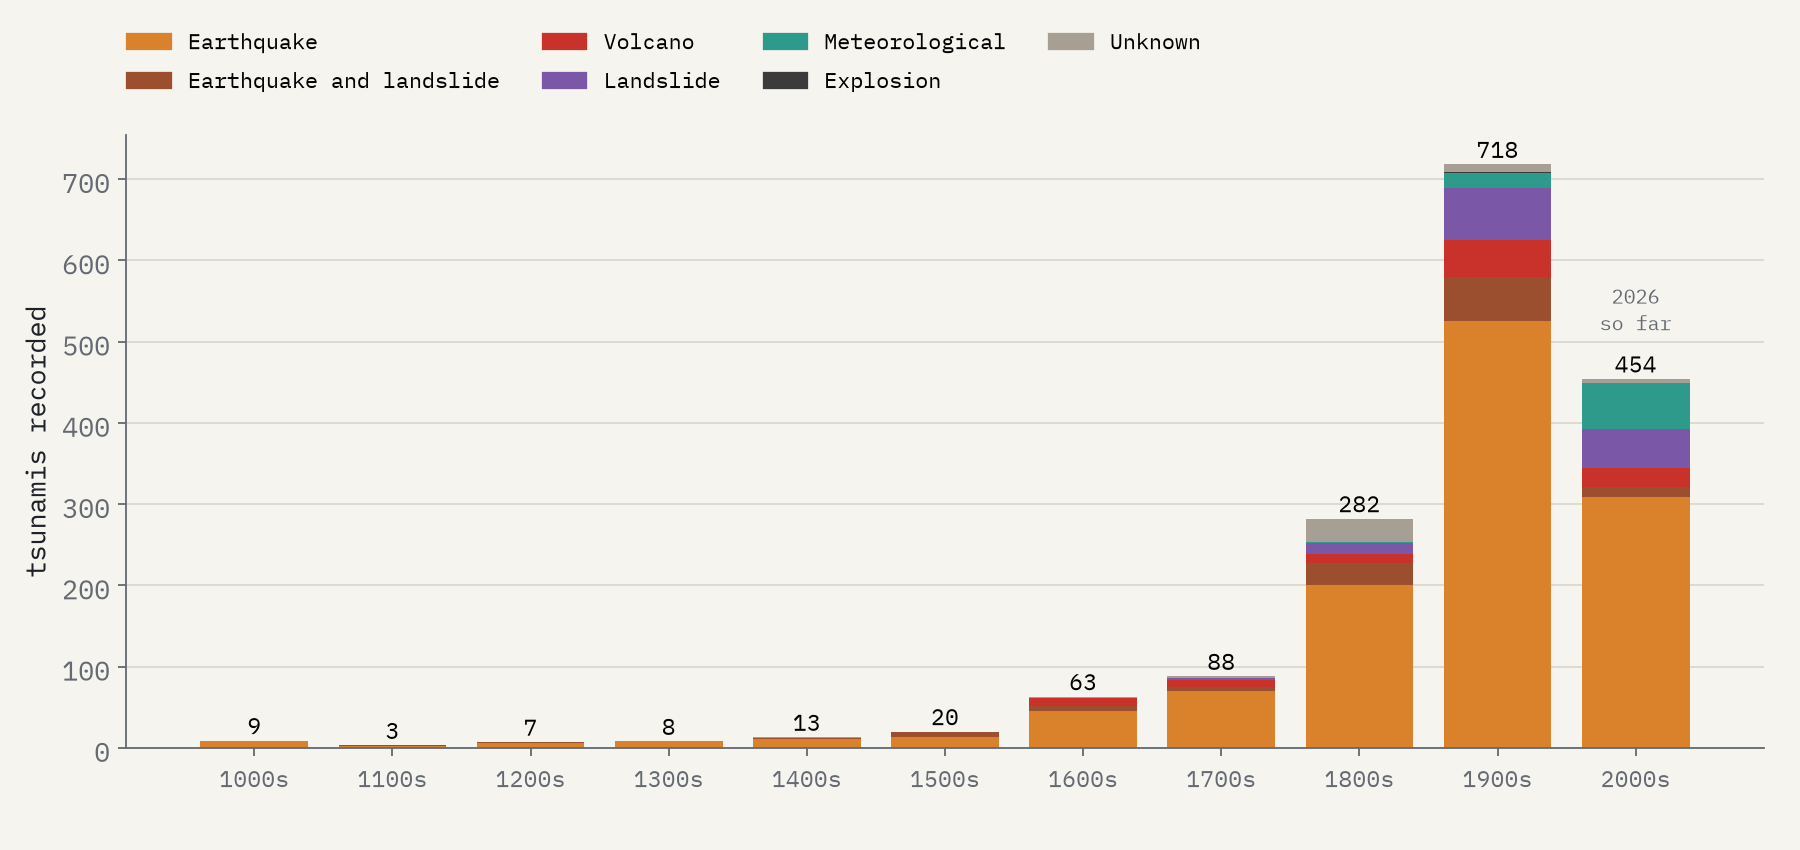
The pattern is unmistakable. 72% of tsunamis were started by an earthquake alone, and 79% involved one. They trace the edges of the tectonic plates: 63% of earthquake sources lie within 100 km of a plate boundary. 67% began on the rim of the Pacific, the Ring of Fire, and Japan alone accounts for 18%. The rest are a gallery of oddities: 131 landslides, 103 volcanic events, 76 meteotsunamis pushed by storms, and two explosions, including the Halifax munitions ship of 1917.
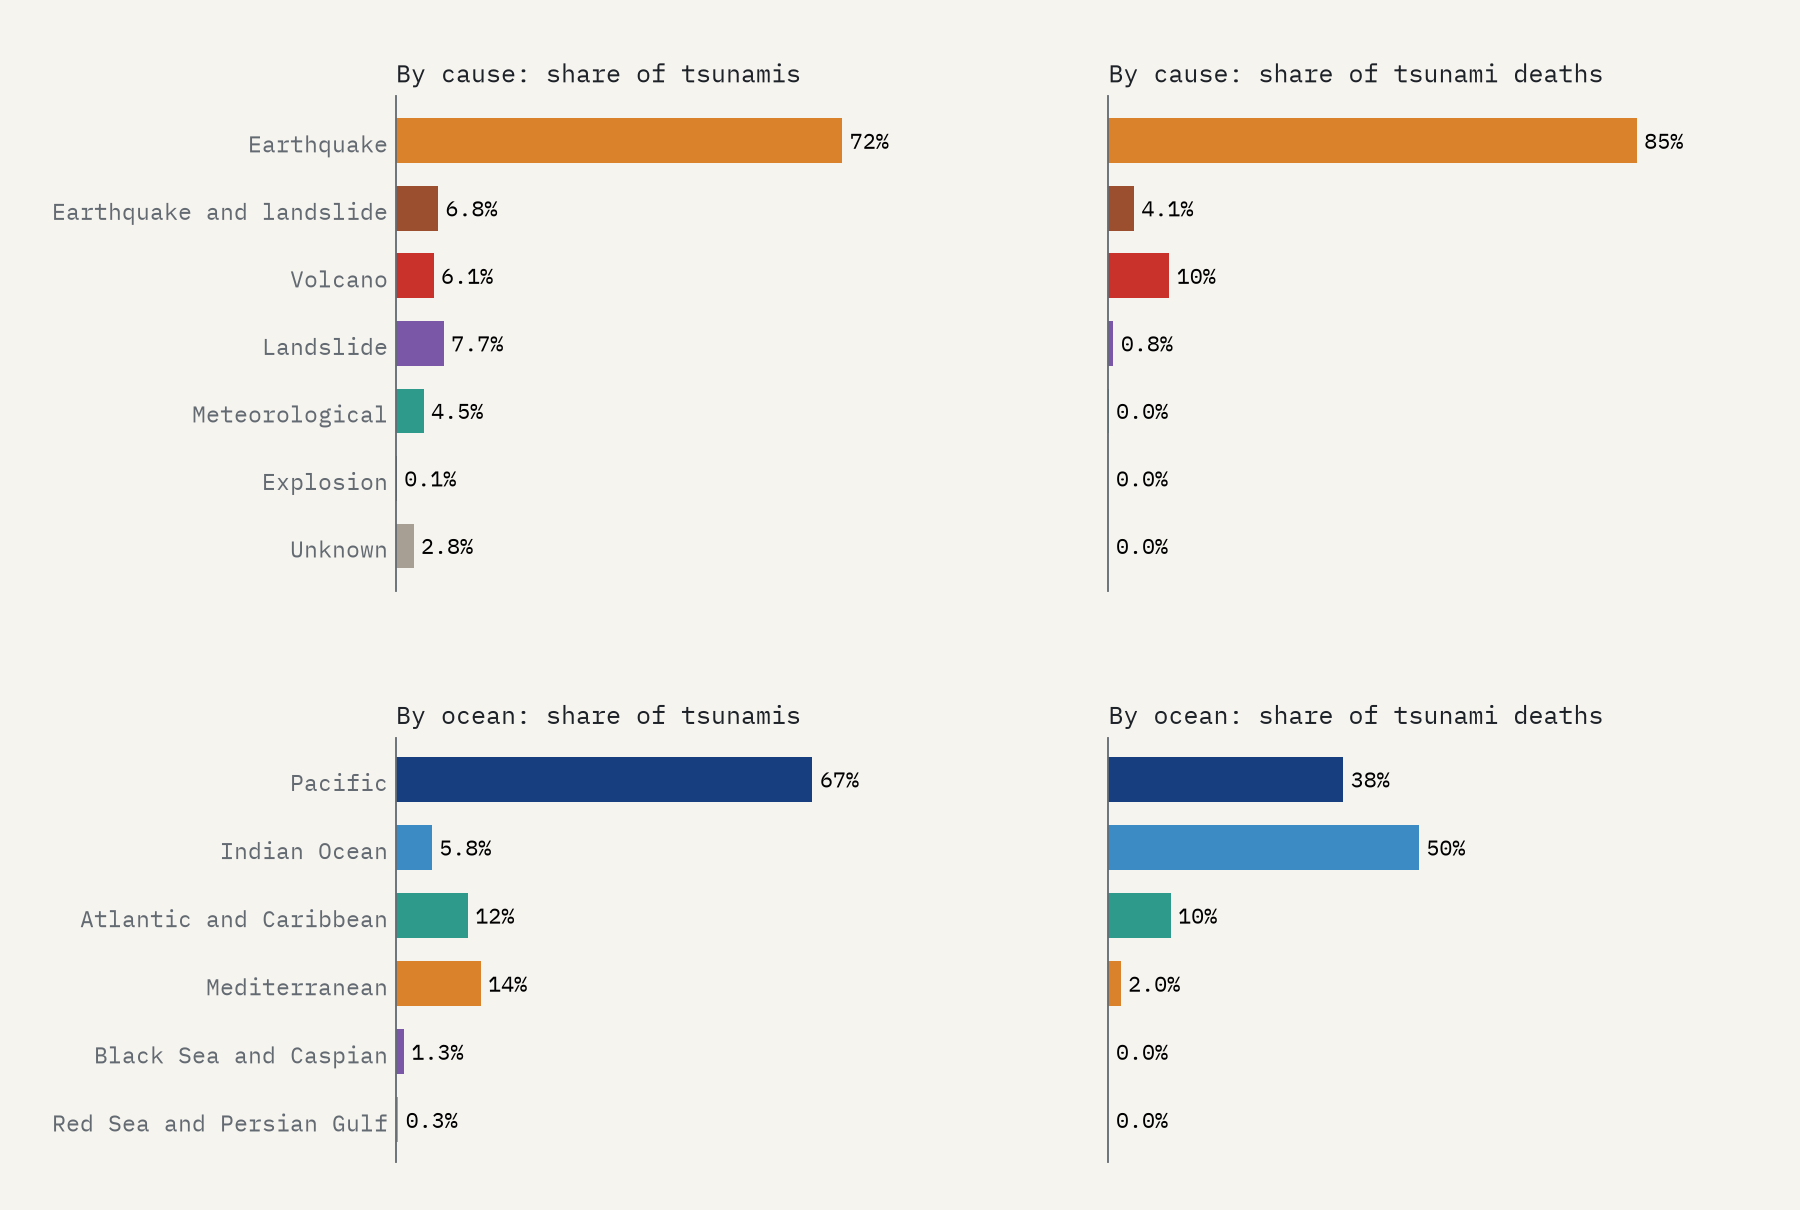
Deaths follow a different map. The Indian Ocean has only 5.8% of the tsunamis but 50% of the recorded deaths, almost all from a single morning.
The dead
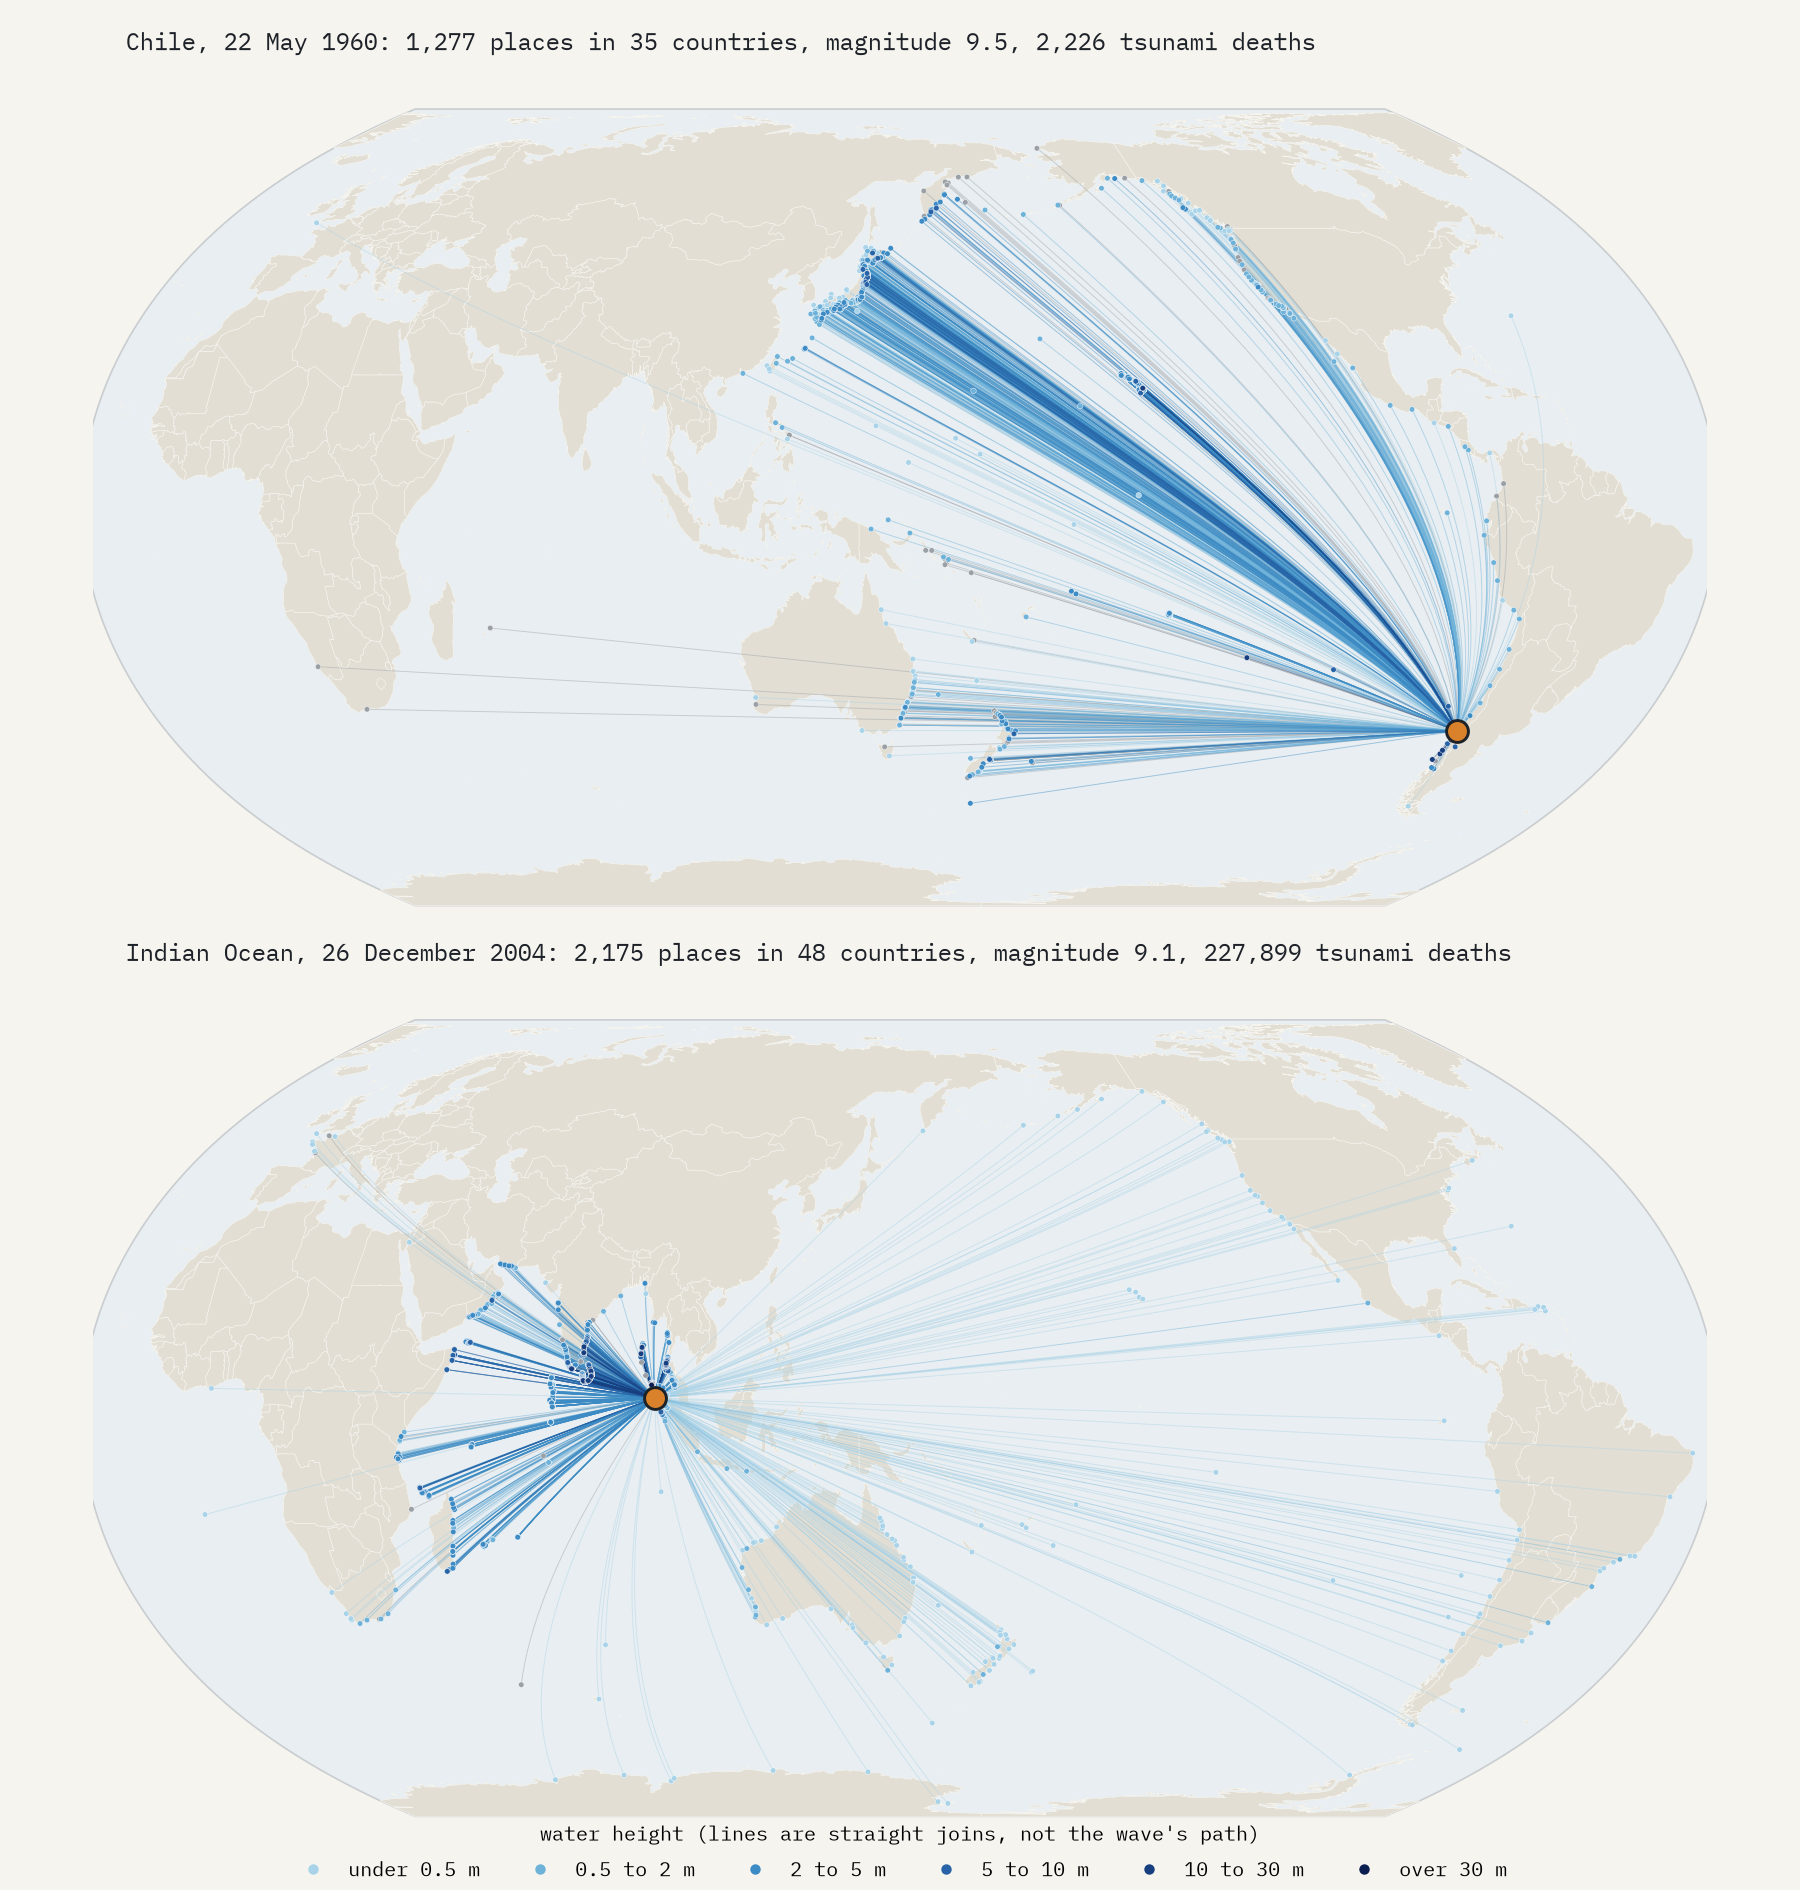
NCEI records a death toll for 244 tsunamis, adding up to 545,939 people, and that is a floor: for most old events nobody counted. The Indian Ocean tsunami of 26 December 2004 killed 227,899, 42% of every tsunami death in the database. Then come Lisbon in 1755 (50,000), Krakatau in 1883 (34,417), the Meiji Sanriku tsunami in Japan in 1896 (27,122), northern Chile in 1868 (25,000) and Tohoku in 2011 (18,423).
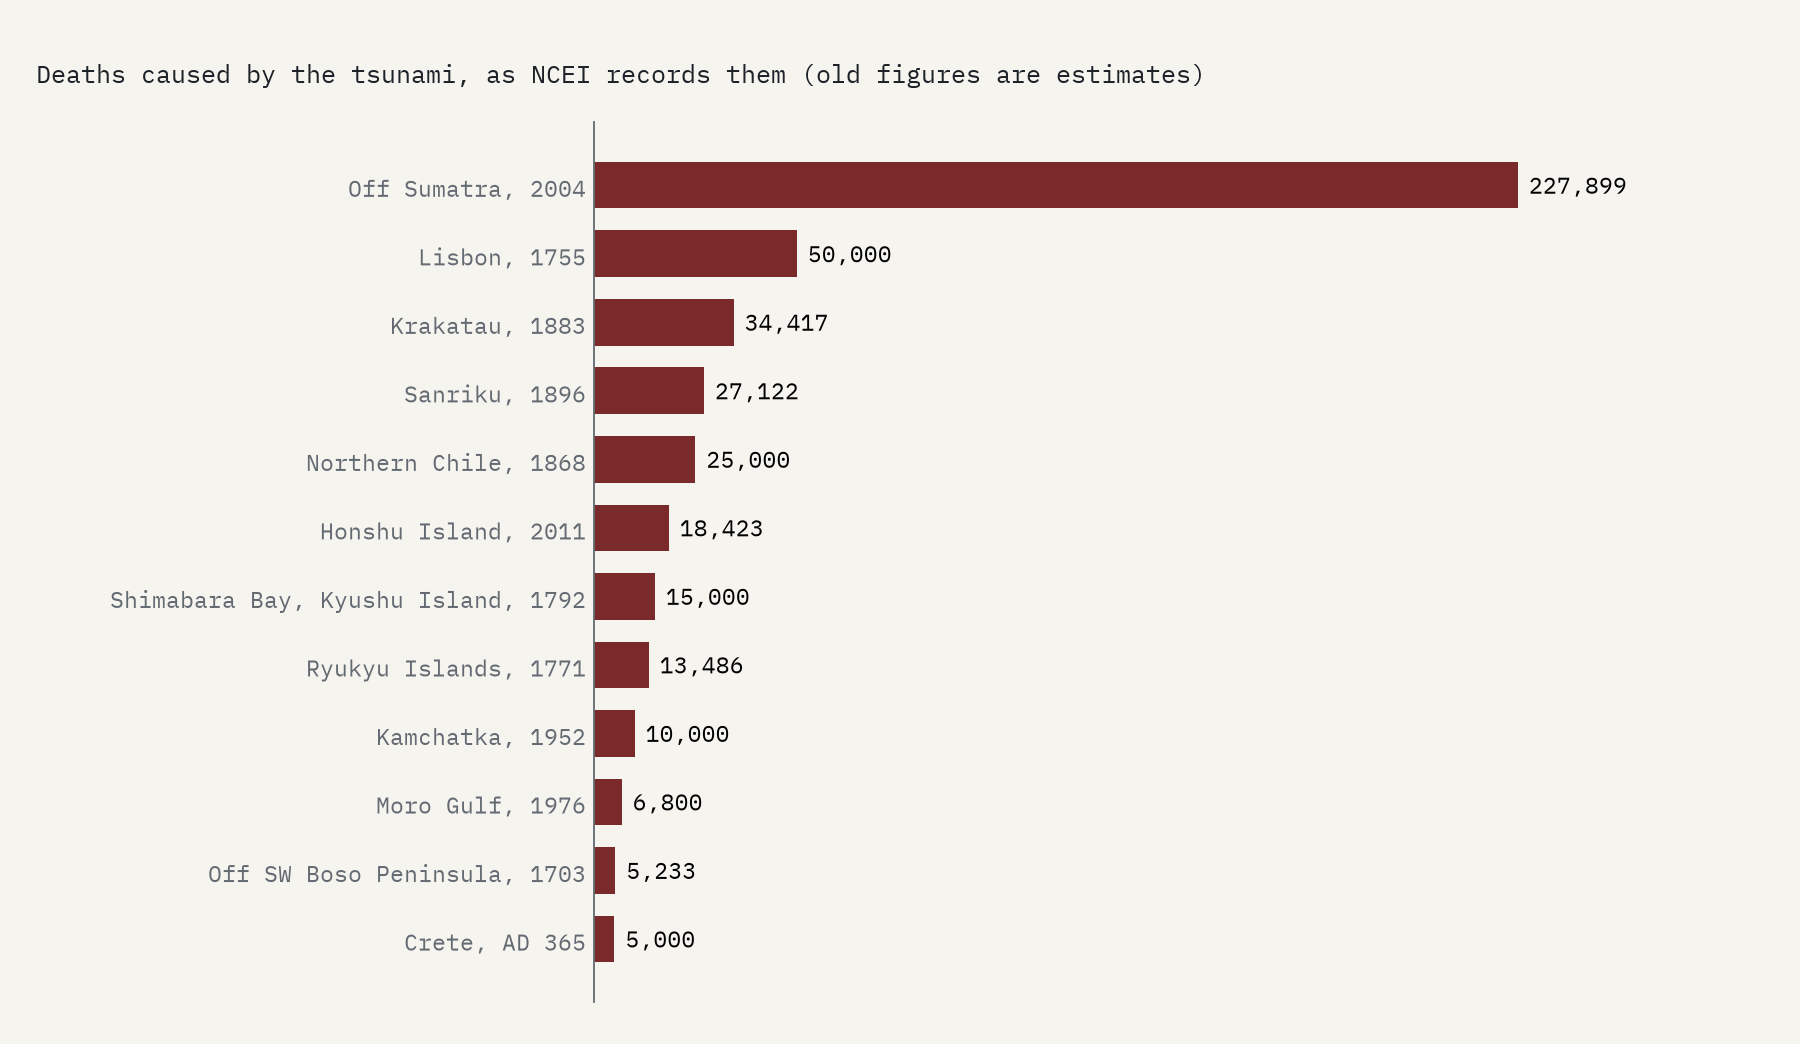
One trap in the data is worth knowing about. NCEI also gives a total for the whole event, and by that measure its deadliest entry is Haiti in 2010, with 316,000 deaths. The tsunami after that earthquake killed 7. I use the tsunami’s own toll throughout.
524 metres up a mountain
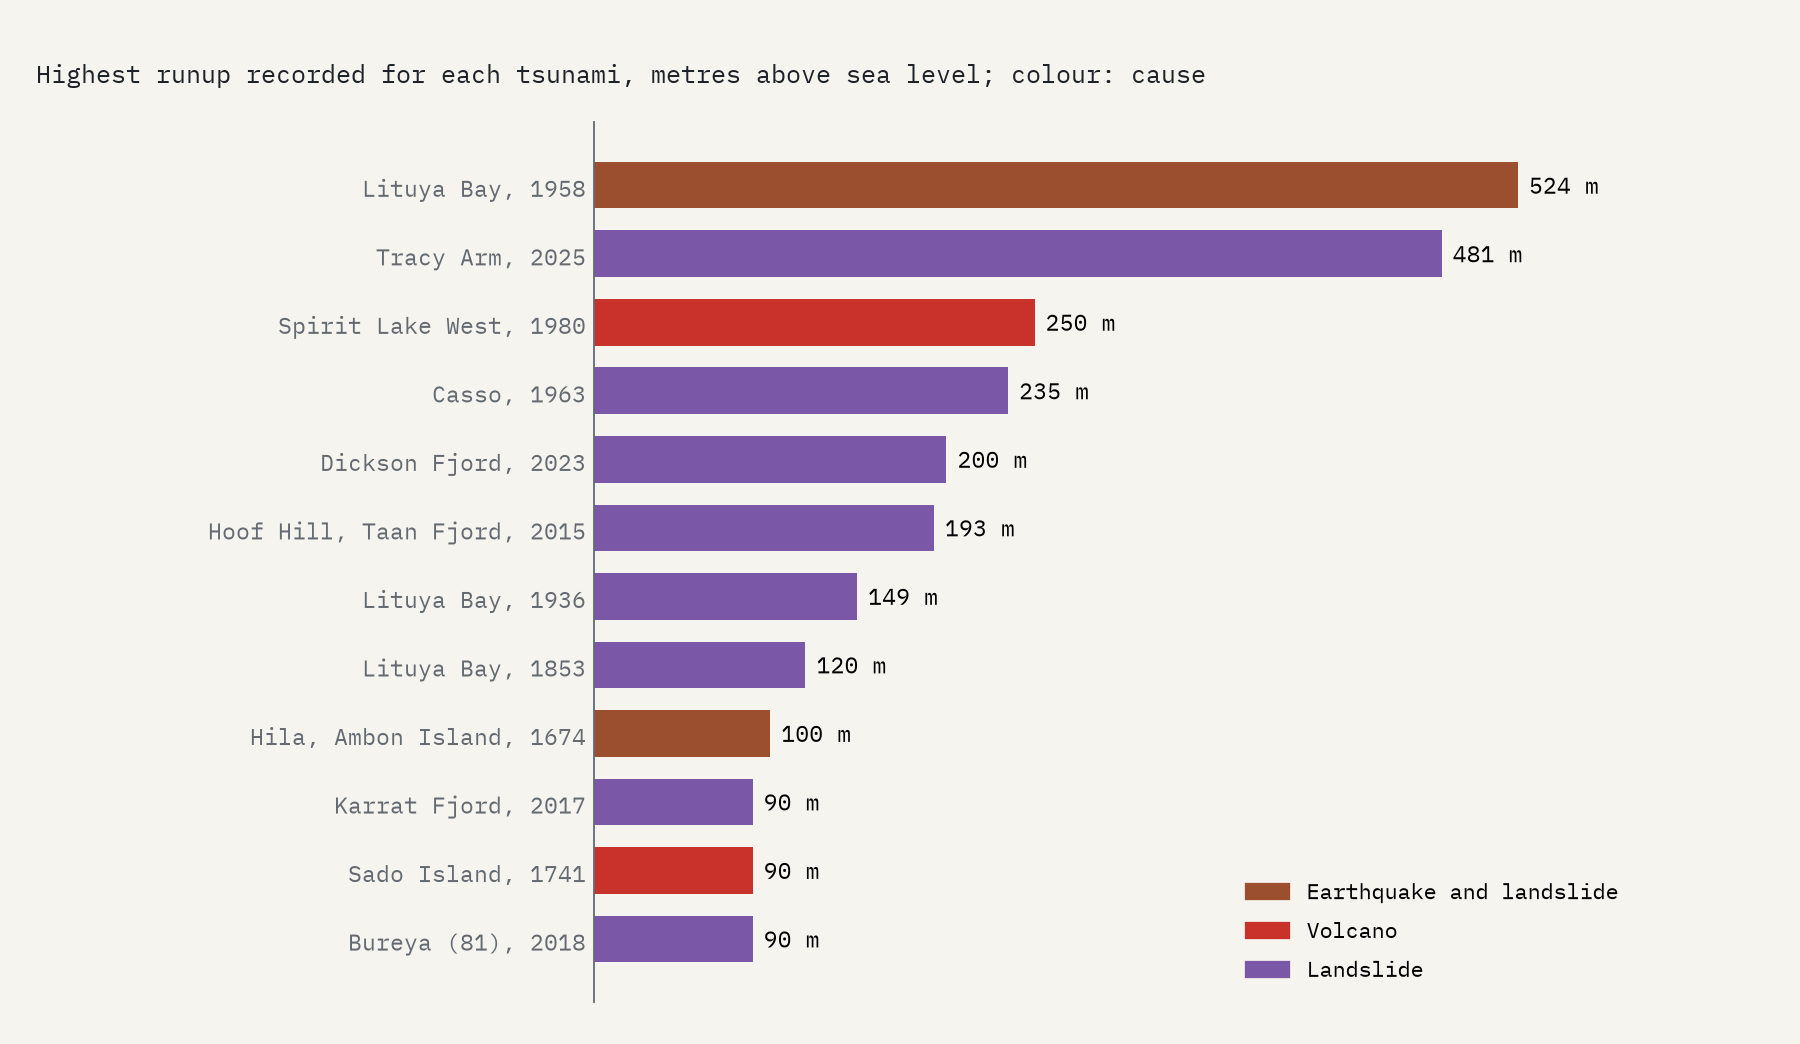
The highest water on record has nothing to do with the great ocean tsunamis. In July 1958 an earthquake knocked a mass of rock into Lituya Bay in Alaska, and the water ran 524.3 m up the slope opposite, stripping it of forest. Every tsunami that ran 100 m or more involved a landslide or a volcano: Tracy Arm in Alaska in 2025 (481 m), Spirit Lake at Mount St Helens in 1980, the Vajont dam in Italy in 1963, Dickson Fjord in Greenland in 2023. For an earthquake alone, the record is 88 m.
Across oceans, at the speed of a jet
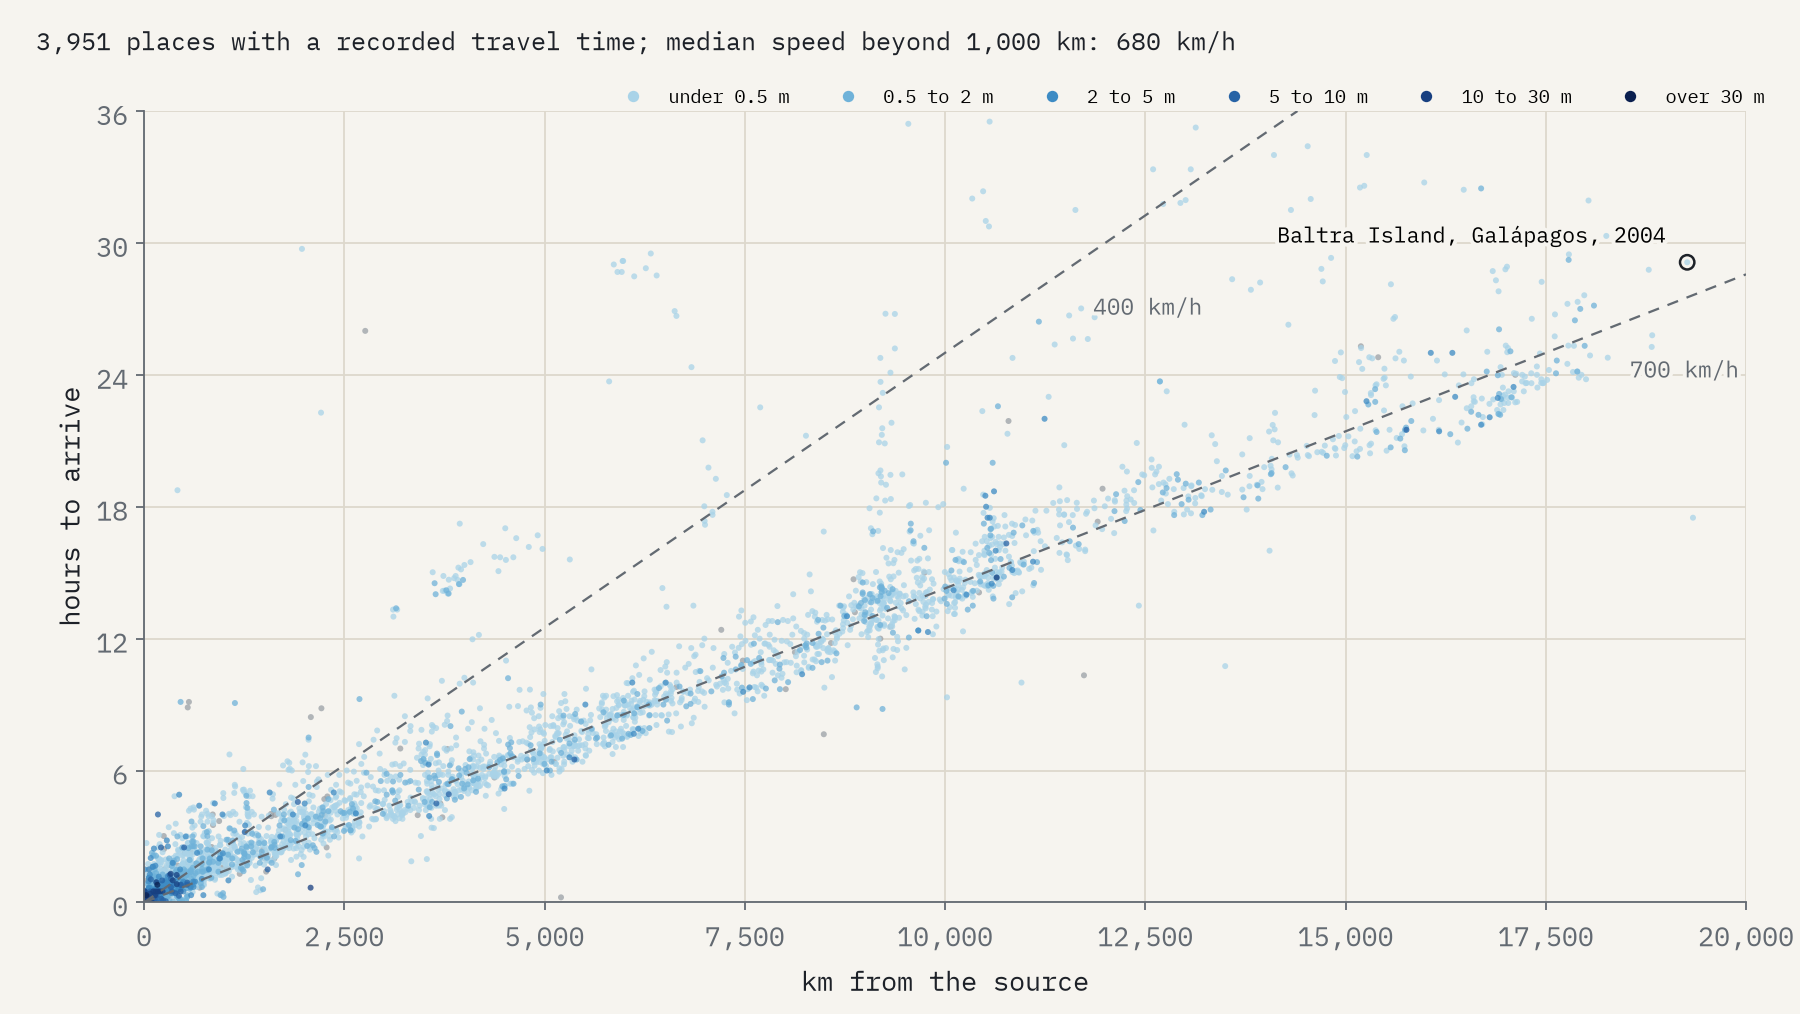
The great earthquake tsunamis go the other way: not high, but far. Over deep ocean a tsunami moves at roughly the speed of an airliner, and the records show it. For places more than 1,000 km from the source, the median speed works out at 680 km an hour. The 1960 Chilean tsunami reached Hilo in Hawaii after 14.8 hours and Japan, on the far side of the Pacific, after 22.4. The 2004 tsunami reached Kenya after 8.9 hours and South Africa after 11.1, and was still measurable on a tide gauge at Baltra Island in the Galápagos, 19,266 km away, 29 hours after the earthquake.
More tsunamis, or more people watching?
The record grows steeply with time: 63 tsunamis in the 1600s, 282 in the 1800s, 718 in the 1900s. That is not a world getting more dangerous. It is writing, then newspapers, then tide gauges, seismometers and deep-ocean sensors, each catching smaller waves than the last. Meteotsunamis make the point: 9 recorded before 1950, 57 since 2000.
How I did this
Everything comes from the NCEI Global Historical Tsunami Database, fetched from NOAA’s Hazard Service in 2026. I kept the 1,699 events NCEI rates as definite or probable, grouped its cause codes, and used its regions for the oceans. Deaths are NCEI’s count of people killed by the tsunami, not the total for the earthquake. I dropped runup records flagged as doubtful, kept deep-ocean gauges off the map, and treated the water moved by the air waves of Krakatau and Hunga Tonga separately from sea waves. Plate boundaries are Peter Bird’s PB2002 model. The paper sets out every step and caveat.
Notes and sources
- National Geophysical Data Center / World Data Service: NCEI/WDS Global Historical Tsunami Database, NOAA National Centers for Environmental Information, doi:10.7289/V5PN93H7. Public domain.
- Bird, P. (2003) An updated digital model of plate boundaries, Geochemistry, Geophysics, Geosystems 4(3); GeoJSON by Hugo Ahlenius (ODC Attribution License).
- Natural Earth country outlines (public domain).
- I wrote the text, with drafting and editing assistance from Claude (Anthropic), which also helped prepare the analysis code. I reviewed and checked all text and results.

