
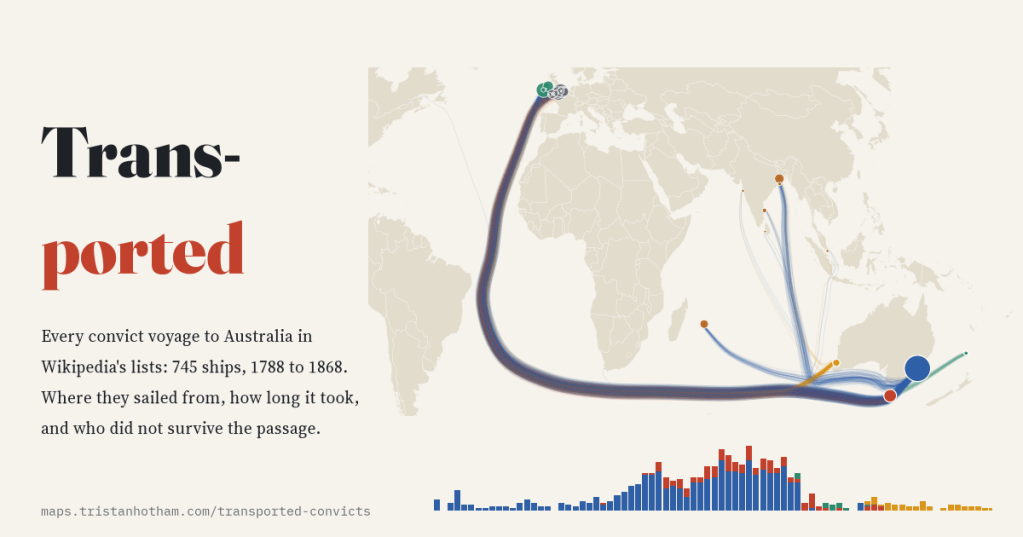
Between 1788 and 1868 Britain shipped about 162,000 convicts to the other side of the world. Wikipedia’s volunteers have listed their ships colony by colony. I mapped all 745 voyages, and then followed the trail on to French Guiana, Sakhalin and the Andaman Islands.
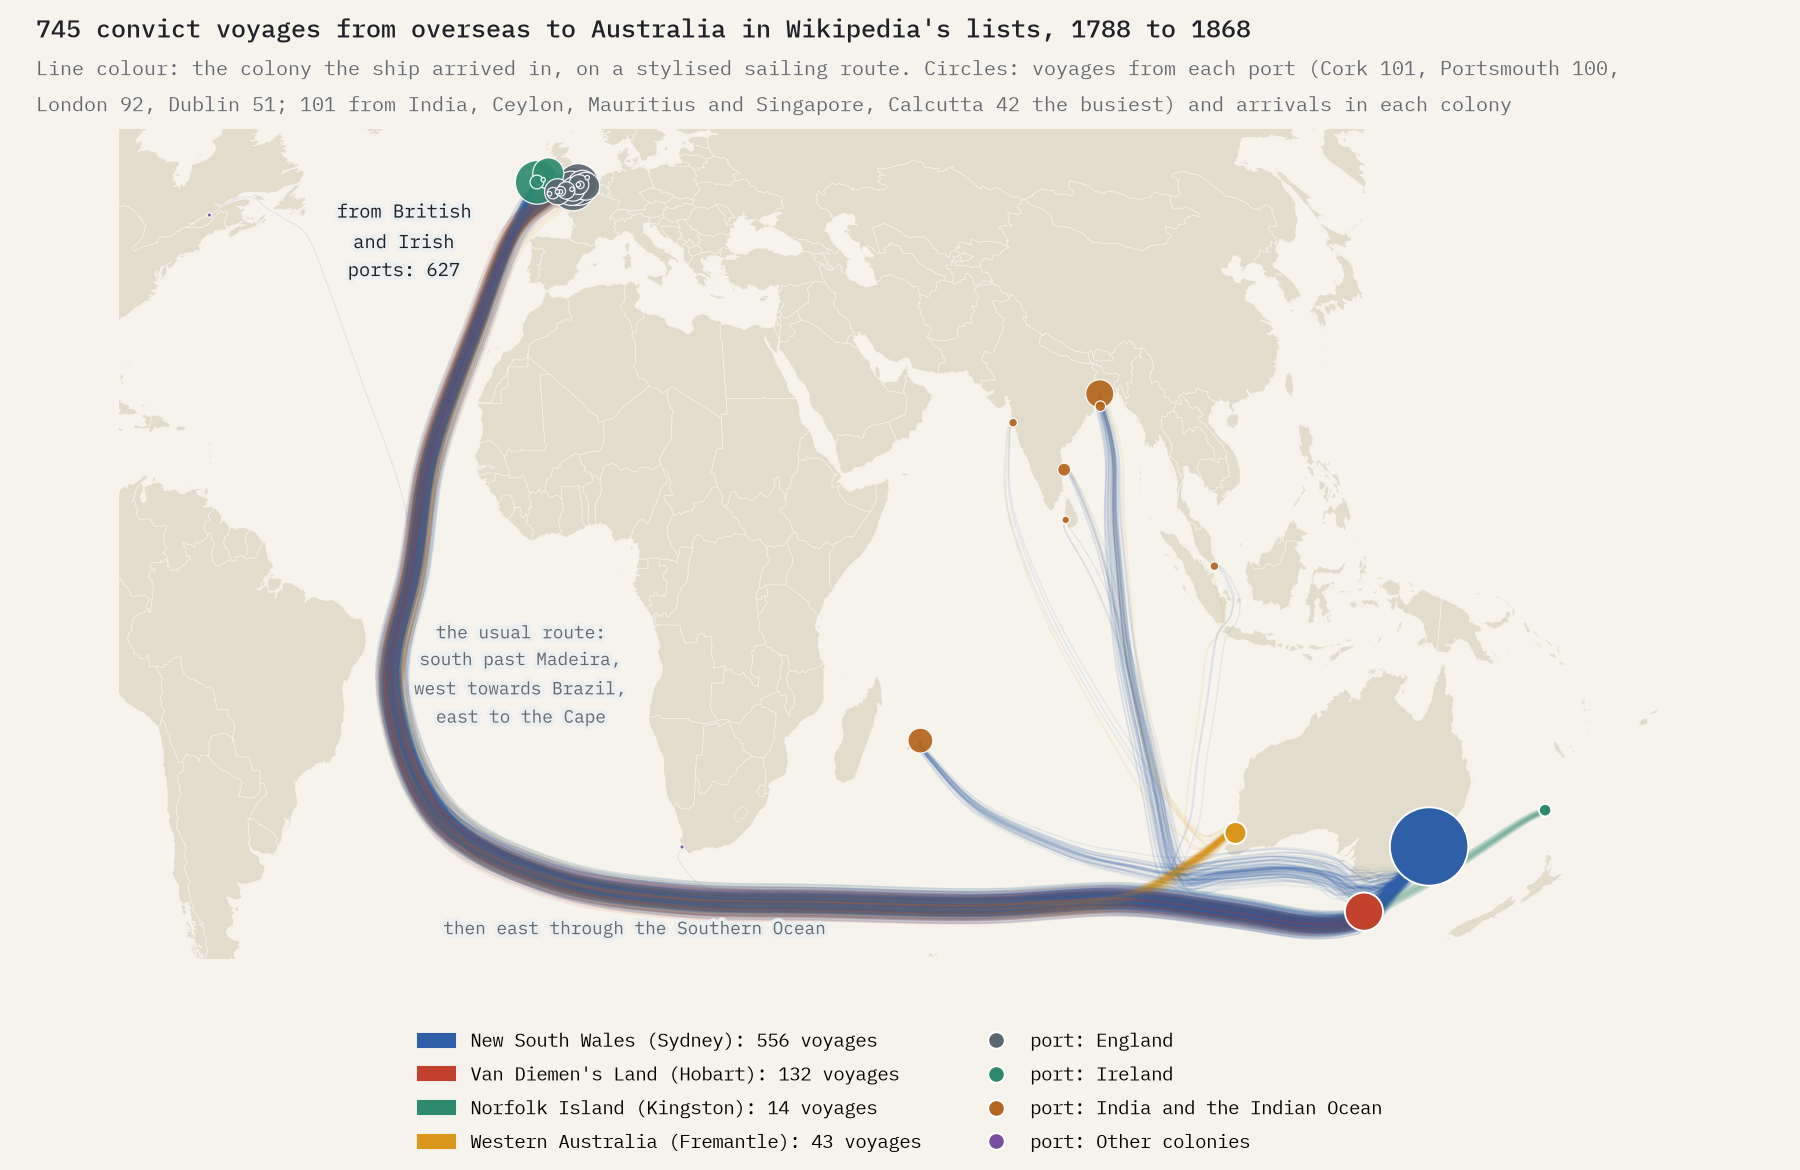
On 13 May 1787 eleven ships left Portsmouth carrying more than 1,400 people, over half of them convicts. They reached Botany Bay 252 days later, in January 1788, and moved on to Sydney Cove, where they met the Eora people. That was the start of eighty years in which Britain used the Australian colonies as its prison. Men, women and children sentenced to “transportation beyond the seas” were put on hired merchant ships and sent to New South Wales, Van Diemen’s Land (now Tasmania), Norfolk Island and, last of all, Western Australia.
English Wikipedia has a list of the convict ships for each of those colonies. They are patchy, and for most voyages they give only a ship’s name, the port it left and the date it arrived, but between them they hold 834 rows. Leave out the transfers between Australian ports, a few voyages listed twice and the ships that carried boys from Parkhurst prison, and 745 voyages from overseas remain. Wikipedia’s article on convicts in Australia says “about 164,000 convicts were transported to the Australian colonies between 1788 and 1868 onboard 806 ships”, so the lists hold 92% of the ships.
The flood after Waterloo
The first years were slow: 30 voyages in the 1790s and 32 in the 1800s, while Britain was fighting France. Then the war ended, and the ships came. Between 1815 and 1840 the lists hold 567 arrivals, 76% of the whole. The busiest year was 1833, with 35, and the 1830s saw 264, more than one a fortnight.
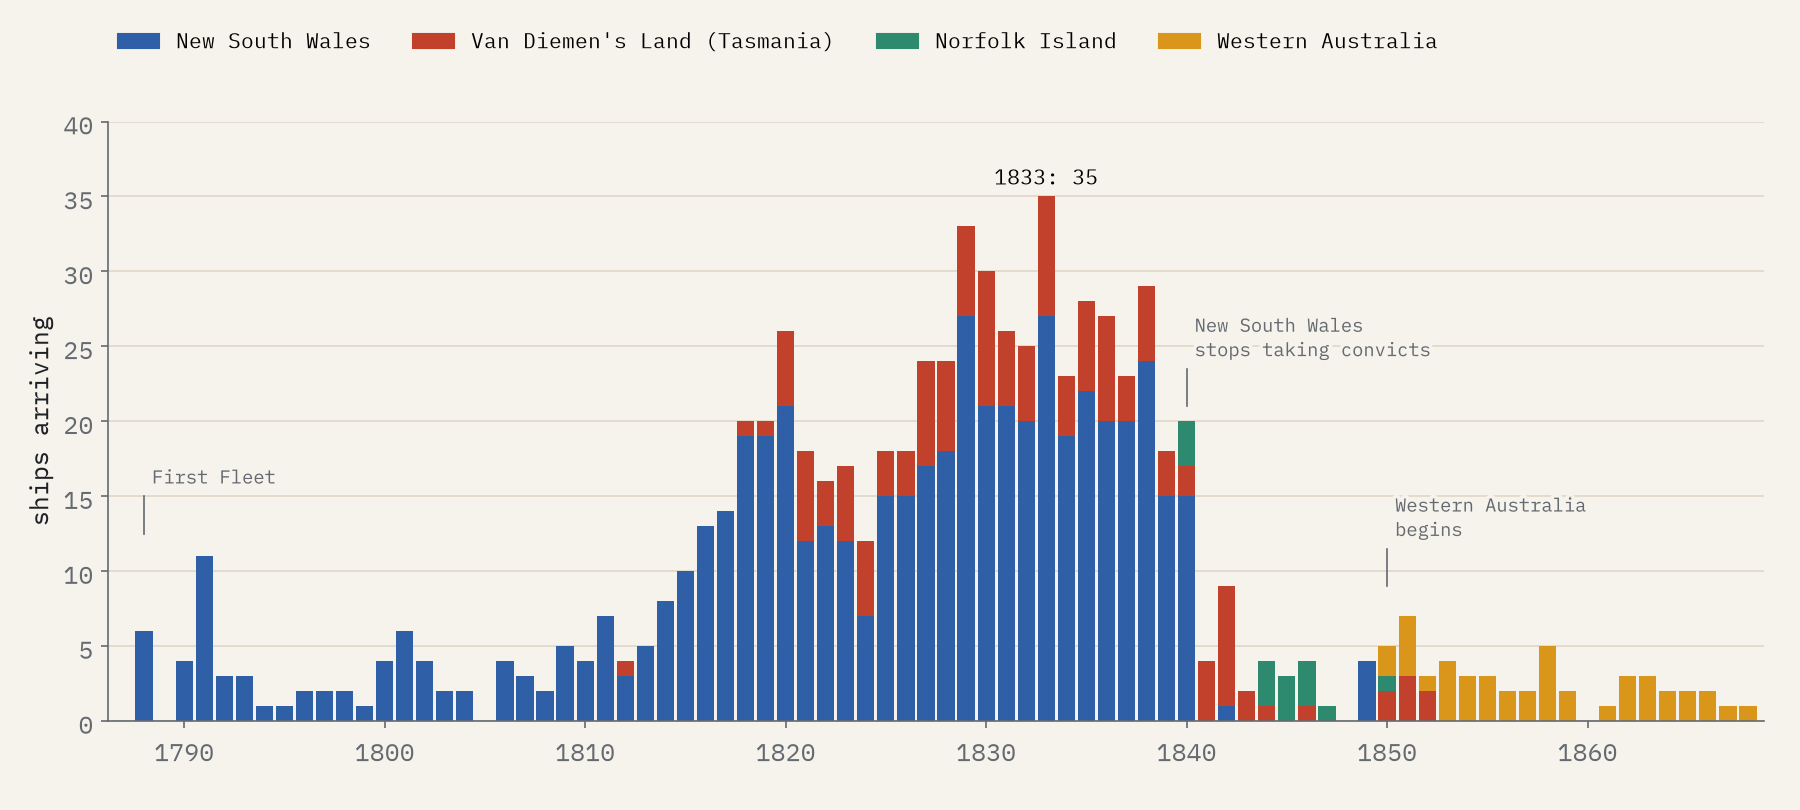
Then the traffic moved. New South Wales stopped taking convicts in 1840, and from 1841 to 1849 the lists hold 16 arrivals in Van Diemen’s Land, 10 at Norfolk Island and just 5 in Sydney. Transportation to Van Diemen’s Land ended in 1853. Western Australia, which asked for convicts to build its colony, took 43 shiploads between 1850 and 1868. The last of them, Hougoumont, reached Fremantle on 9 January 1868.
Cork, London and Portsmouth
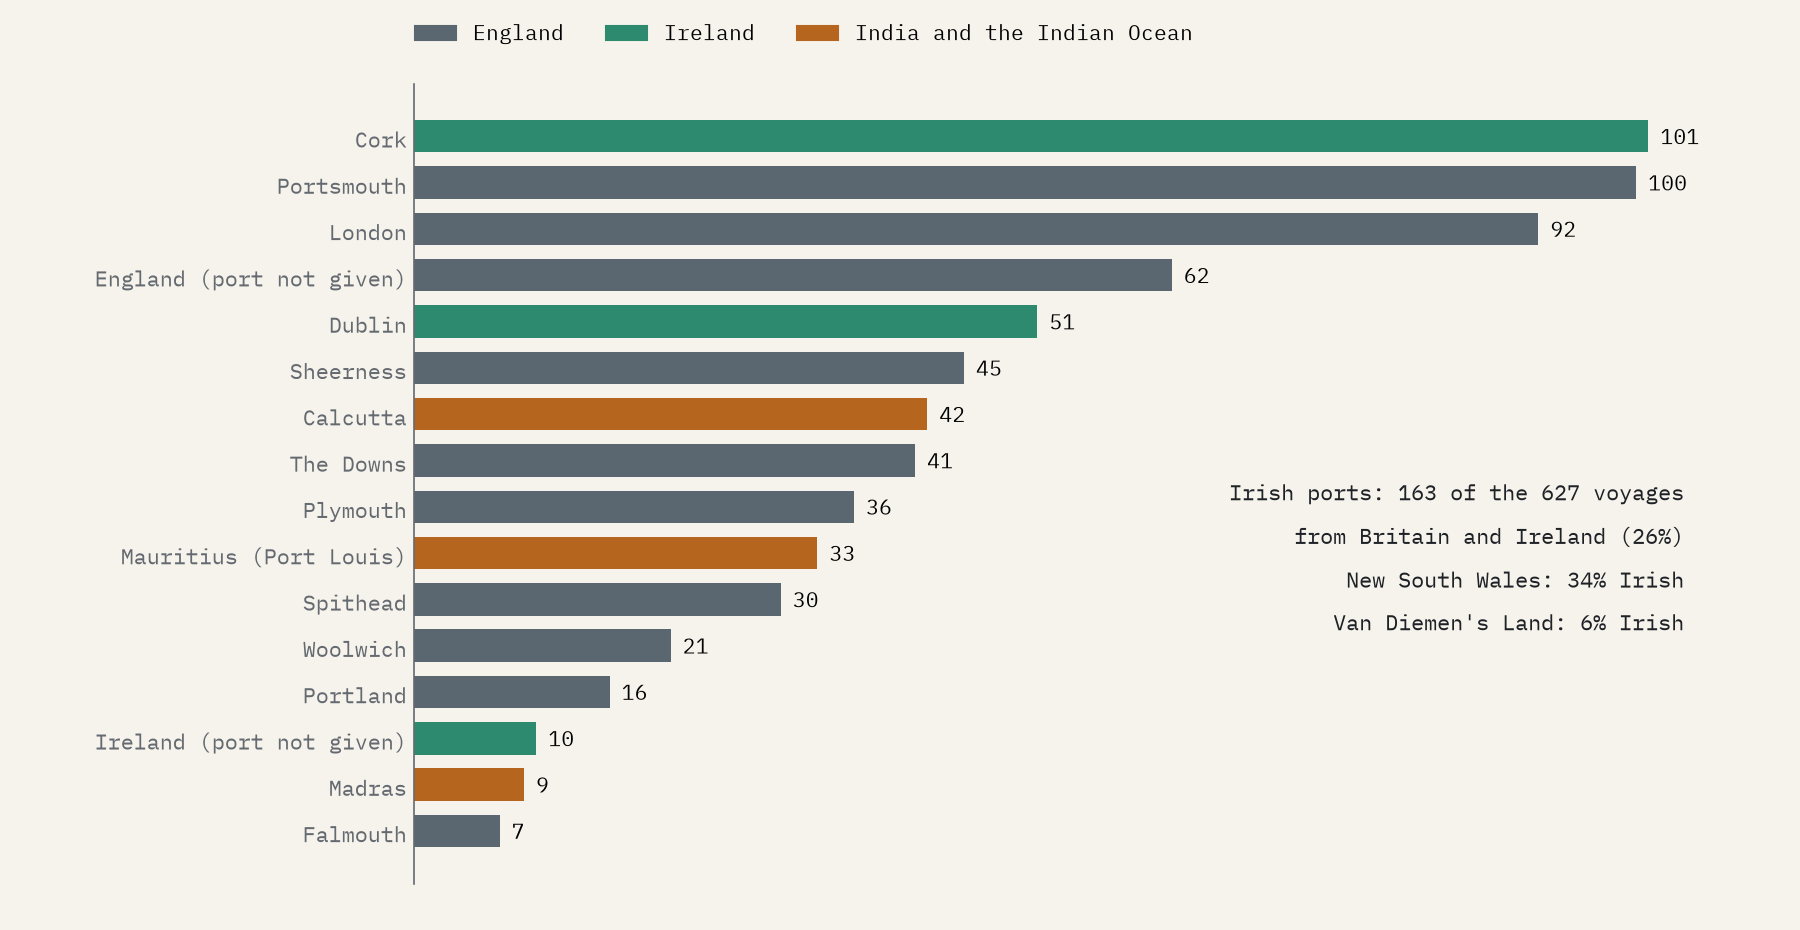
Most ships left from the Thames or the Solent. But the single busiest port in the lists is Cork, with 101 voyages, ahead of Portsmouth and London; Dublin had 51. Irish ports account for 163 of the 627 voyages from Britain and Ireland, 26%, and almost all of them went to Sydney: 34% of New South Wales’s ships from the British Isles were Irish. Another 101 voyages sailed from India, Ceylon, Mauritius or Singapore. Where the tables give numbers these carried only a handful of convicts each, some of them what the notes call “military convicts”.
From 252 days to 89
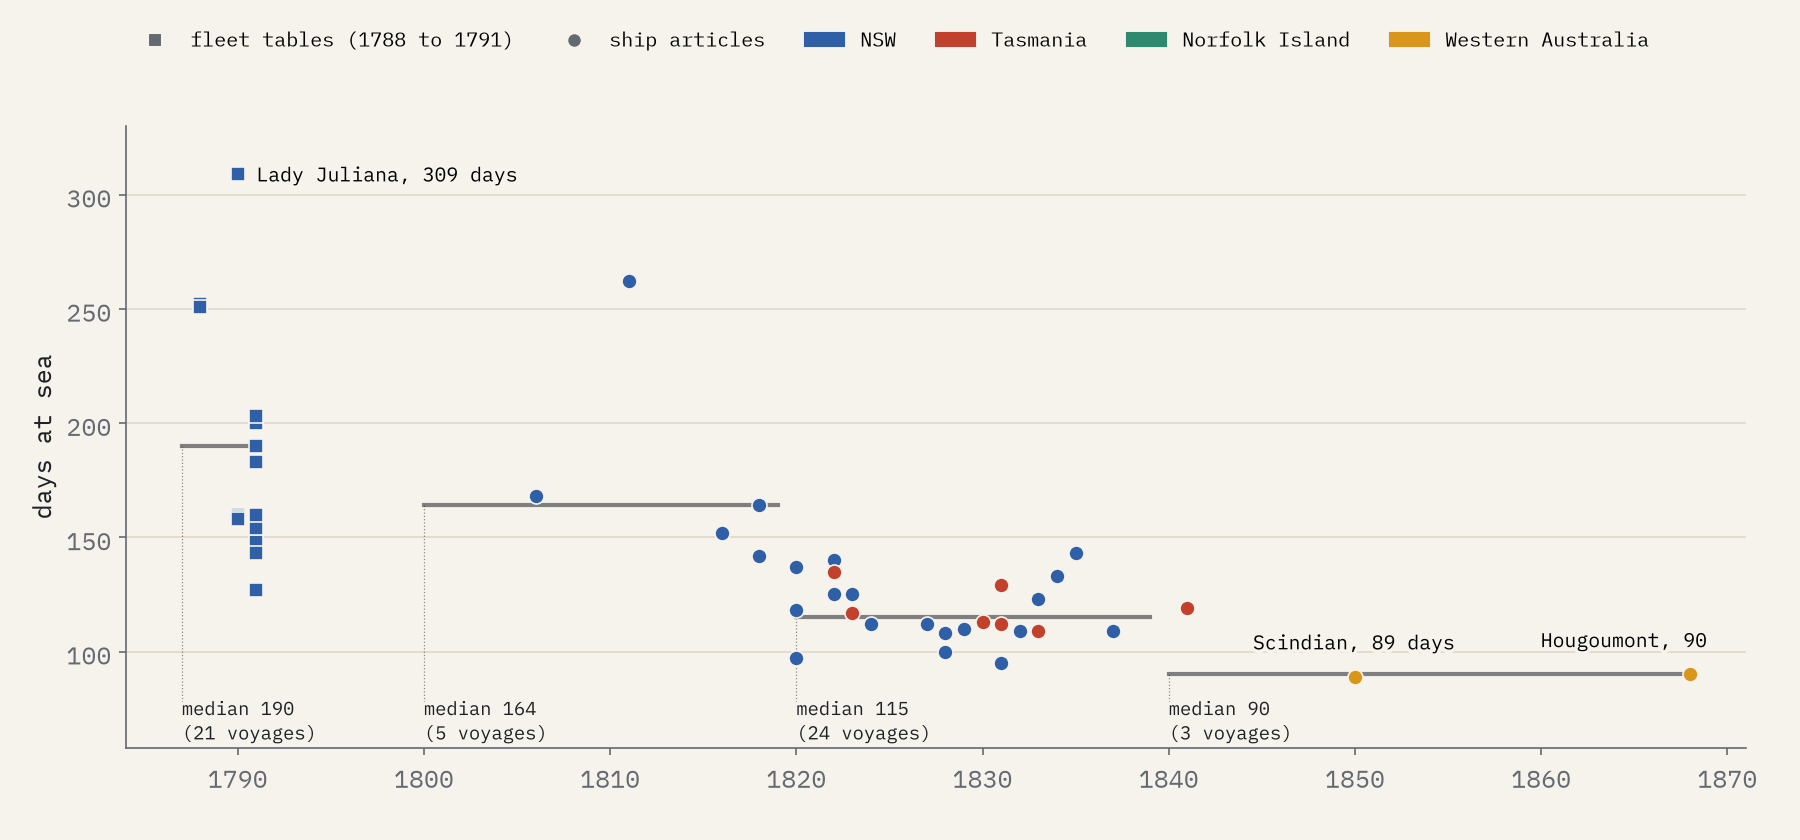
The lists don’t say when ships left, but the tables of the first three fleets and the articles on some individual ships do. For 53 voyages I have both dates. The first three fleets took a median of 190 days, and Lady Juliana, the Second Fleet’s women’s ship, took 309. By the 1820s and 1830s the median was 115 days. The fastest in the sample was Scindian, the first convict ship to Western Australia, in 89 days in 1850.
The Second Fleet
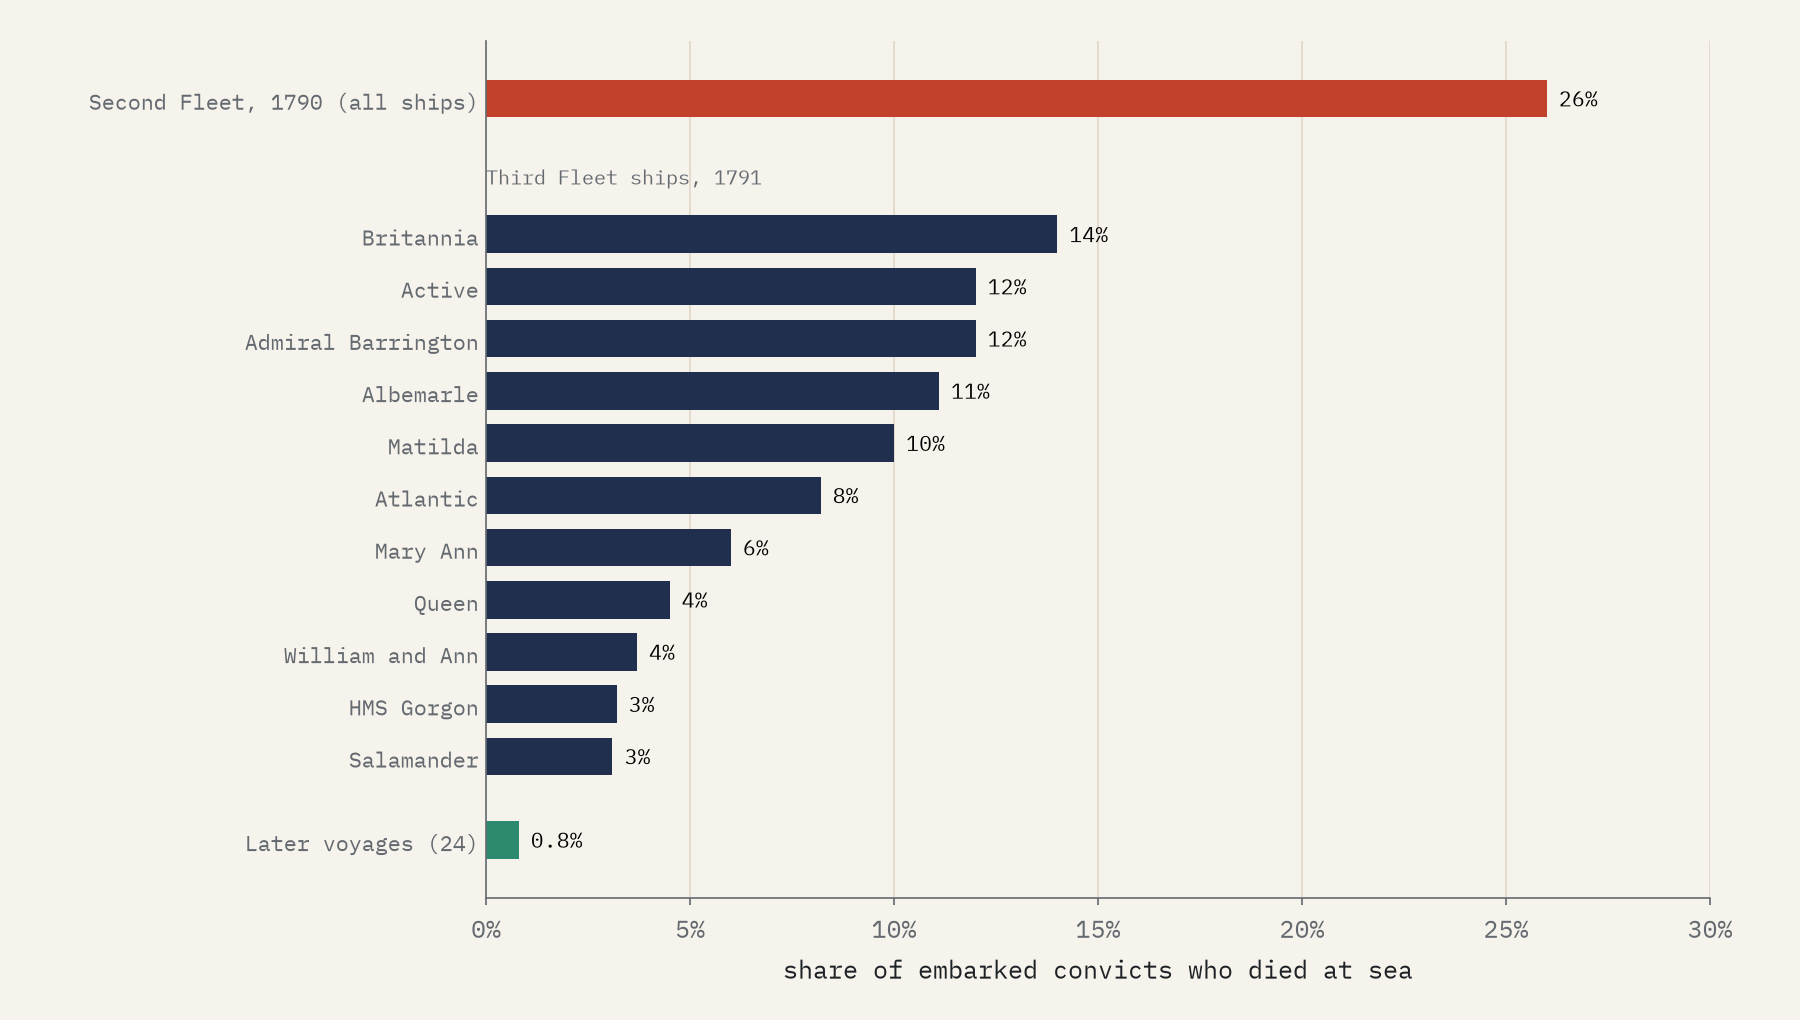
The worst voyages were among the first. The Second Fleet’s contractors were paid a flat fee for every convict they took on board, “whether they landed alive or not”. Of the 1,038 convicts embarked, 273 died during the voyage, 26%, and 486 landed sick. On the Third Fleet a year later, 182 of 2,067 died at sea, 8.8%. On the 24 later voyages whose ship articles give the numbers, 37 of 4,765 convicts died, 0.8%. Shipwreck remained a danger: when Amphitrite went down at the start of her voyage, 108 women convicts and 12 children drowned.
One in seven
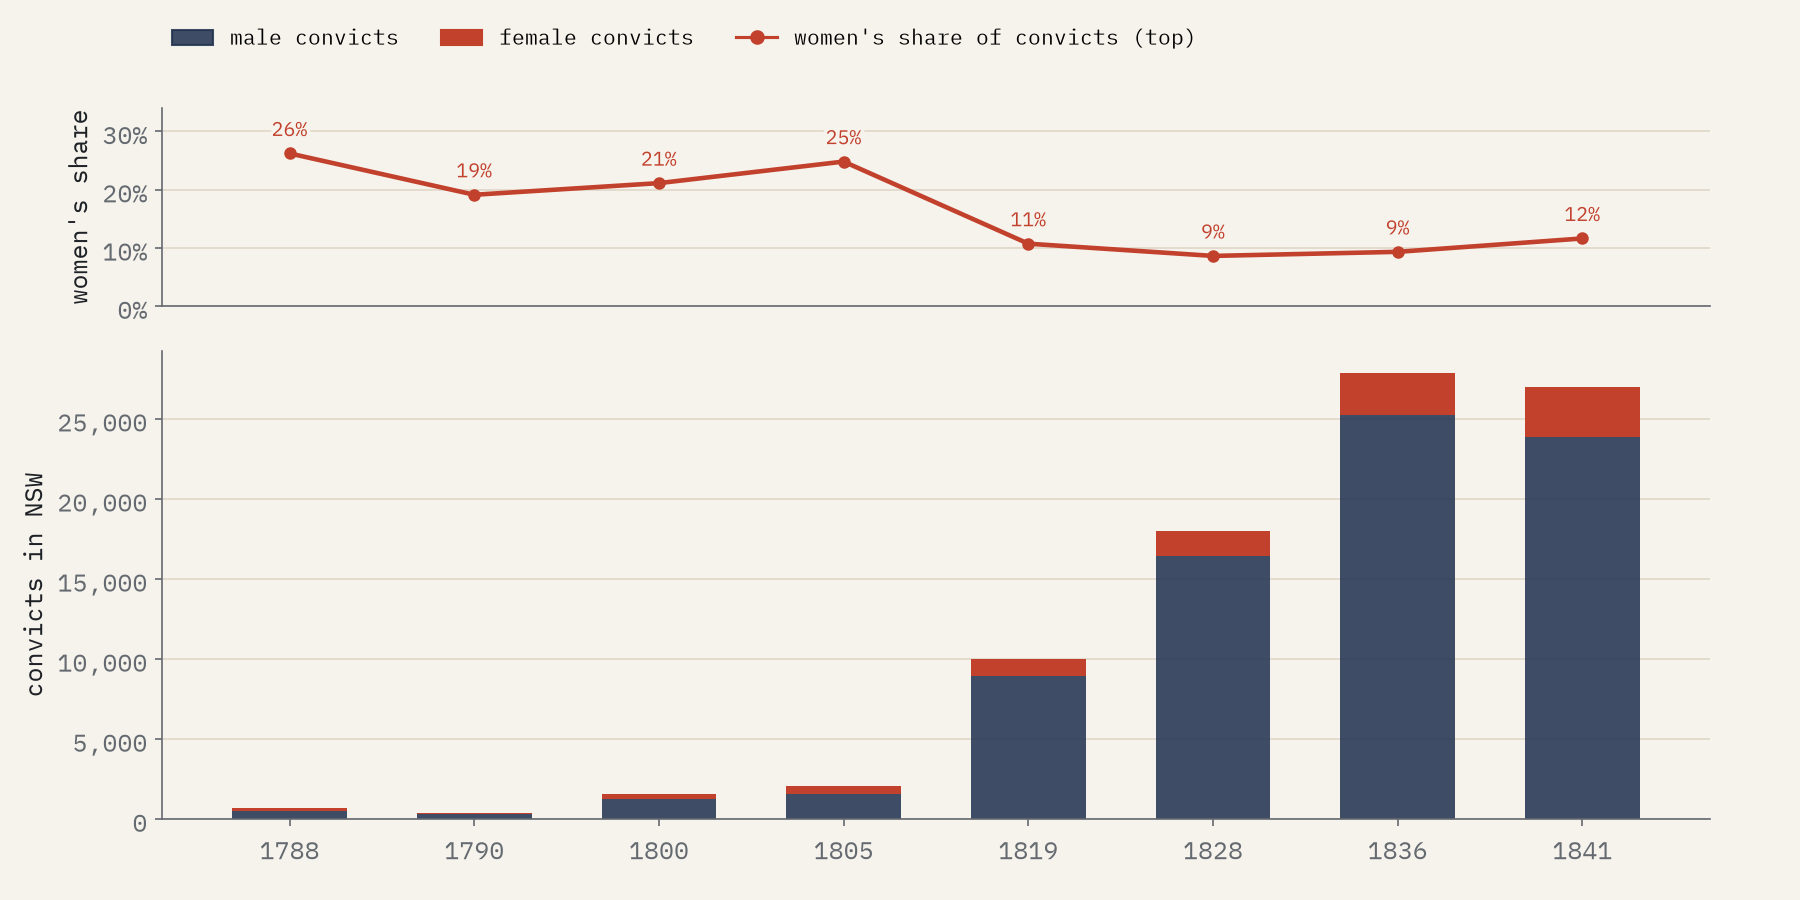
About 24,000 of the convicts, one in seven, were women, and some 80% of them had been convicted of theft, usually petty. The lists rarely say who a ship carried, so I can only identify 20 women’s voyages from them. A table in Wikipedia’s article on convict women shows how the balance changed in New South Wales: women were 26% of the convicts in 1788 and 12% in 1841. Western Australia took no women at all.
Somebody’s land
None of these ships landed on empty country. Wikipedia’s article on penal transportation puts it plainly: violent conflict on the Australian frontier between Indigenous Australians and the colonists “began only months after the First Fleet landed, lasting over a century”. Convicts were on both sides of it. Some were killed on the frontier, some took part in killings such as the Myall Creek massacre, and in the Hawkesbury and Nepean Wars a group of Irish convicts joined the Eora, Gandangara, Dharug and Tharawal nations fighting the colonists.
Not only Britain
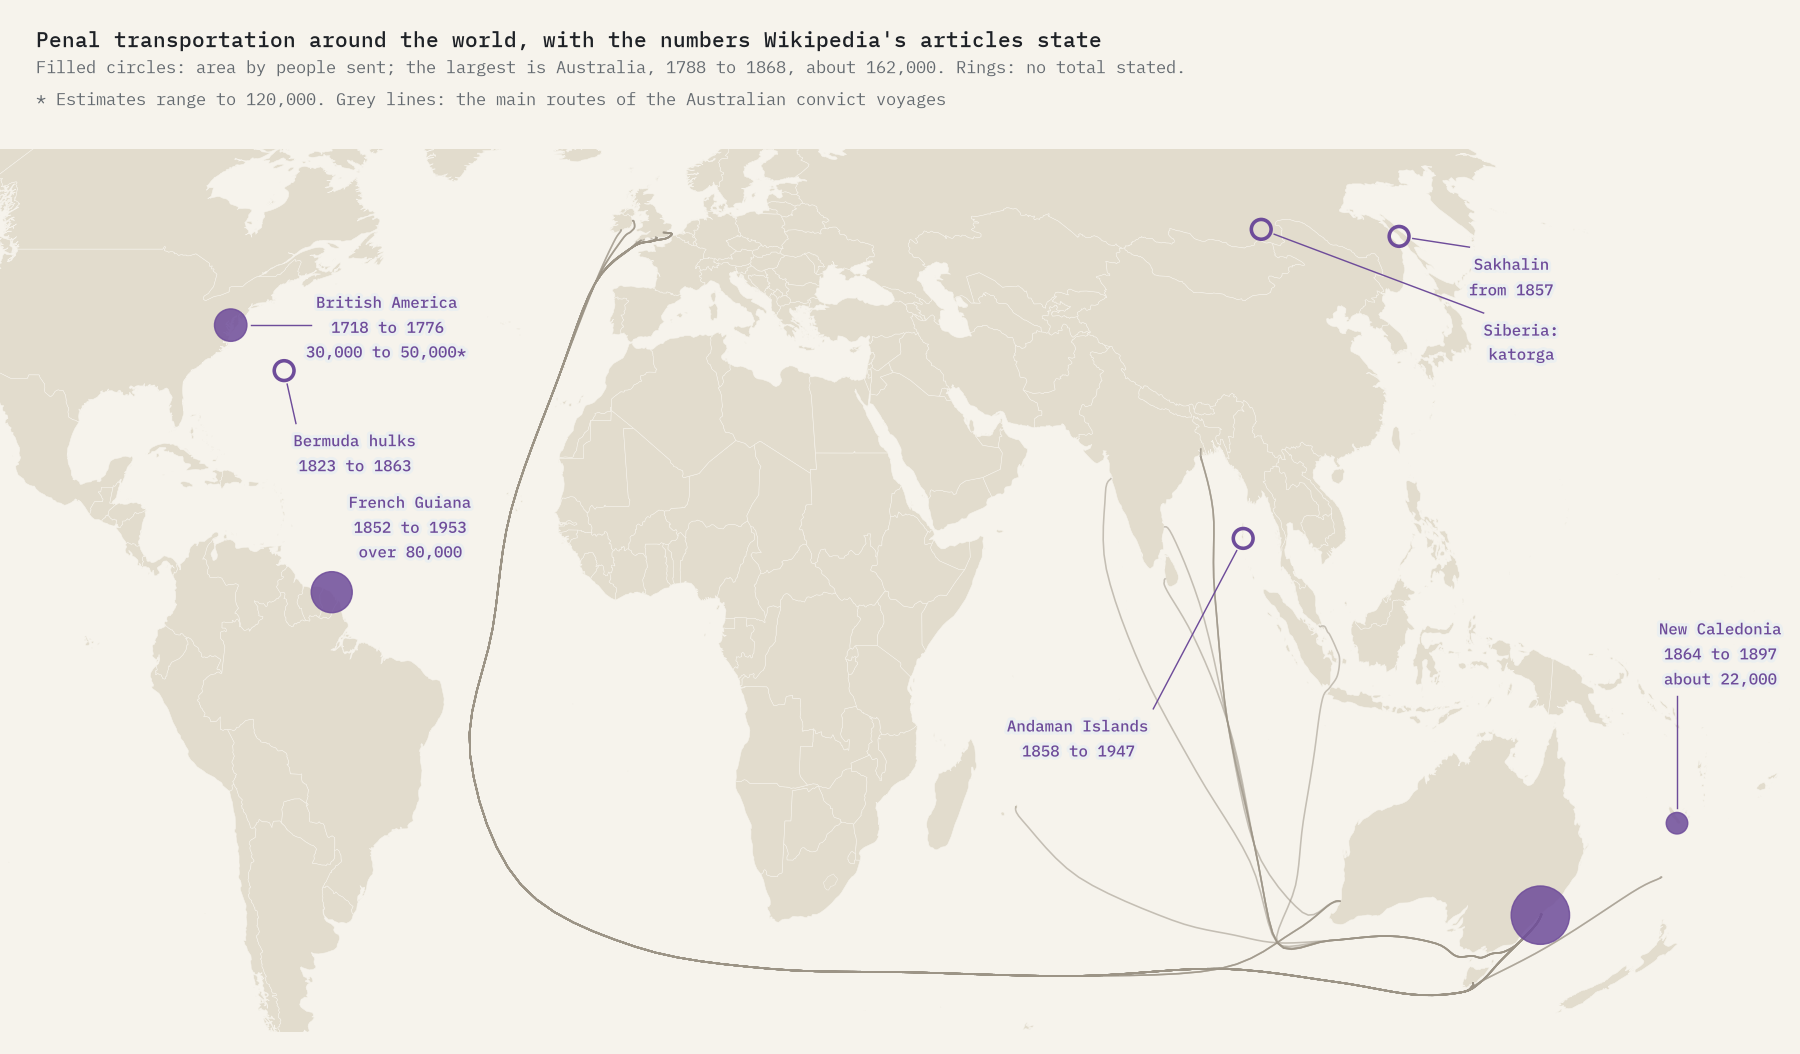
Australia was Britain’s second destination. Before the American Revolution, convicts went to Virginia and Maryland, “commonly accepted” to be 30,000 people, with estimates up to 120,000. France shipped more than 80,000 to the Devil’s Island system in French Guiana between 1852 and 1953, and about 22,000 to New Caledonia. Russia sent convicts to katorga in Siberia and set up a penal colony on Sakhalin in 1857. British India sent prisoners of the 1857 rebellion to the Andaman Islands, where the Cellular Jail later held independence activists; the penal settlement closed in 1947.
How I did this
Everything comes from English Wikipedia, saved in 2026 with revision numbers: the four colony lists of convict ships, the tables in the First, Second and Third Fleet articles, 305 convict ship articles, and the articles on convicts in Australia, penal transportation and the other penal colonies. I count a voyage from overseas once, by its year of arrival. Convict numbers, departure dates and deaths come from the Western Australia and Norfolk Island tables, the fleet tables and sentences in ship articles, kept only where the article’s arrival date matches the list. The lists give numbers of convicts for only 108 voyages, so I don’t add them up to a national total; Wikipedia’s own figure is about 162,000. The routes on the map are stylised sailing tracks, not logged ones. The paper sets out every decision.
Notes and sources
- English Wikipedia: Convict ships to New South Wales, Convict ships to Tasmania, Convict ships to Norfolk Island, List of convict ship voyages to Western Australia, First Fleet, Second Fleet, Third Fleet, Convicts in Australia, Convict women in Australia and Penal transportation, among others, revisions of 2026, CC BY-SA 4.0. The tables derived from them are shared under the same licence.
- Natural Earth land and country outlines (public domain).
- I wrote the text, with drafting and editing assistance from Claude (Anthropic), which also helped prepare the analysis code. I reviewed and checked all text and results.

