
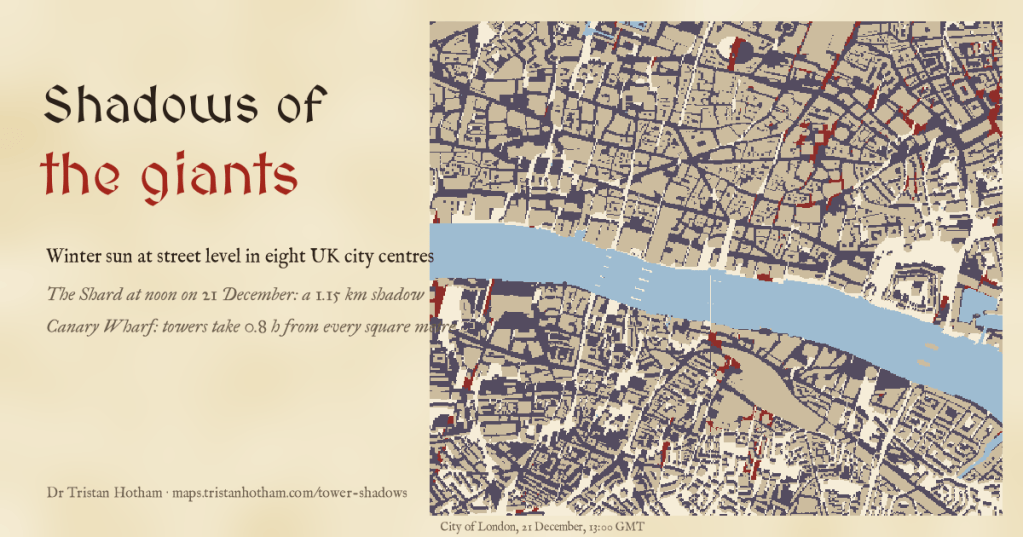
On the shortest day the sun at noon is only 15.1 degrees up in London, and every building casts a shadow nearly four times its height. I traced the winter sun through eight UK city centres to see which streets and squares lose it, and how much of the loss is down to the towers.
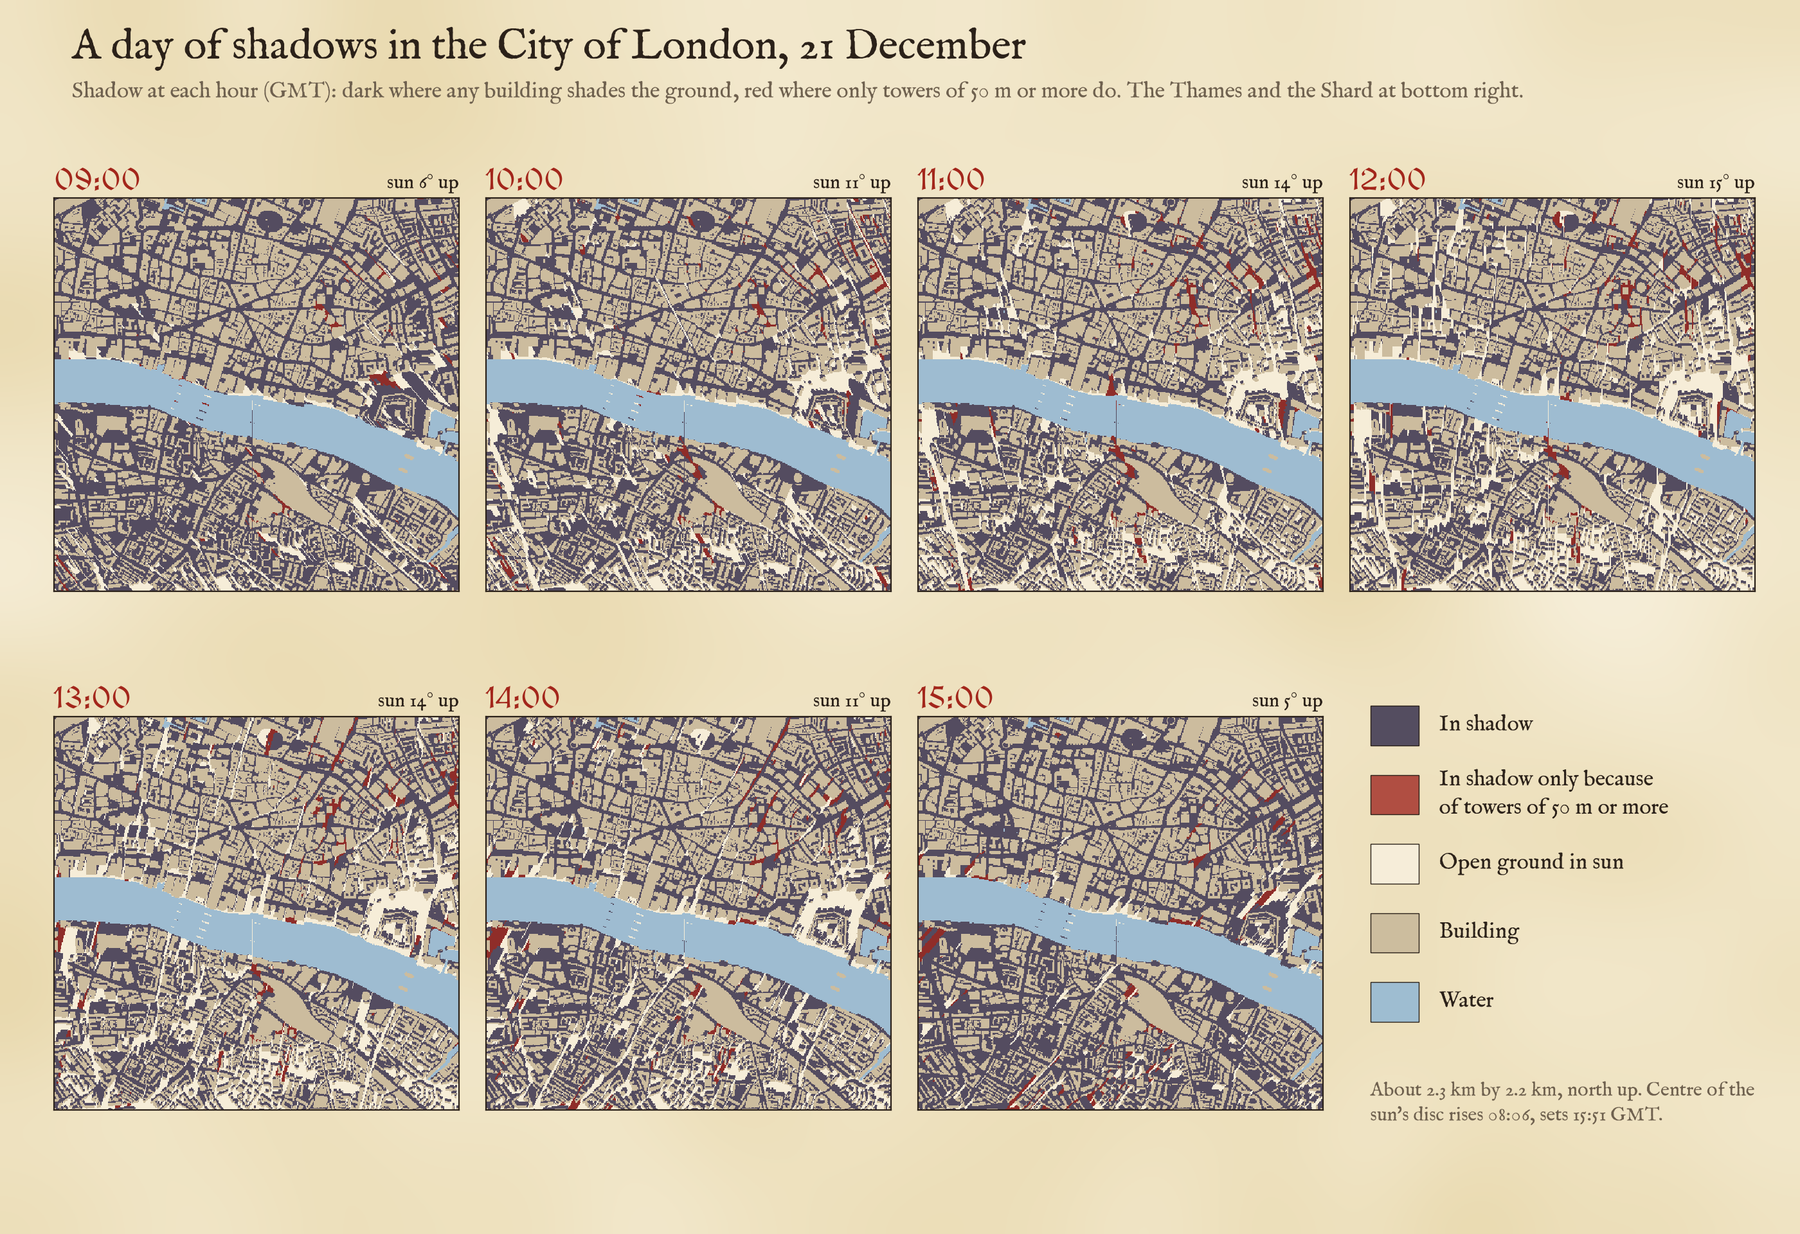
Every new tower in a British city brings the same question from its neighbours: what will it do to our light? In midsummer the answer is usually not much, because the sun is high and shadows are short. In midwinter it is a different matter. So I took the building heights that OpenStreetMap holds for the centres of London, Canary Wharf, Manchester, Birmingham, Leeds, Liverpool, Glasgow and Edinburgh, laid them on a 5 metre grid with the lie of the land underneath, and traced the sun every ten minutes through the shortest day, the spring equinox and midsummer.
A shadow four times as long
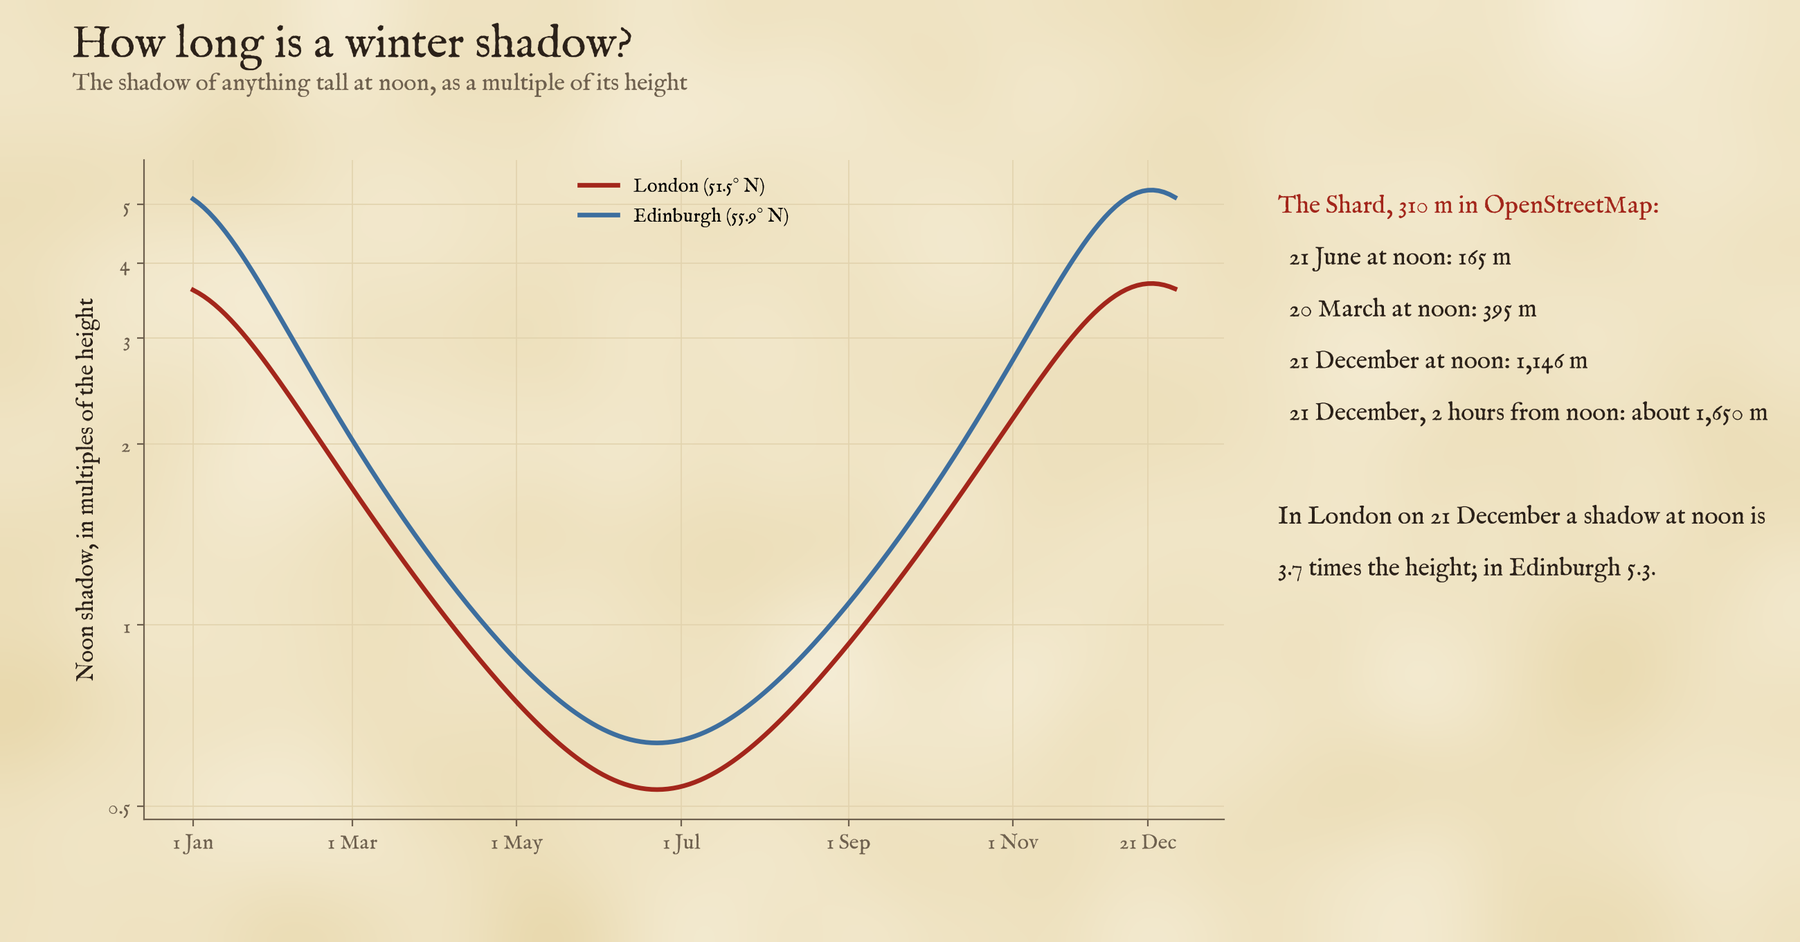
At noon on 21 December a shadow in London is 3.7 times as long as whatever casts it, and in Edinburgh 5.3 times. A 300 metre tower in London would throw a noon shadow 1,110 metres long. The Shard, 310 metres tall in OpenStreetMap, reaches 1,146 metres at noon on the solstice and about 1,650 metres two hours either side. At midsummer its noon shadow is just 165 metres.
The ordinary city takes most of the sun
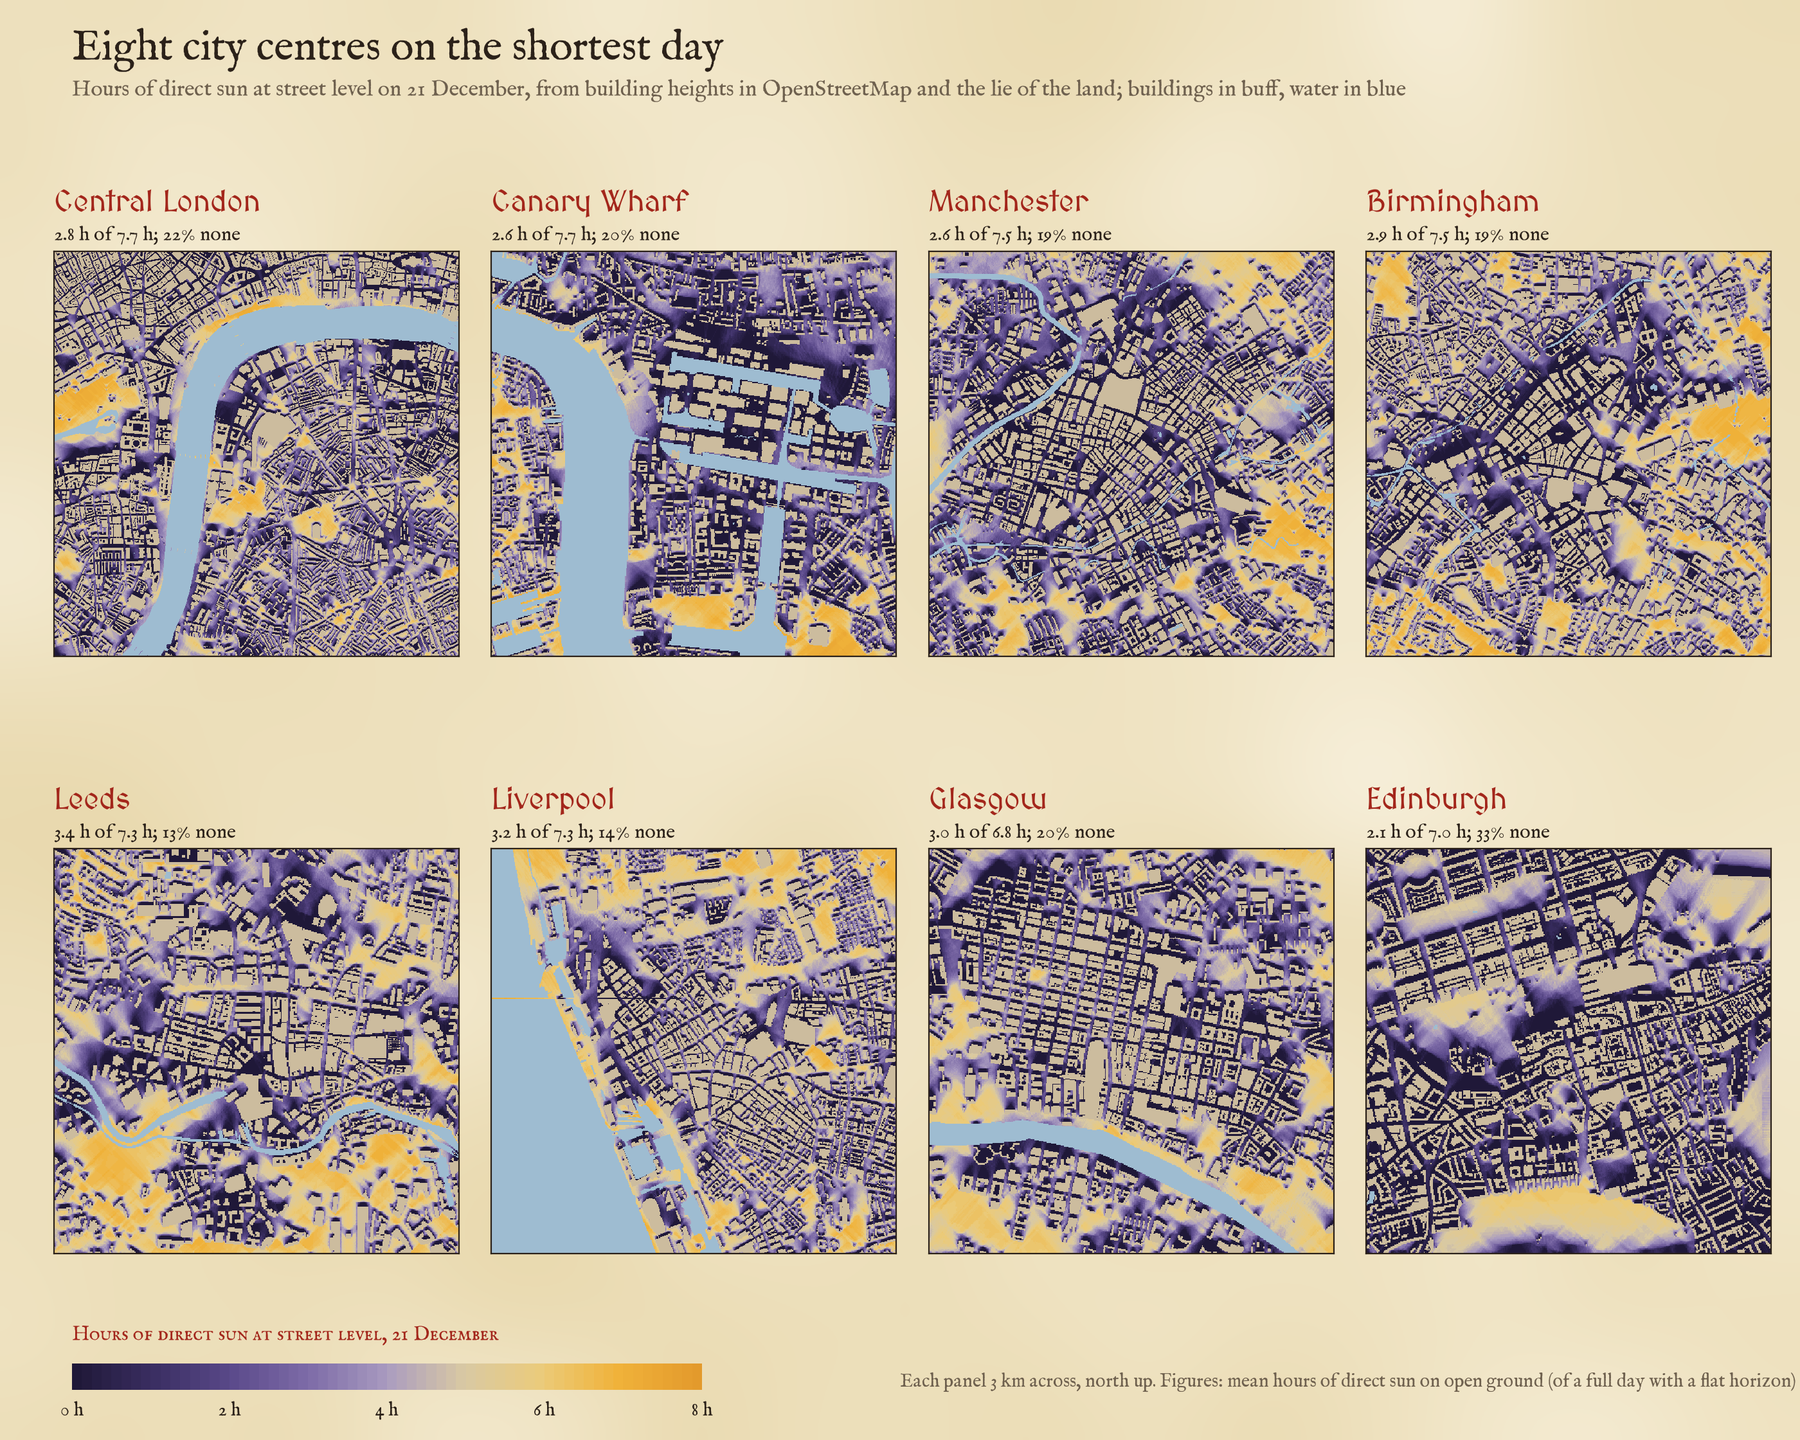
The first surprise is that towers are not the main culprit. On the average square metre of open ground in central London, direct sun lasts 2.8 hours on the shortest day, out of 7.7 with a clear horizon, and 22% of open ground gets none at all. Take away only the towers of 50 metres or more and you would win back just 0.18 hours. Narrow streets between six-storey blocks do the damage when the sun is this low.
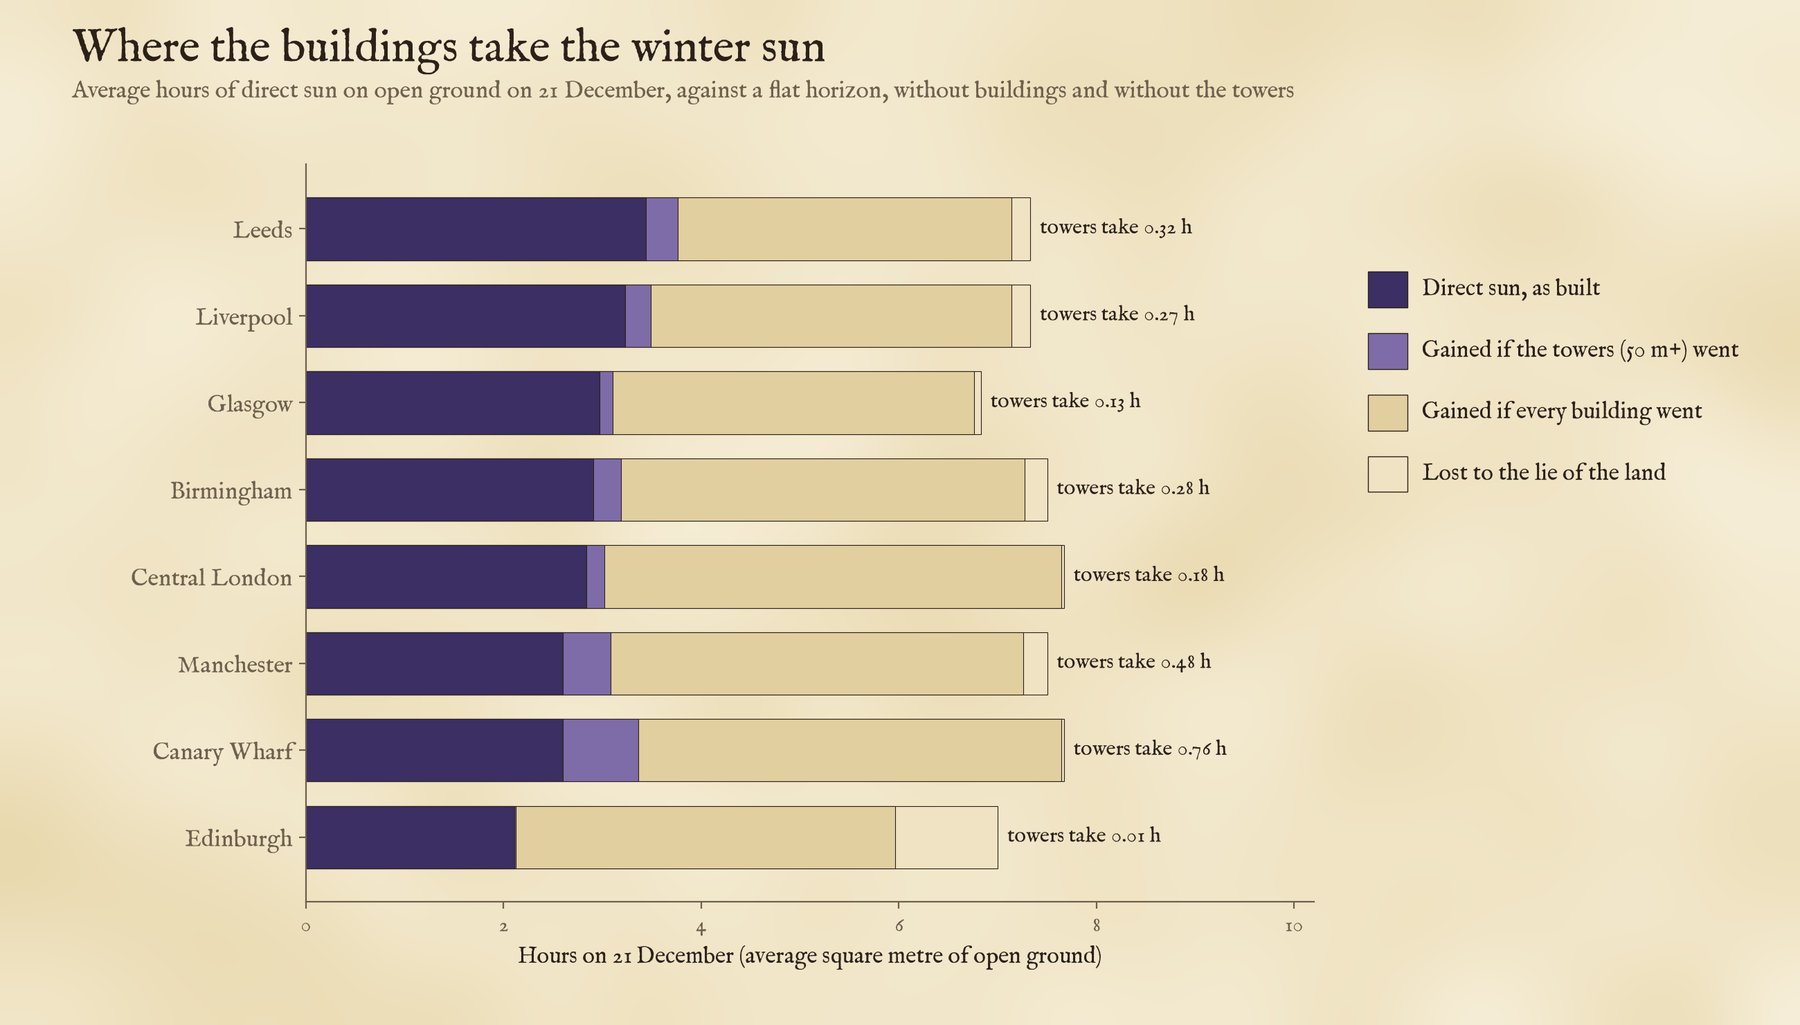
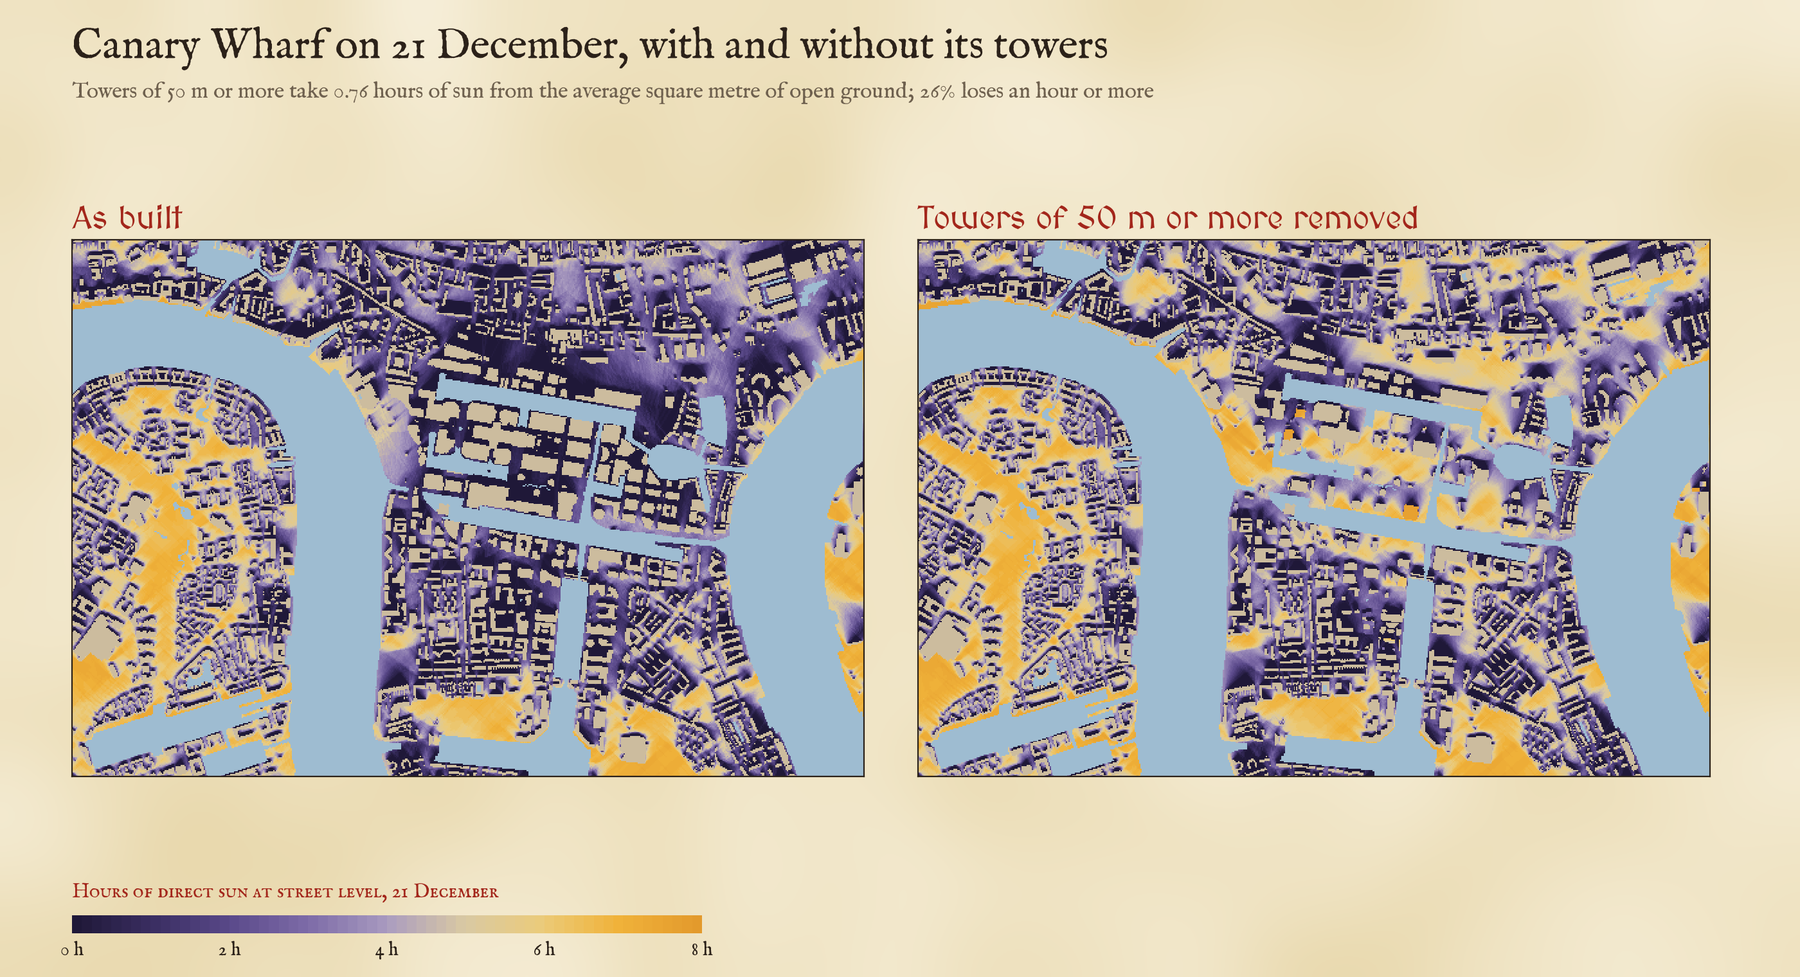
Canary Wharf is the exception. There the towers take 0.76 hours from the average square metre, and 26% of the open ground loses an hour or more to them. Manchester, with its cluster of towers at the south end of Deansgate, comes next.
At noon on the shortest day the Shard’s shadow is 1,146 metres long.
The darkest streets
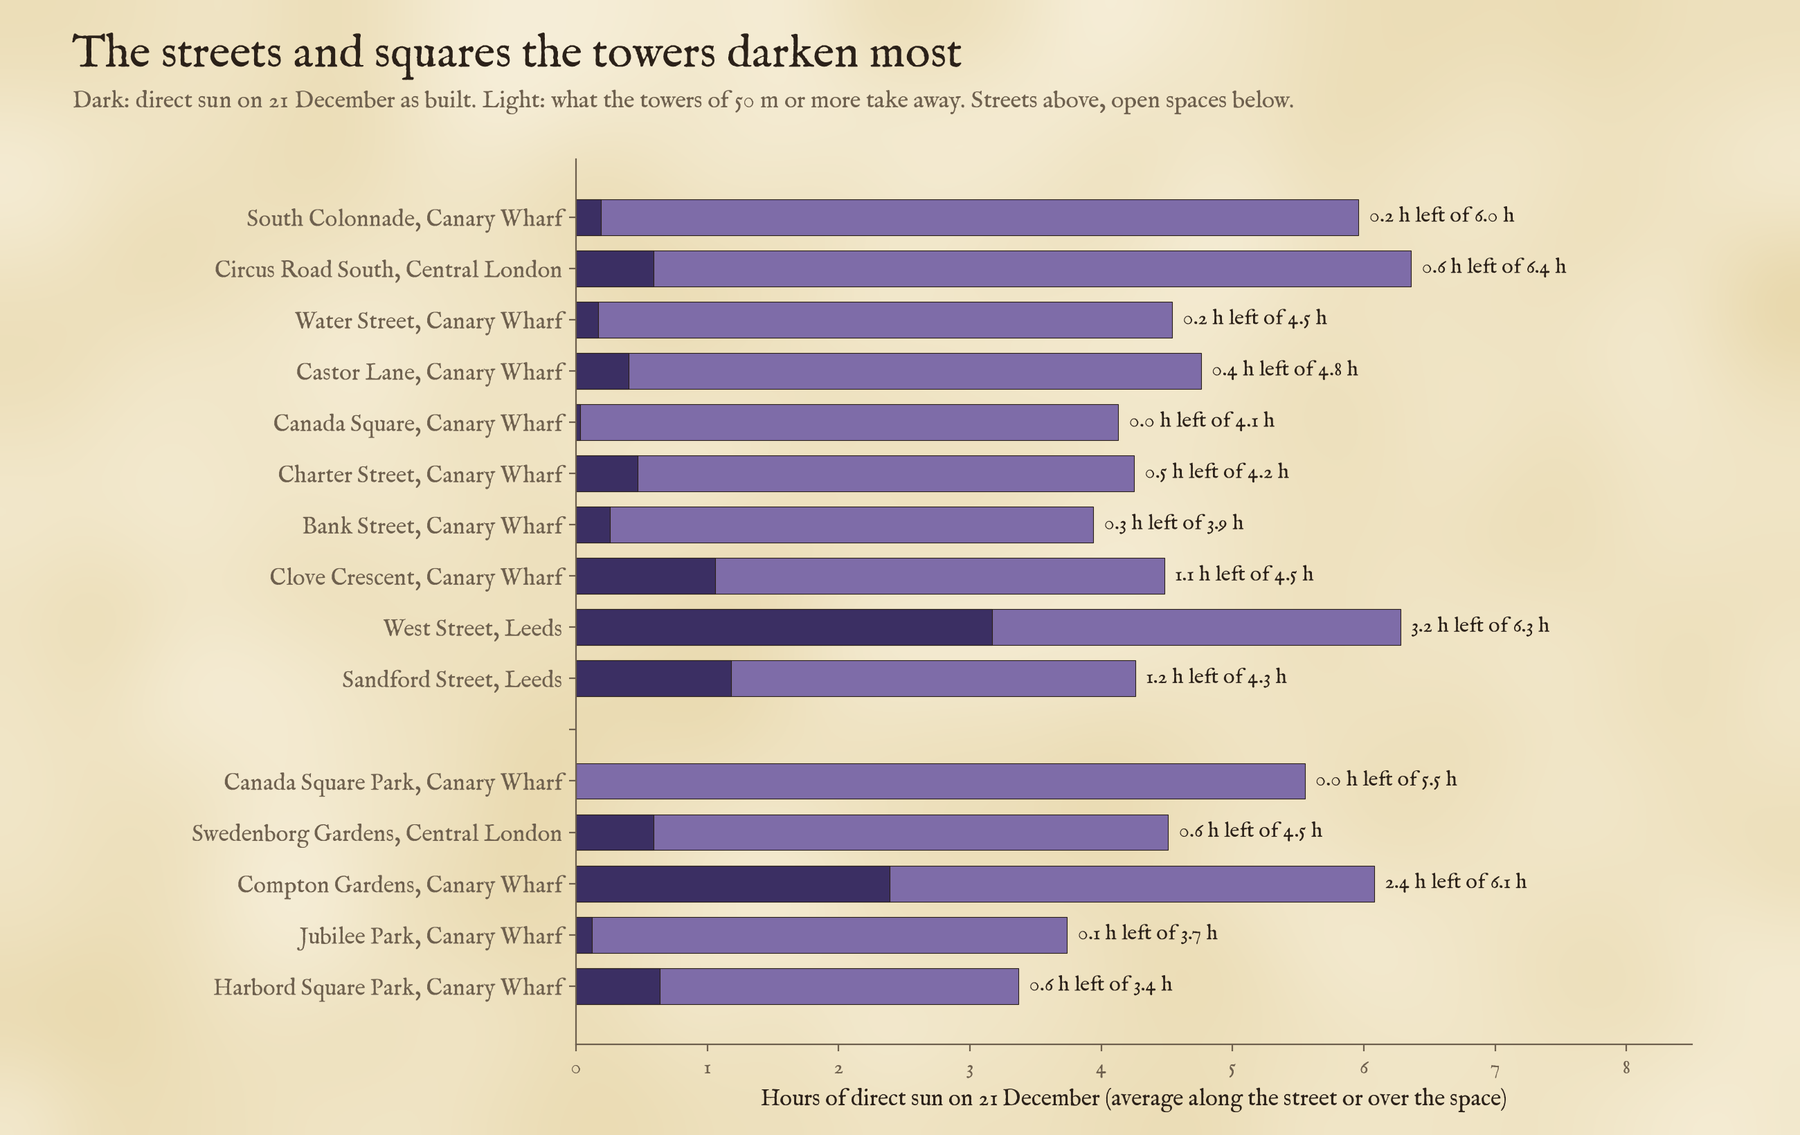
The streets that lose most to towers are at Canary Wharf: South Colonnade keeps 0.2 hours of direct sun on the shortest day, against 6.0 without the towers, and Canada Square Park keeps 0.0 hours of a possible 5.5. In central London the biggest losses are round Battersea Power Station and the new towers beside it, on the Marylebone Flyover, and at Elephant and Castle and Vauxhall. Leeds has its own pair, West Street and Sandford Street.
The darkest centre of all has almost no towers. 33% of Edinburgh’s open ground gets no direct sun on 21 December. It is the furthest north of the eight, so the noon sun is only 10.7 degrees up. The hills take about an hour of a seven-hour day on average, but on their own they would leave only 0.7% of the ground in shade all day. The rest is the work of ordinary buildings: on flat ground they alone would leave 29% without sun, and standing on the Old Town ridge above the valleys makes it worse.
How I did this
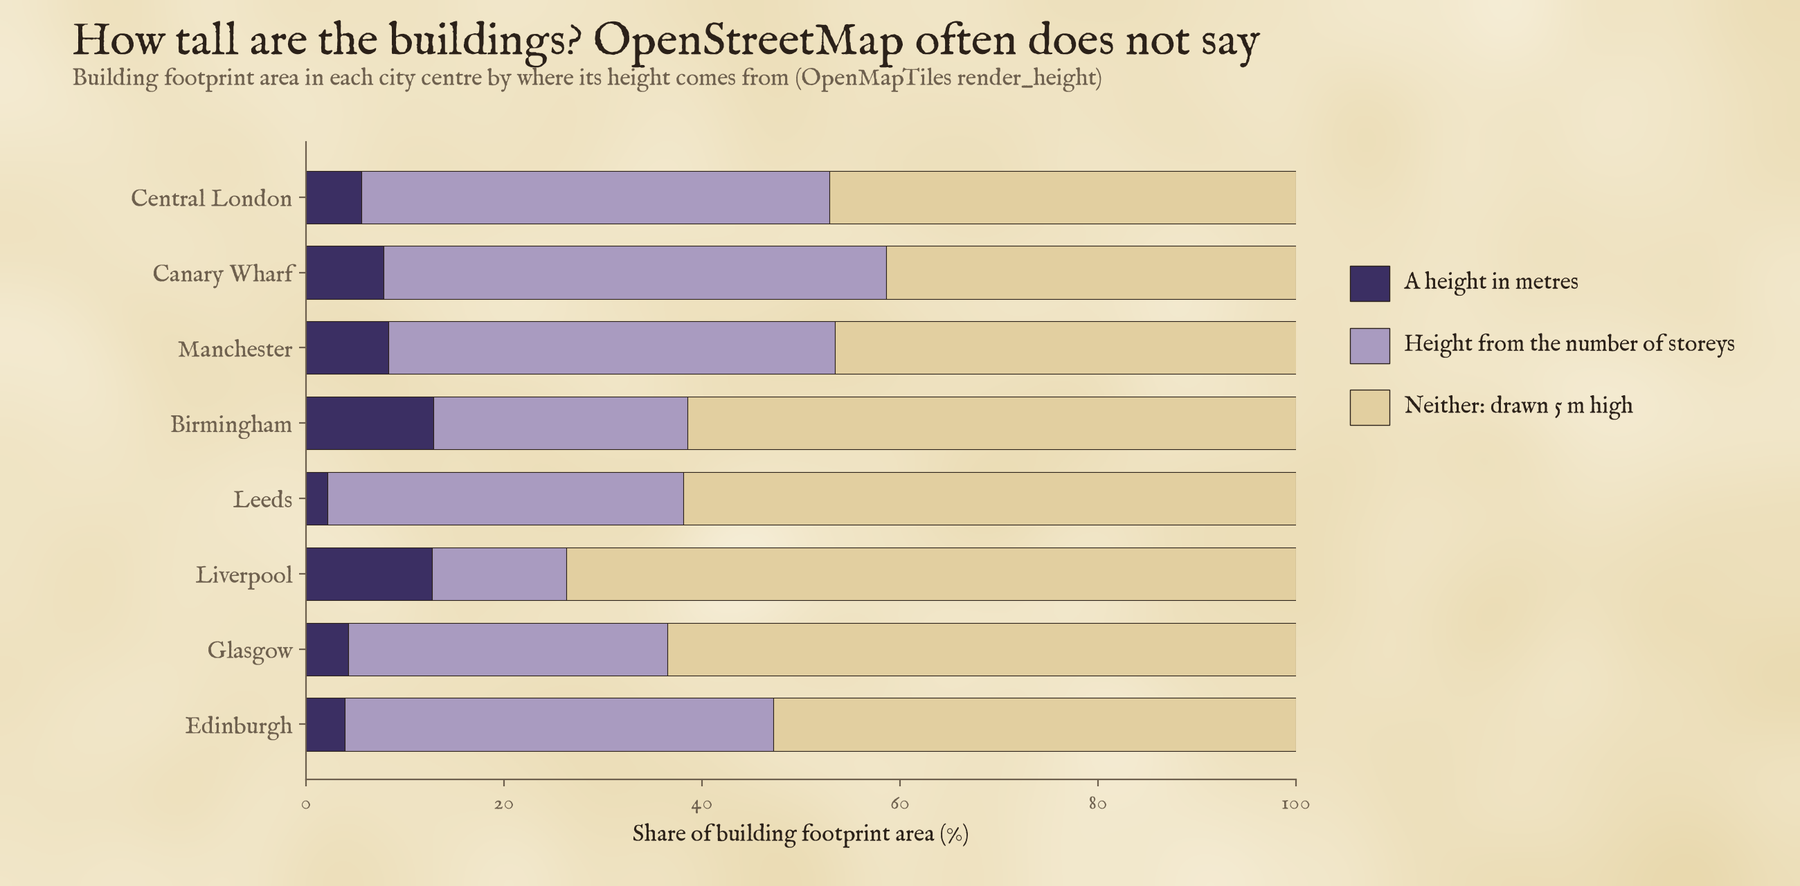
The building heights come from OpenStreetMap, served as vector tiles by OpenFreeMap. Where a building has no height, the tiles use its number of storeys, and where it has neither, a default of 5 metres. That default covers a lot: between 41% and 74% of the building footprint in these centres. Towers nearly always have a height or a storey count, but ordinary buildings come out too short and the streets too sunny, so the real picture is darker than these maps, and the towers’ share of the loss is, if anything, a little high. Heights worked out from storeys can also flatter residential towers: Landmark Pinnacle at Canary Wharf, 233 metres with 75 storeys, comes out at 275. For each position of the sun I swept a 5 metre grid along the sun’s direction and marked every cell whose view of it is blocked, for the city as built, for the city without its towers, and with no buildings at all. There are no trees, no cloud and no awnings.
Notes and sources
- Buildings, streets and open spaces: OpenStreetMap contributors (ODbL), as OpenFreeMap vector tiles in the OpenMapTiles schema.
- Terrain: AWS Terrain Tiles. Sun position: NOAA solar equations with the Spencer (1971) series and Saemundsson (1986) refraction.
- Planning guidance on sunlight: BRE (2022) Site layout planning for daylight and sunlight (BR 209), third edition.
- Paper: Hotham, T. (2026) Shadows of the giants. Zenodo. 10.5281/zenodo.24075303
- I wrote the text, with drafting and editing assistance from Claude (Anthropic), which also helped prepare the analysis code. I reviewed and checked all text and results.

