
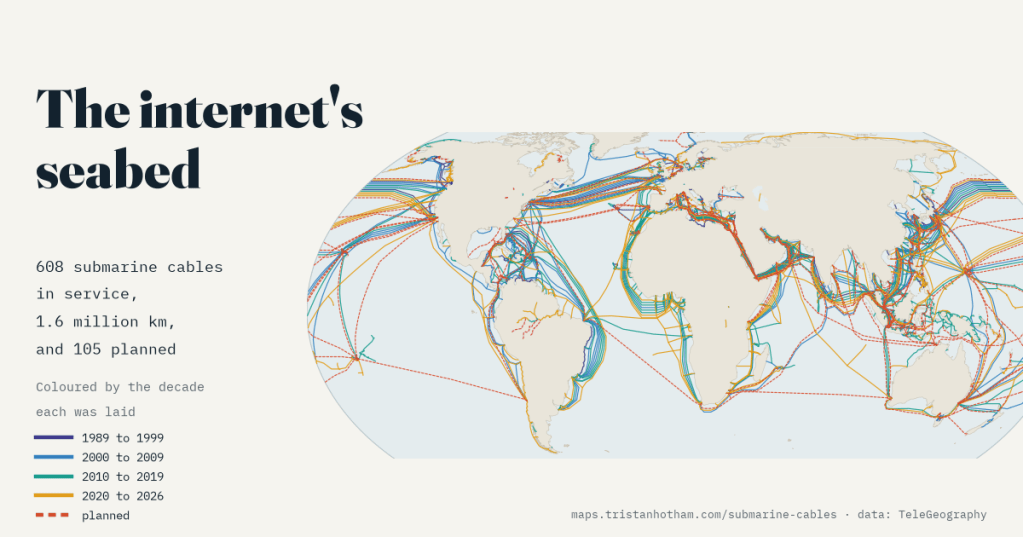
Almost everything you do online crosses the sea floor on a cable about as thick as a garden hose. I mapped every one of them in TeleGeography’s open record: when each was laid, who owns them now, and the narrow places where dozens squeeze through together.
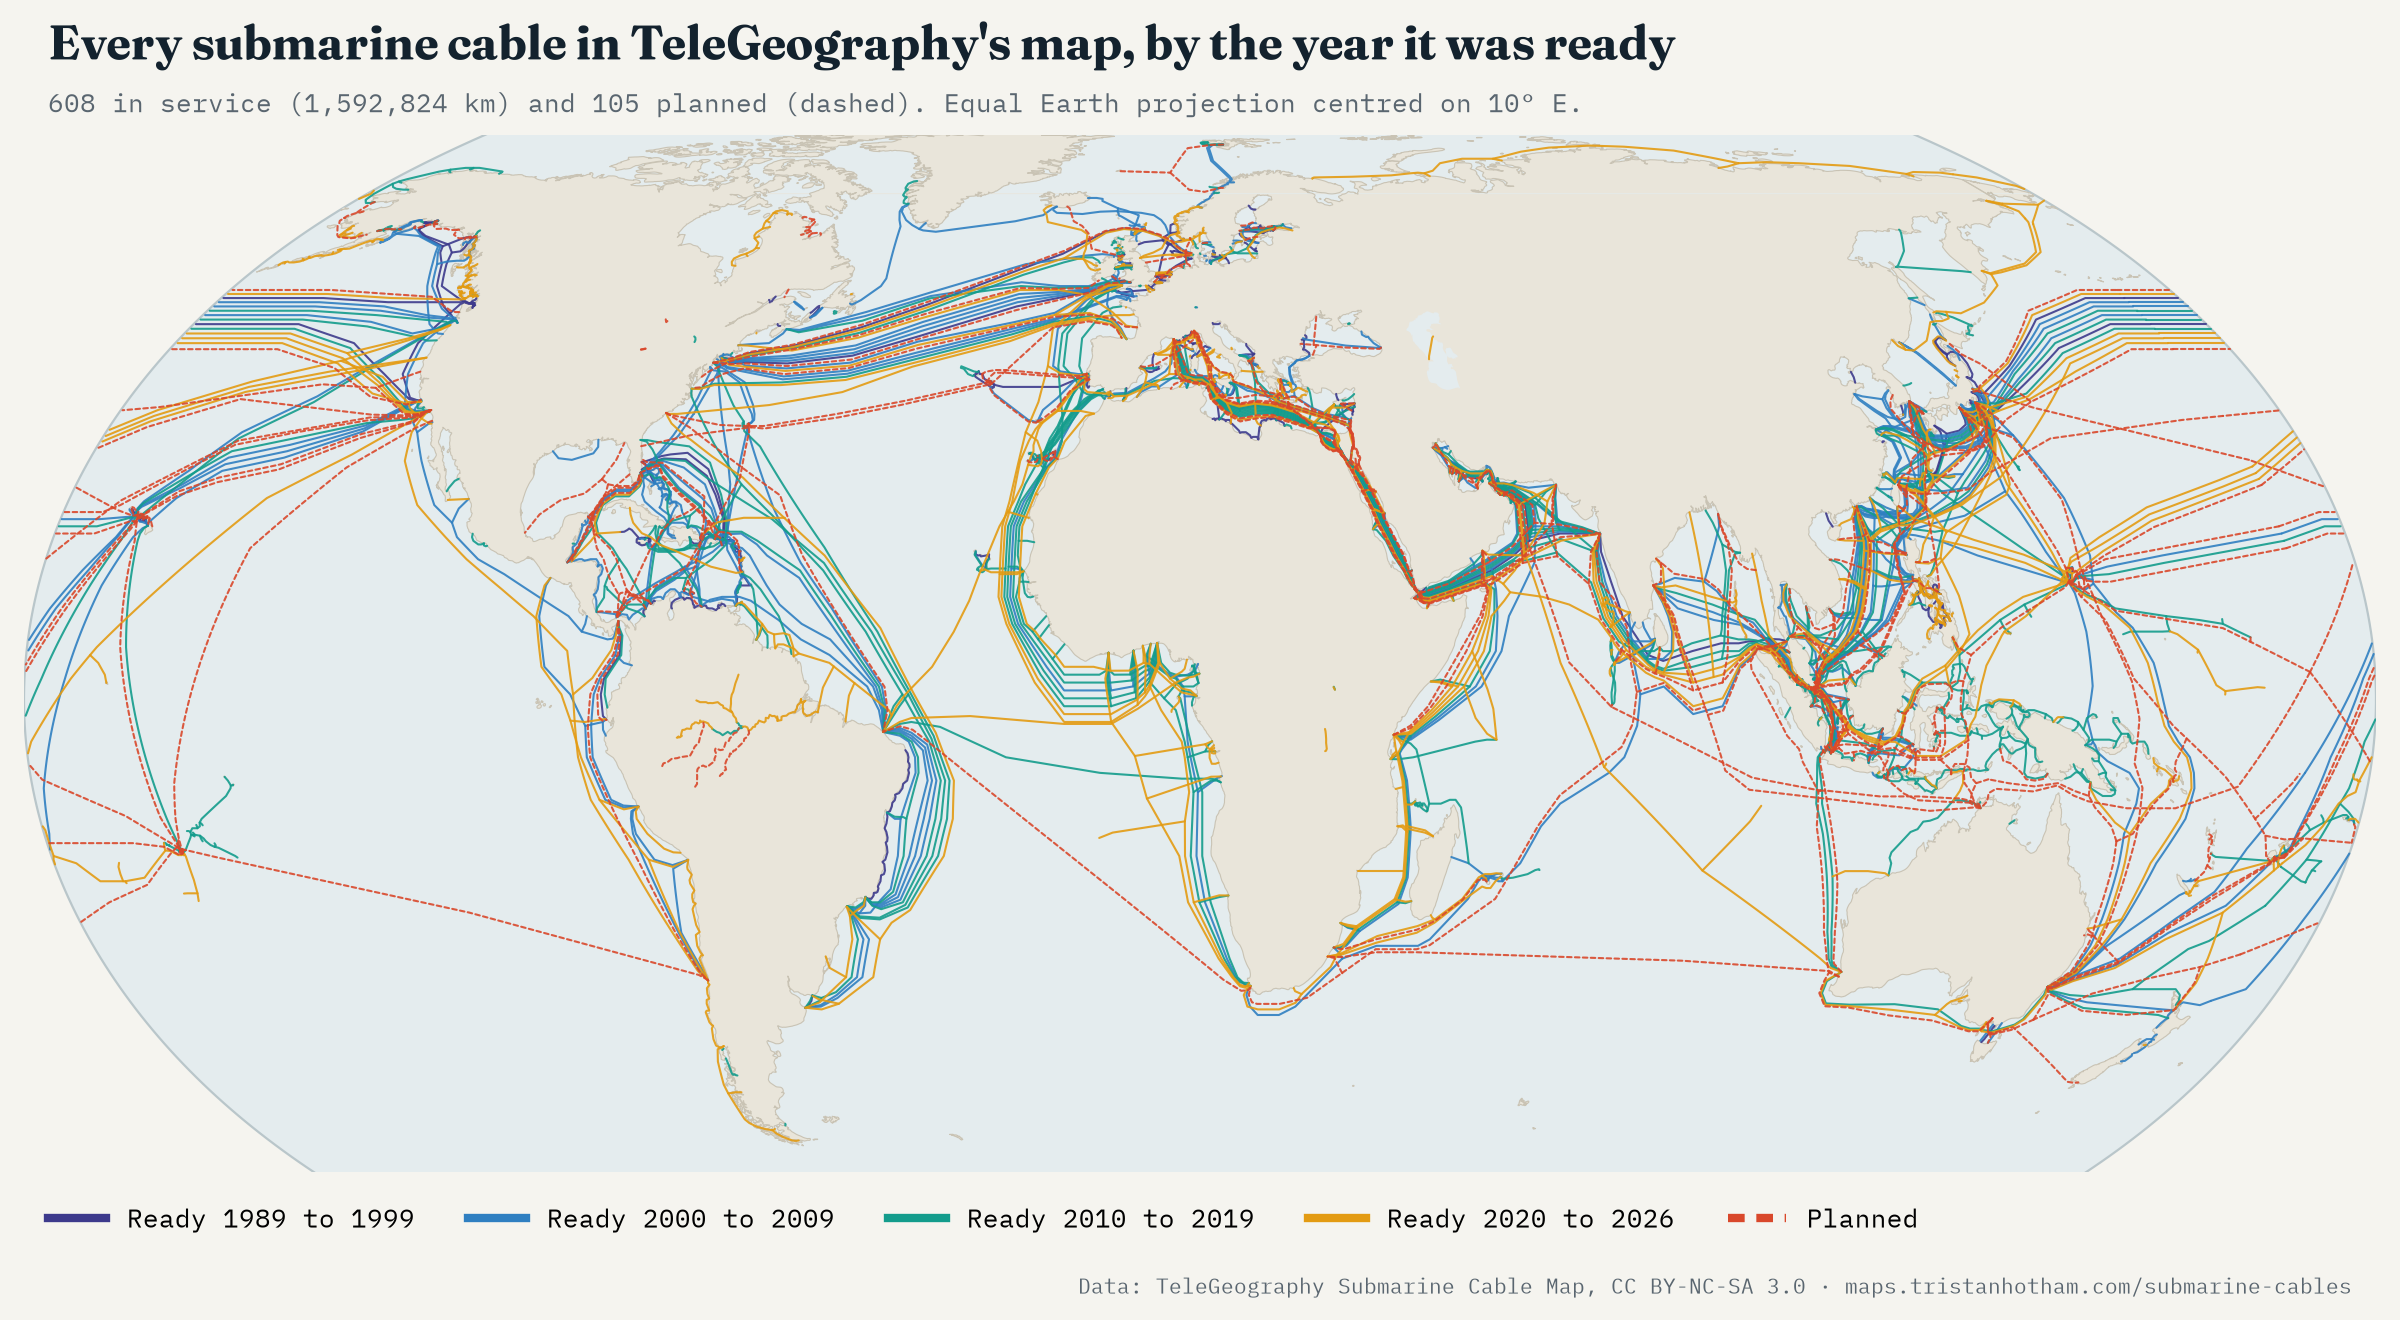
Ask people how the internet crosses an ocean and quite a few will say satellites. In fact almost all of it goes through glass fibres in cables on the sea floor, laid by specialist ships from one beach to another. The best open record of these cables is TeleGeography’s Submarine Cable Map, and its data are published for anyone to use. In its 2026 version there are 608 cables in service, with a combined length of 1,592,824 km, enough to go round the Earth 39.7 times. Another 105 are planned or being laid.
A boom, a bust and a second boom
Each cable has a ready-for-service year, the year it started carrying traffic. The oldest still in use date from 1989, and 113 cables from the 1990s are still working. Then comes the dot-com bubble: 74 of today’s cables came into service in just three years, 1999 to 2001, and 2001 is still the year with the most kilometres laid (121,657 km). When the bubble burst, only 31 cables came into service in the next three years.
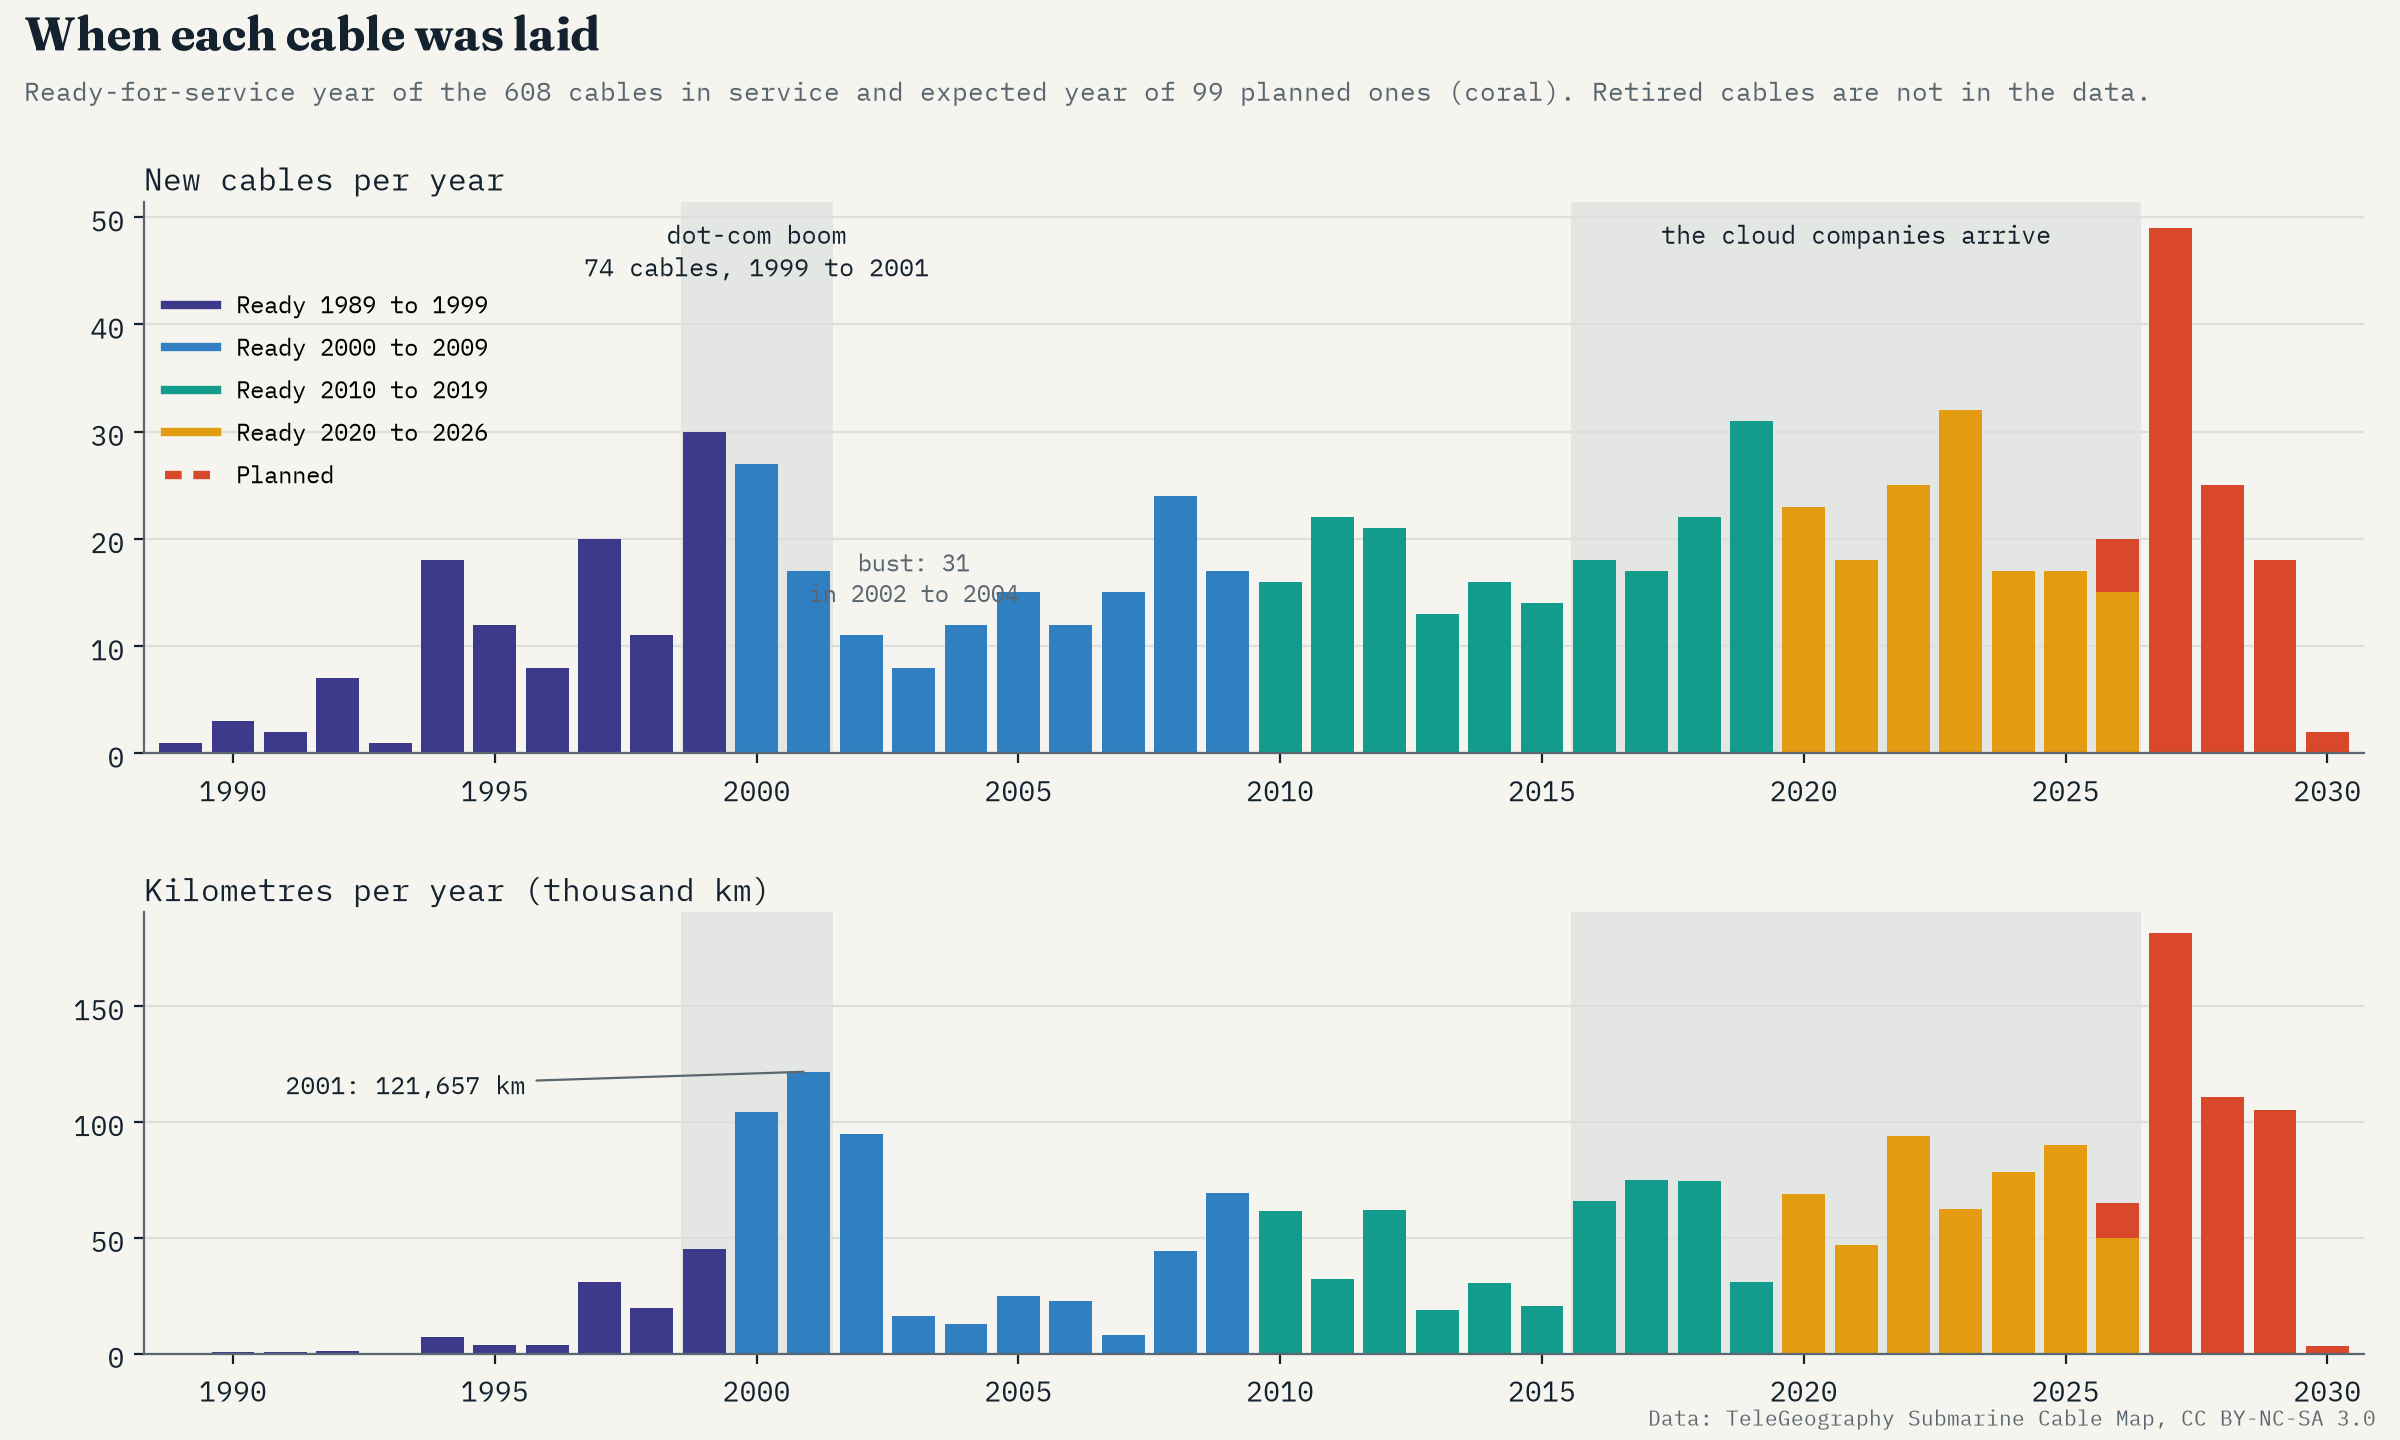
The second boom is now. 2023 had the most new cables of any year (32), and 49 are planned for 2027. Cables are getting longer too: the median planned cable is 2,569 km, against 230 km for the 1990s cables still in service. One caution: TeleGeography maps the cables in service and planned, not the ones switched off, so the early years show survivors, not everything that was laid.
From telephone clubs to cloud companies
Submarine cables used to be built by clubs of telephone companies, each taking a share: one cable in the record, SAT-3/WASC, has 33 owners. Then a new kind of owner arrived. I looked for Google, Meta, Amazon Web Services and Microsoft in each cable’s list of owners, matching whole names only. They own a share of none of the length ready before 2010. Of the length ready from 2015 to 2019 they part-own 24%, from 2020 to 2026 50%, and of everything planned 55%.
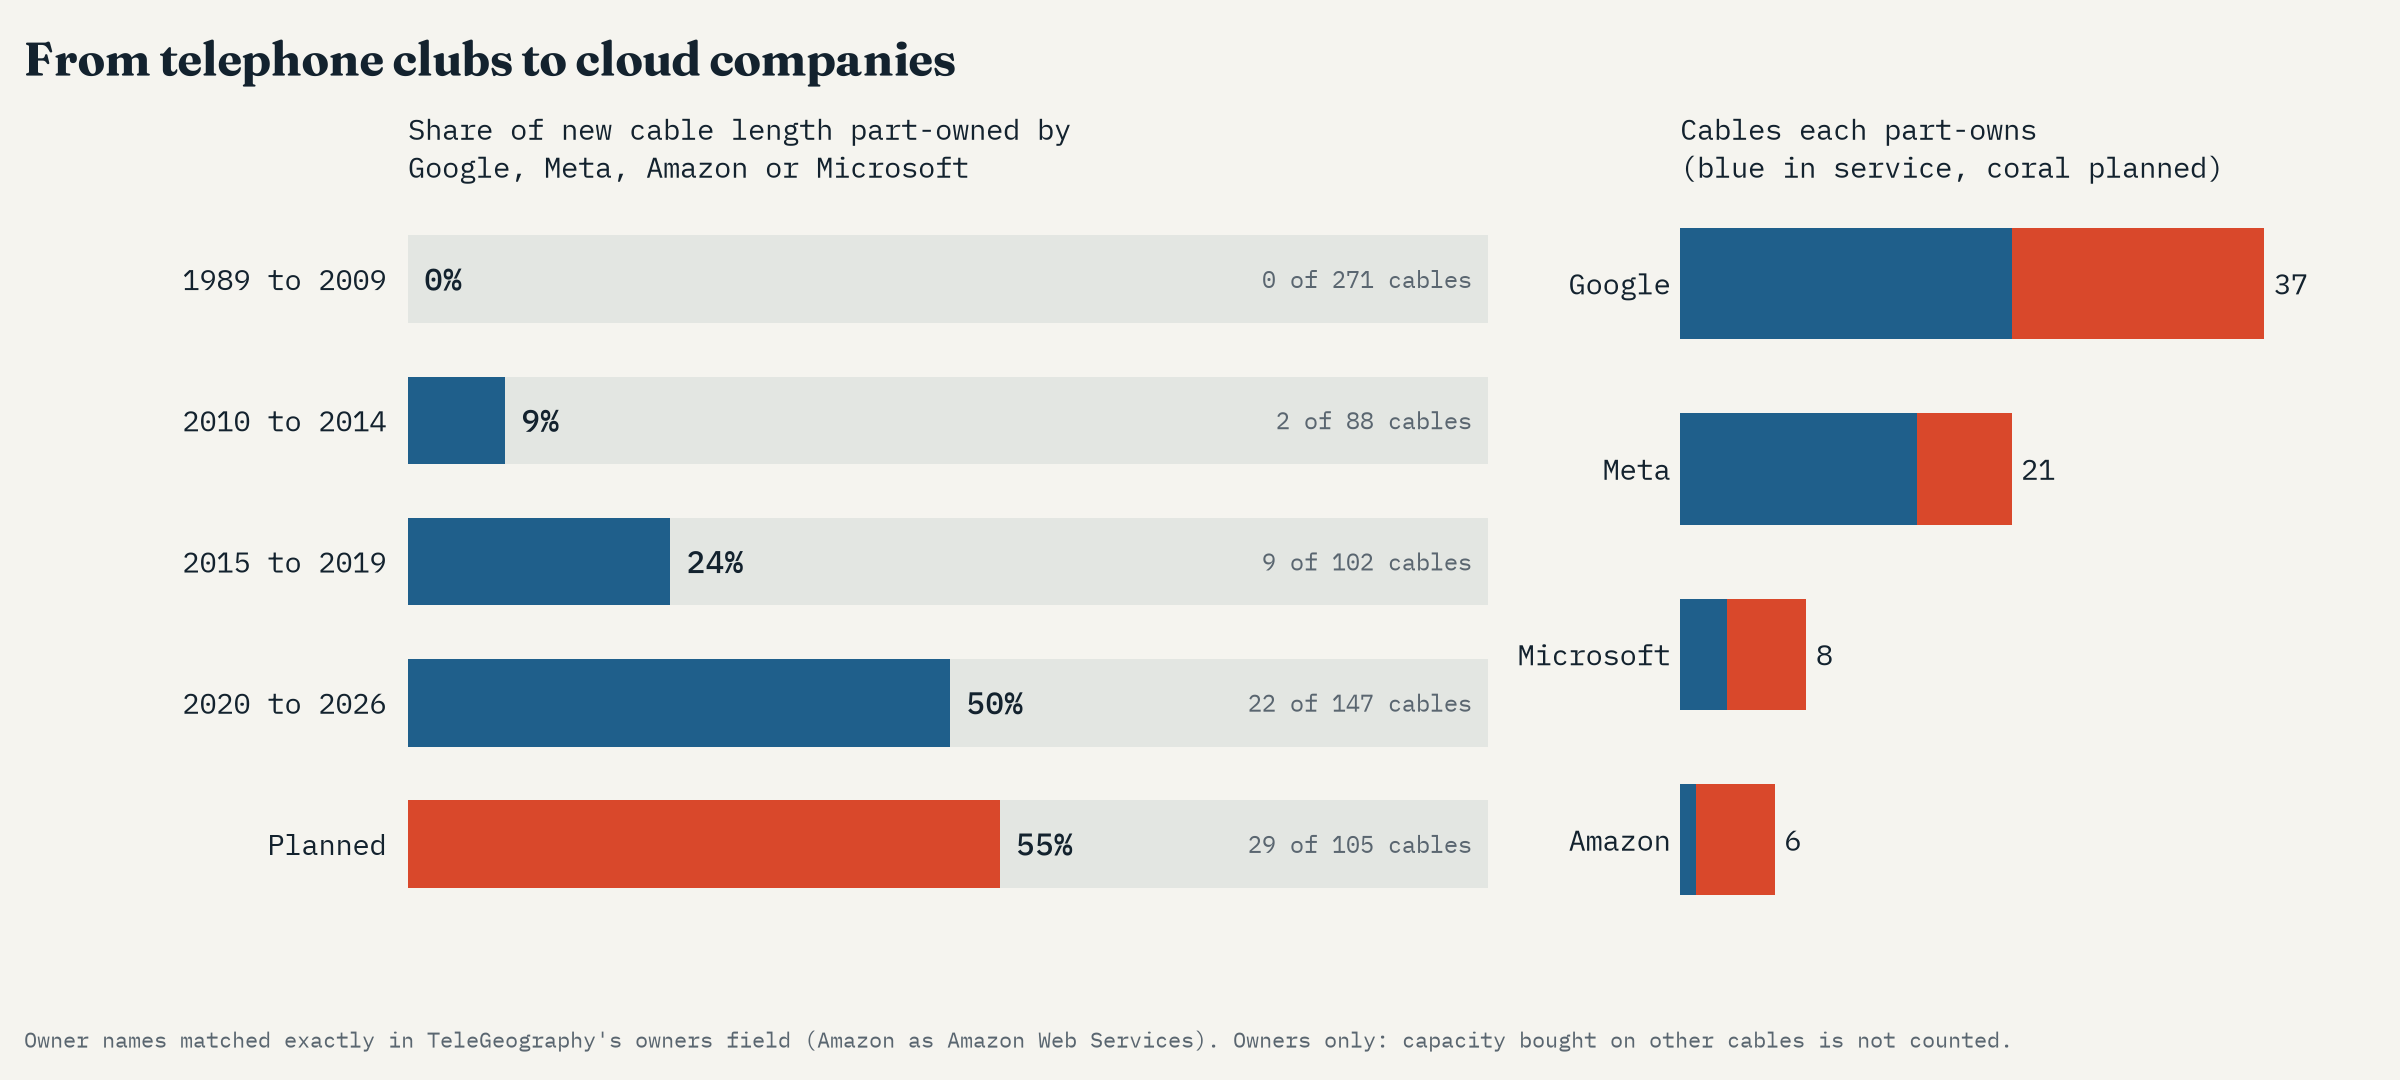
More and more they go it alone: 31 of the 62 cables with one of the four as an owner have no other owner, and 22 of those are still planned. The longest cable in the whole record, the planned Project Waterworth at 50,000 km, is Meta’s alone. And these numbers are a floor, because the owners list does not show the capacity these companies buy on cables they do not own.
Where the network squeezes through
Hundreds of cables sound like plenty of spare routes, but geography funnels them. Anchors, fishing gear and earthquakes break cables every year, and where many share one strait or one stretch of coast, one accident can cut several at once. So I drew a band across each well-known strait and counted the cables whose routes cross it, and did the same for a ring of famous landing hubs.
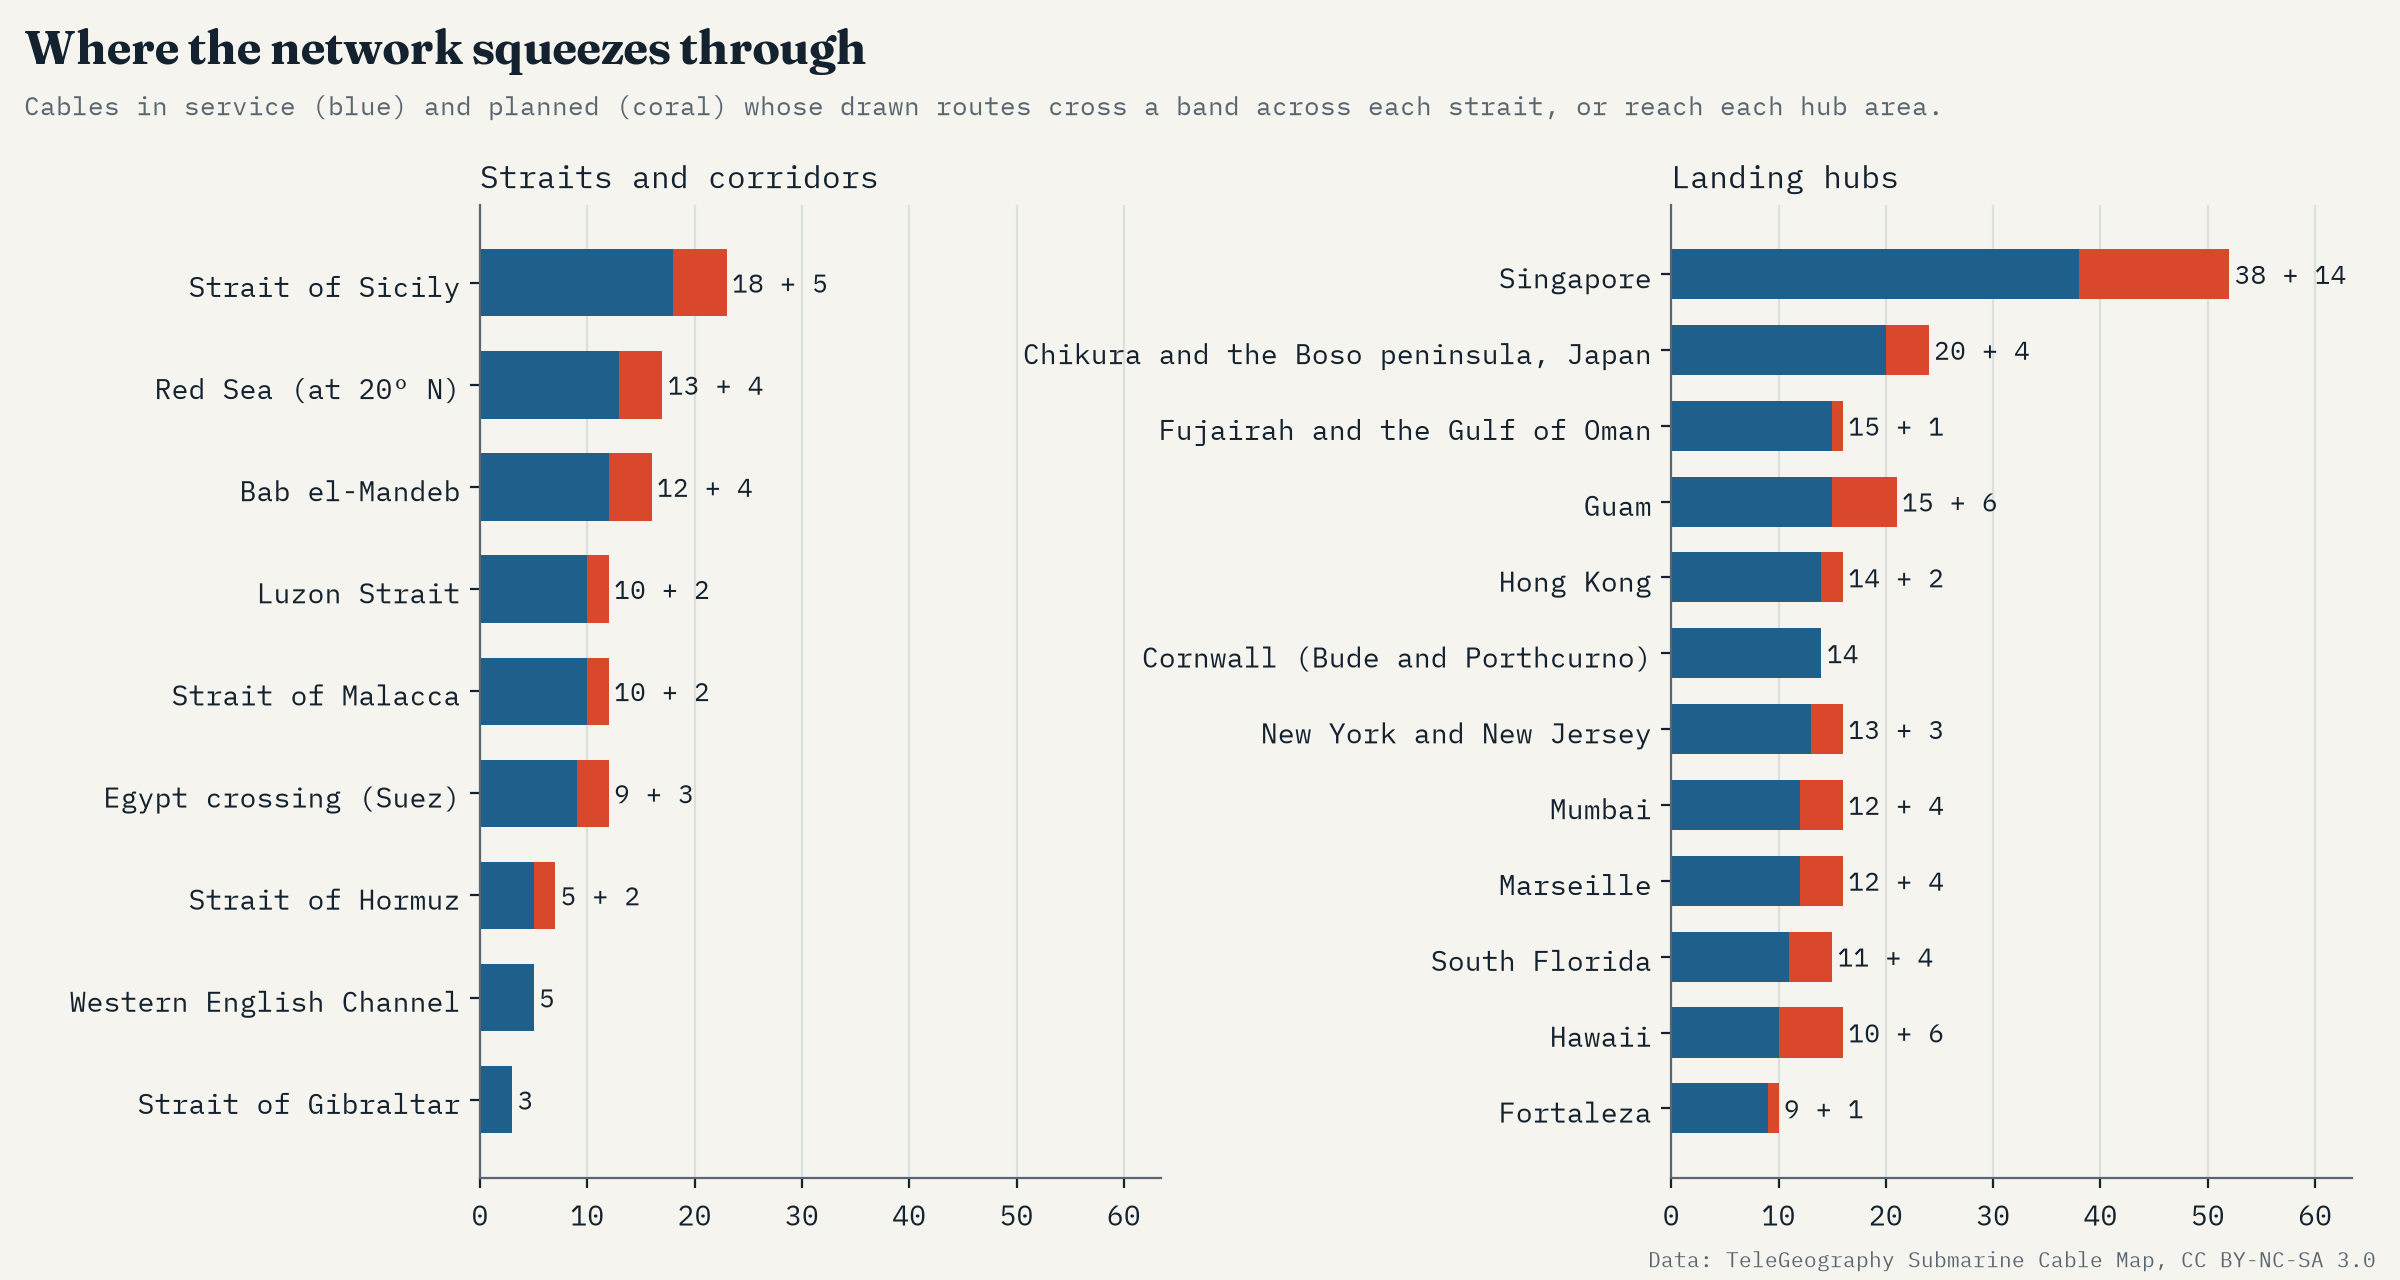
The Red Sea is the great funnel between Europe and Asia. 12 cables in service pass through the Bab el-Mandeb, the strait at its southern end, with a combined length of 217,777 km, 14% of all the cable length in service. 4 more are planned. To reach the Mediterranean, 9 of them cross Egypt overland. In 2024 several Red Sea cables were damaged, reportedly by the dragging anchor of a ship that had been attacked and abandoned, and traffic between Europe, Asia and East Africa had to be rerouted.
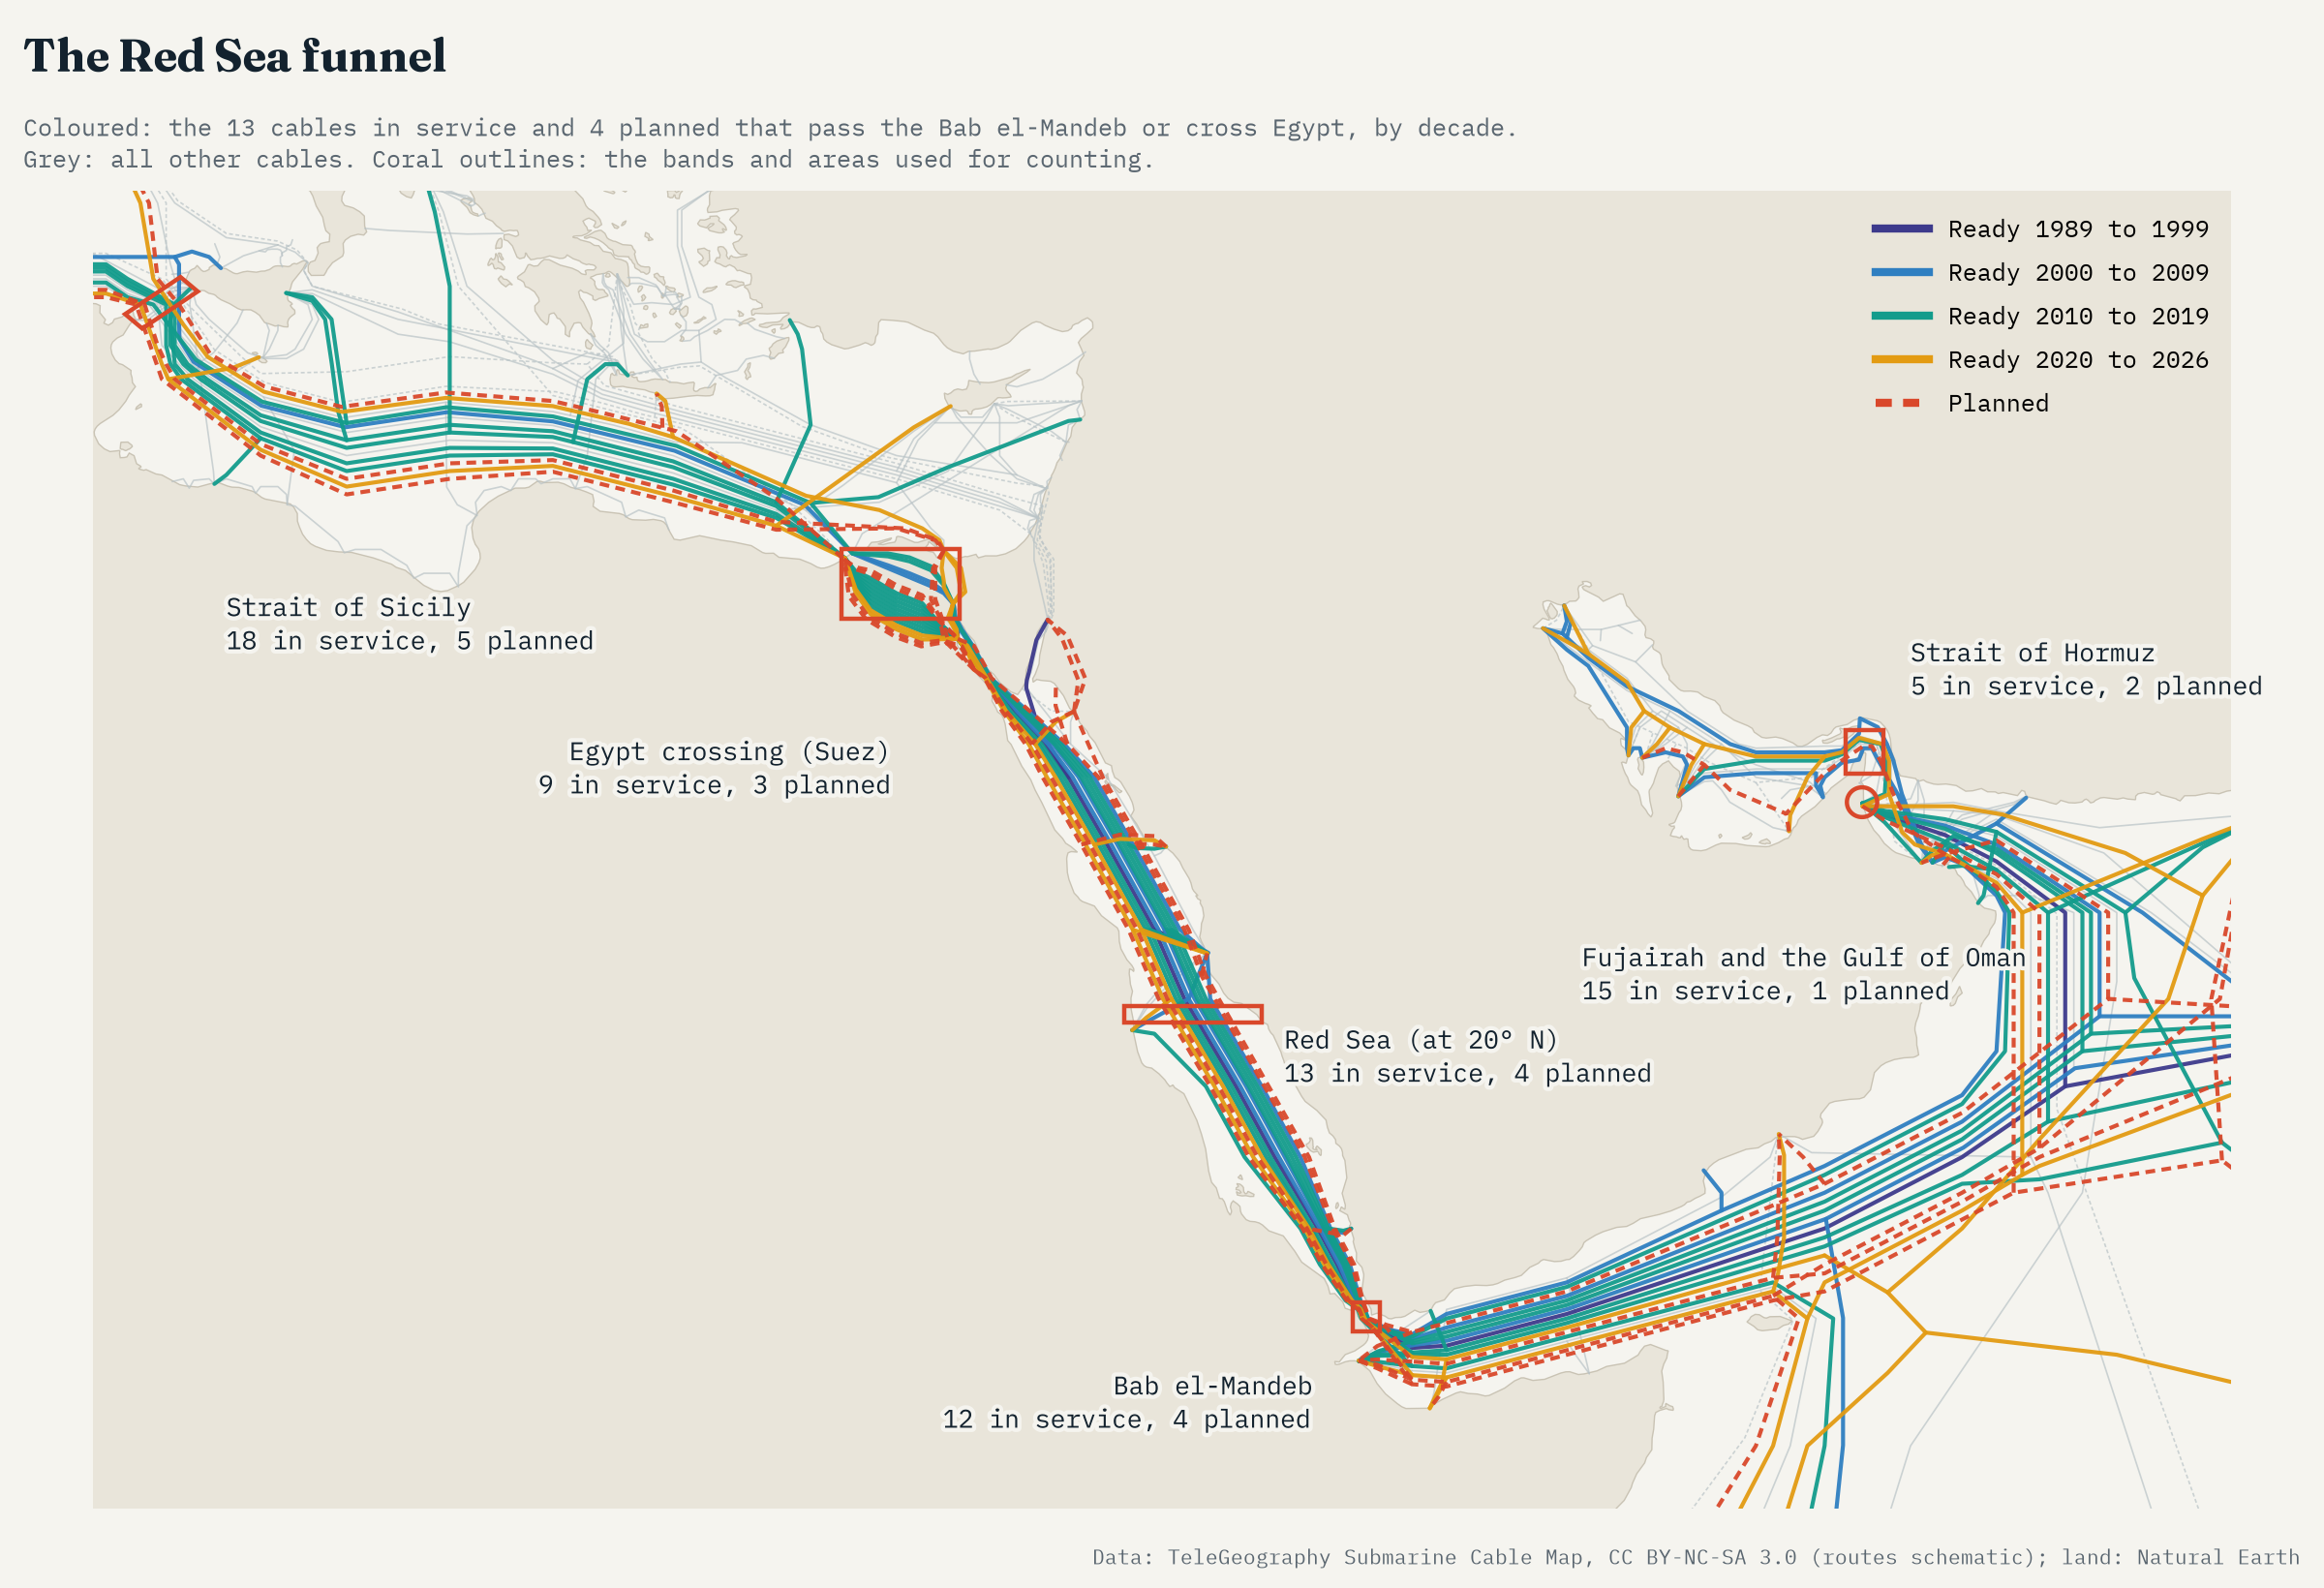
The busiest strait in my list is the Strait of Sicily, the Mediterranean’s waist, with 18 cables. In East Asia the Luzon Strait between Taiwan and the Philippines carries 10, and in 2006 an earthquake off southern Taiwan broke several cables there at once. Then there are the hubs where cables crowd onto a few beaches. Singapore is in a class of its own, with 38 cables reaching the sea within 35 km and 14 more planned. Guam (15) and Hawaii (10) are the stepping stones of the Pacific, and Cornwall (14) is still one of Europe’s great landing coasts.
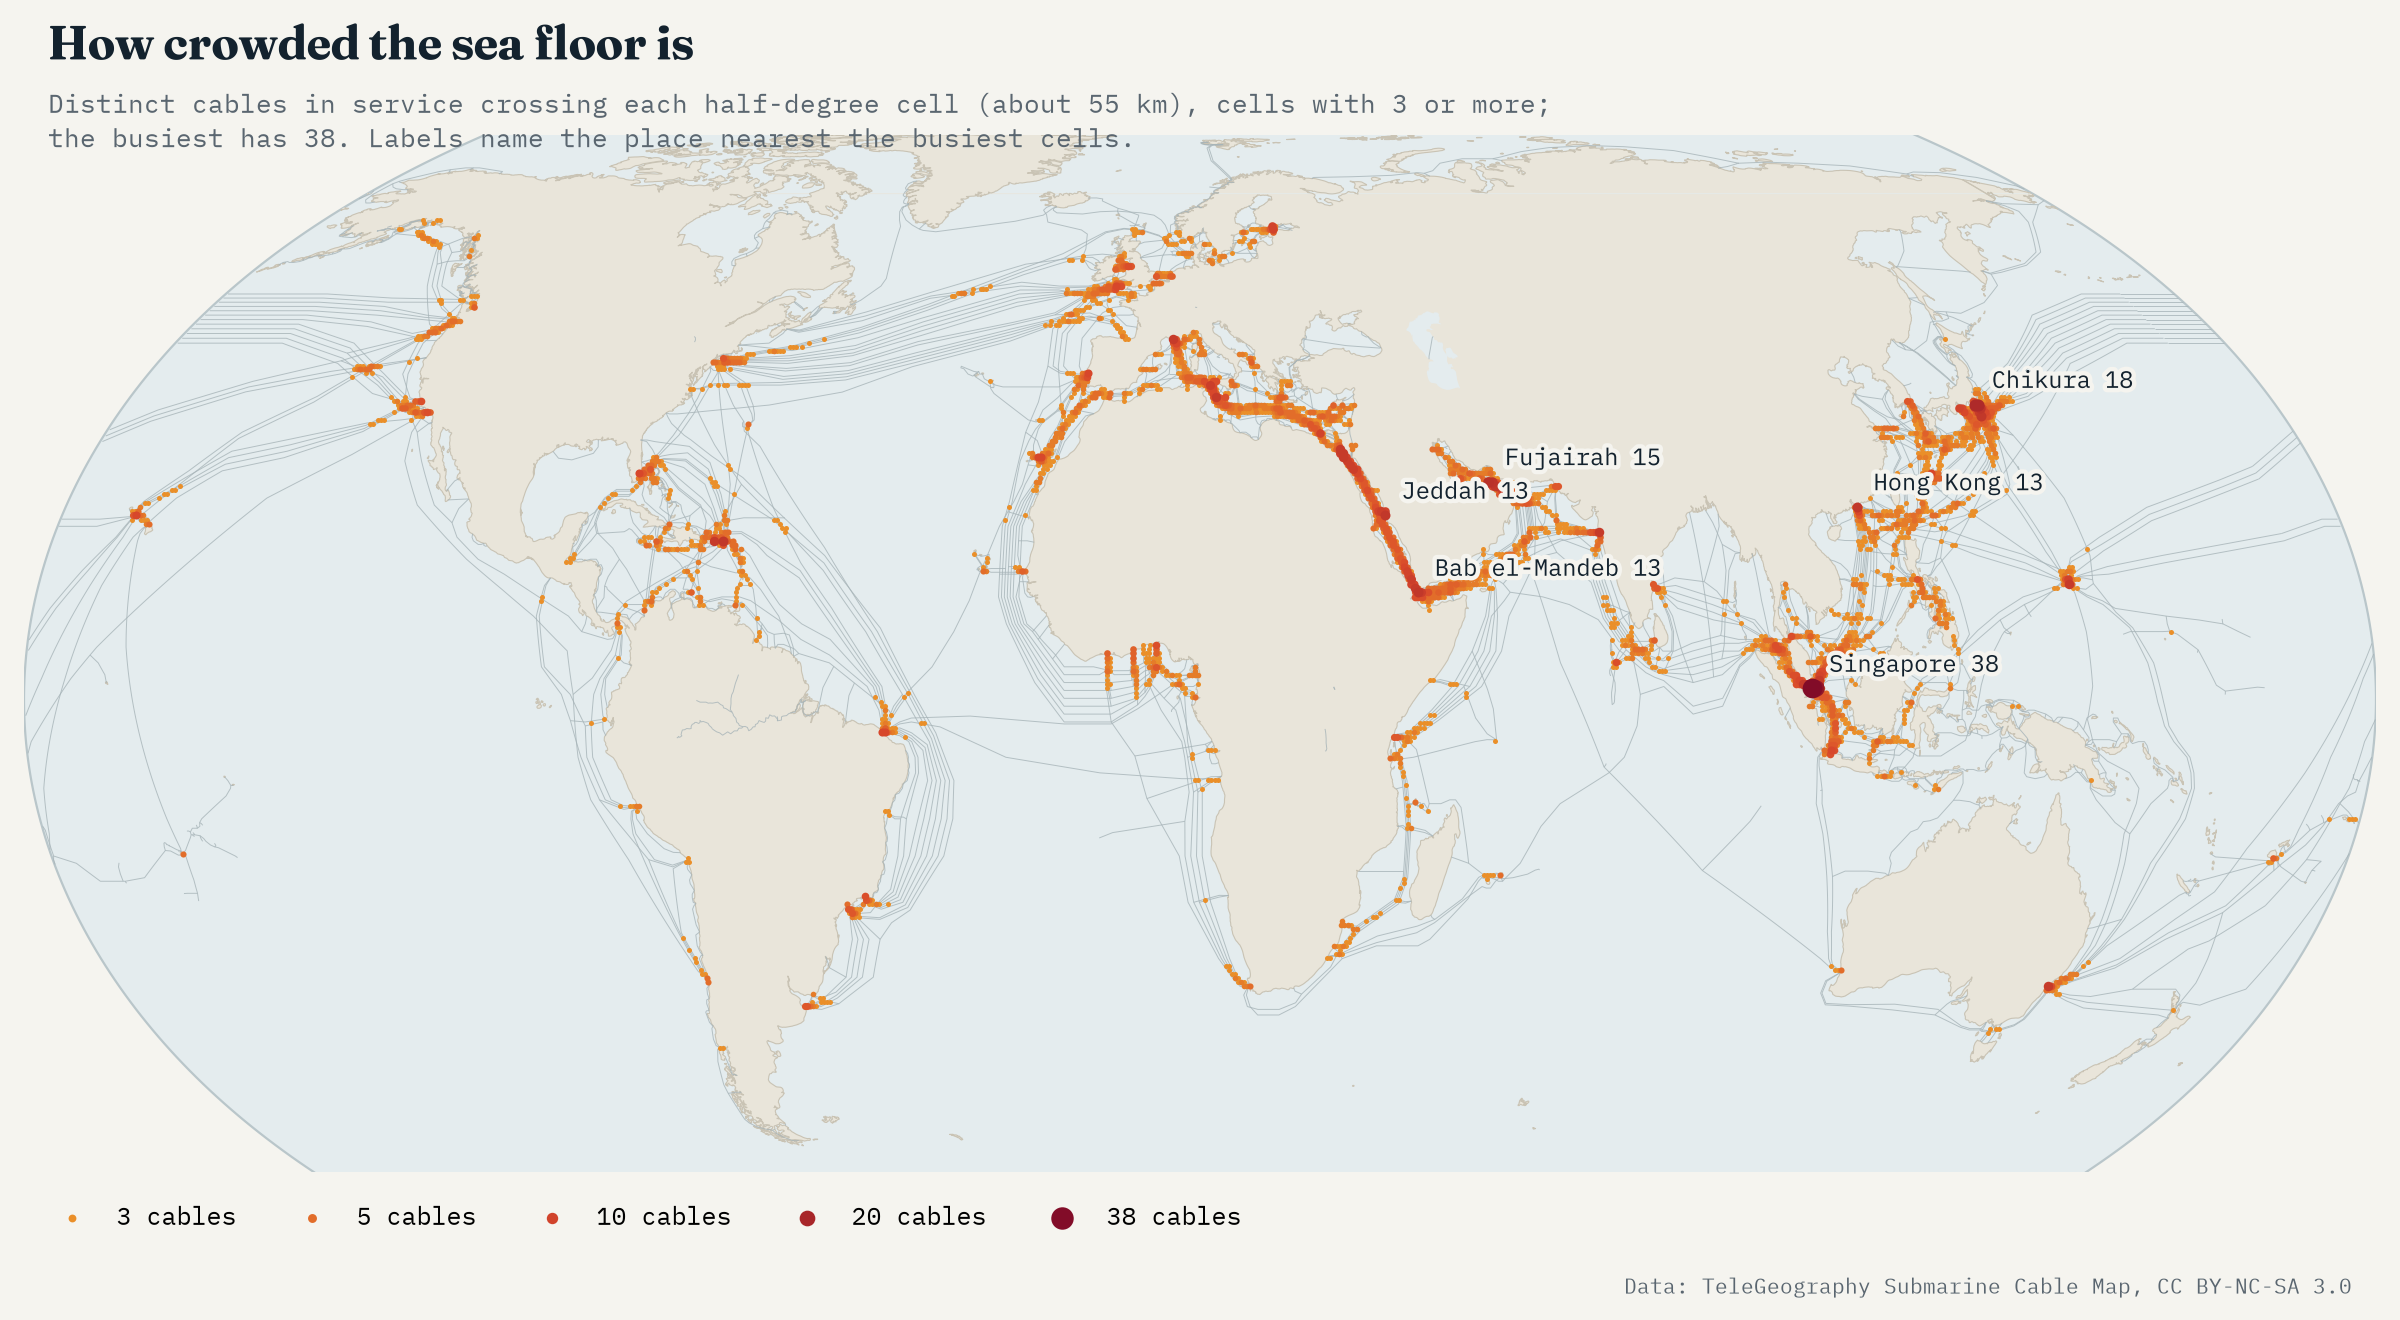
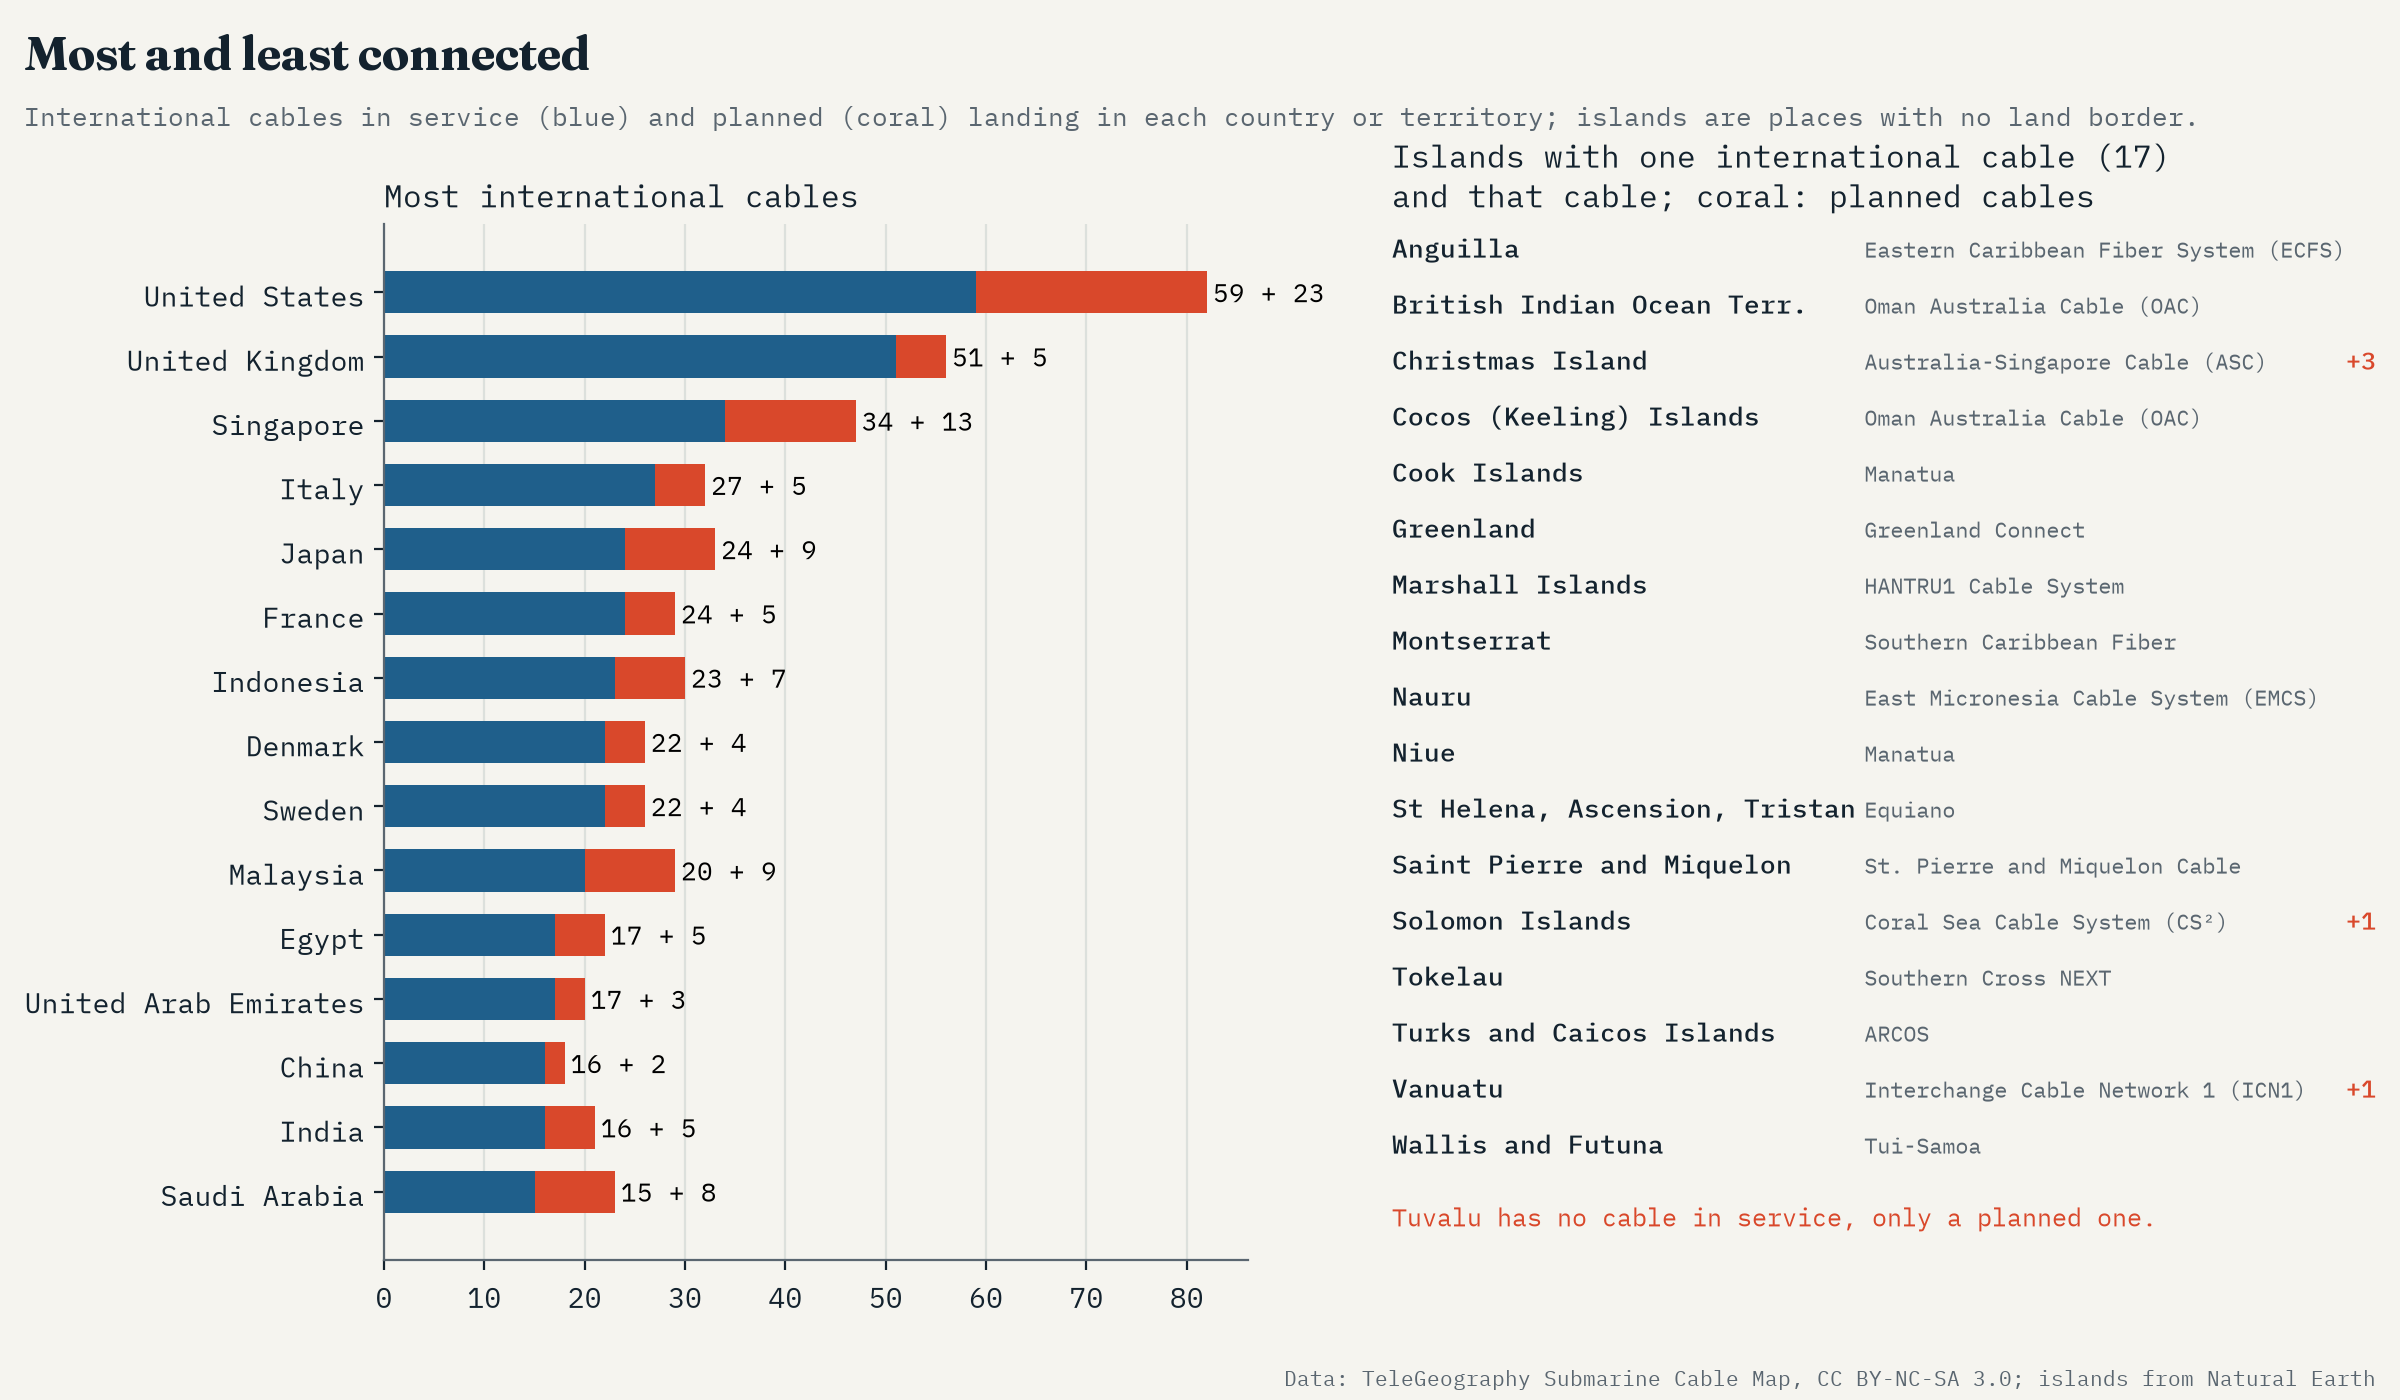
12 cables squeeze through the Bab el-Mandeb. 17 islands hang on a single cable.
One cable from the world
Counting only the cables that link a country to another country, the United States has the most (59), then the United Kingdom (51) and Singapore (34). At the other end, 29 countries and territories have just one. For places with land borders that matters less, but 17 of them are islands with no land border at all: Greenland, Nauru, Niue, Vanuatu, the Solomon Islands, St Helena and others. Tuvalu appears only on a planned cable.
Tonga showed what that means. In January 2022 the eruption of the Hunga Tonga volcano cut the cable to Fiji that was then the country’s only international link, and the islands were largely cut off for weeks. The record now lists Tonga on a second system too.
How I did this
Everything comes from TeleGeography’s Submarine Cable Map data (its routes, landing points and a record for each cable), with land and borders from Natural Earth. Length is TeleGeography’s stated length, or the drawn route where none is given. Owners were matched by exact name. For the choke points I counted cables whose drawn routes cross a band across each strait or enter an area round each hub, and as a check counted the cables crossing every half-degree cell of a world grid. The caveats matter: TeleGeography draws routes schematically, retired cables are not included, and there are no capacities, so a 1990s cable counts the same as a new one that carries thousands of times more. This is a map of where cables run, not of how much they carry.
Notes and sources
- Cable routes, landing points, years, lengths, owners and suppliers: TeleGeography, Submarine Cable Map (submarinecablemap.com), API version 3, 2026. Licensed under CC BY-NC-SA 3.0; the derived data and figures here are shared under CC BY-NC-SA 4.0, a later version of the same licence.
- Land, coastlines and borders: Natural Earth (public domain).
- Background on cable faults: Carter, L. et al. (2009) Submarine Cables and the Oceans: Connecting the World. UNEP-WCMC and ICPC.
- I wrote the text, with drafting and editing assistance from Claude (Anthropic), which also helped prepare the analysis code. I reviewed and checked all text and results.

