
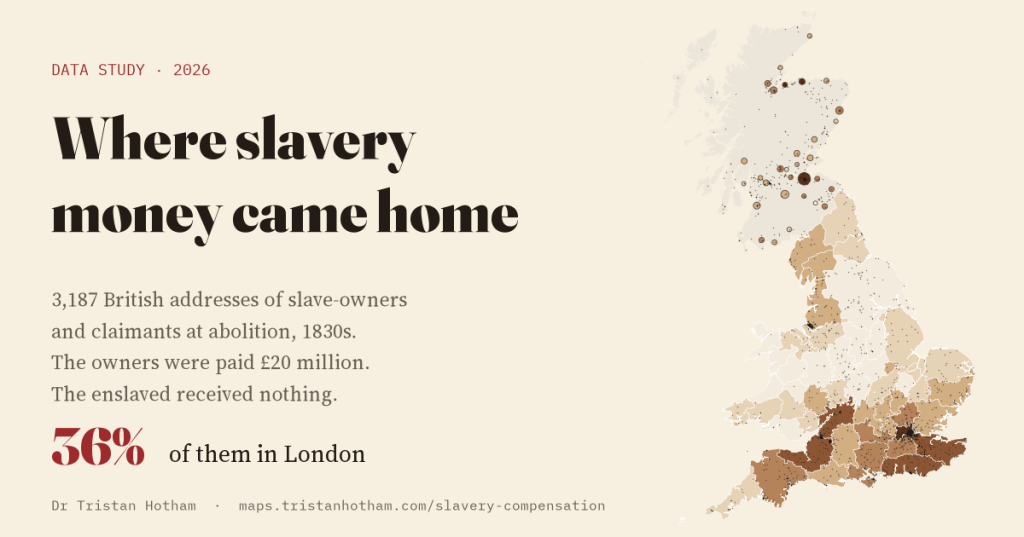
When Britain abolished slavery in its colonies in the 1830s, it paid £20 million in compensation. The money went to the slave-owners. The people they had enslaved received nothing. I mapped where in Britain the owners and claimants lived, using 3,187 addresses from the Legacies of British Slavery database at UCL.
The Slavery Abolition Act of 1833 took effect on 1 August 1834. It did not set people free that day. Most were made to keep working for their former owners, unpaid, as “apprentices”, until 1838. Parliament also voted £20 million, about 40% of government spending in 1833, to compensate the owners for the loss of what the law called their property. As the History of Parliament puts it, “the formerly enslaved population received no compensation.”
The records of the commission that paid the money list who owned enslaved people at abolition and who claimed. For years, historians at University College London have traced those people into British life: their families, businesses, houses and addresses. The result is the Legacies of British Slavery database, and one of its tools is a map of the addresses. The team are careful about what it is: “This map is a search tool and a general guide. More work is needed to produce data for statistical analysis.” So I treat it as a map of a database, not a census. Only the addresses they have located are here, about 61% of those in their county table, and an address is somewhere a person lived at some point, not necessarily in 1834. I never use the names.
London, then the ports and the spa towns
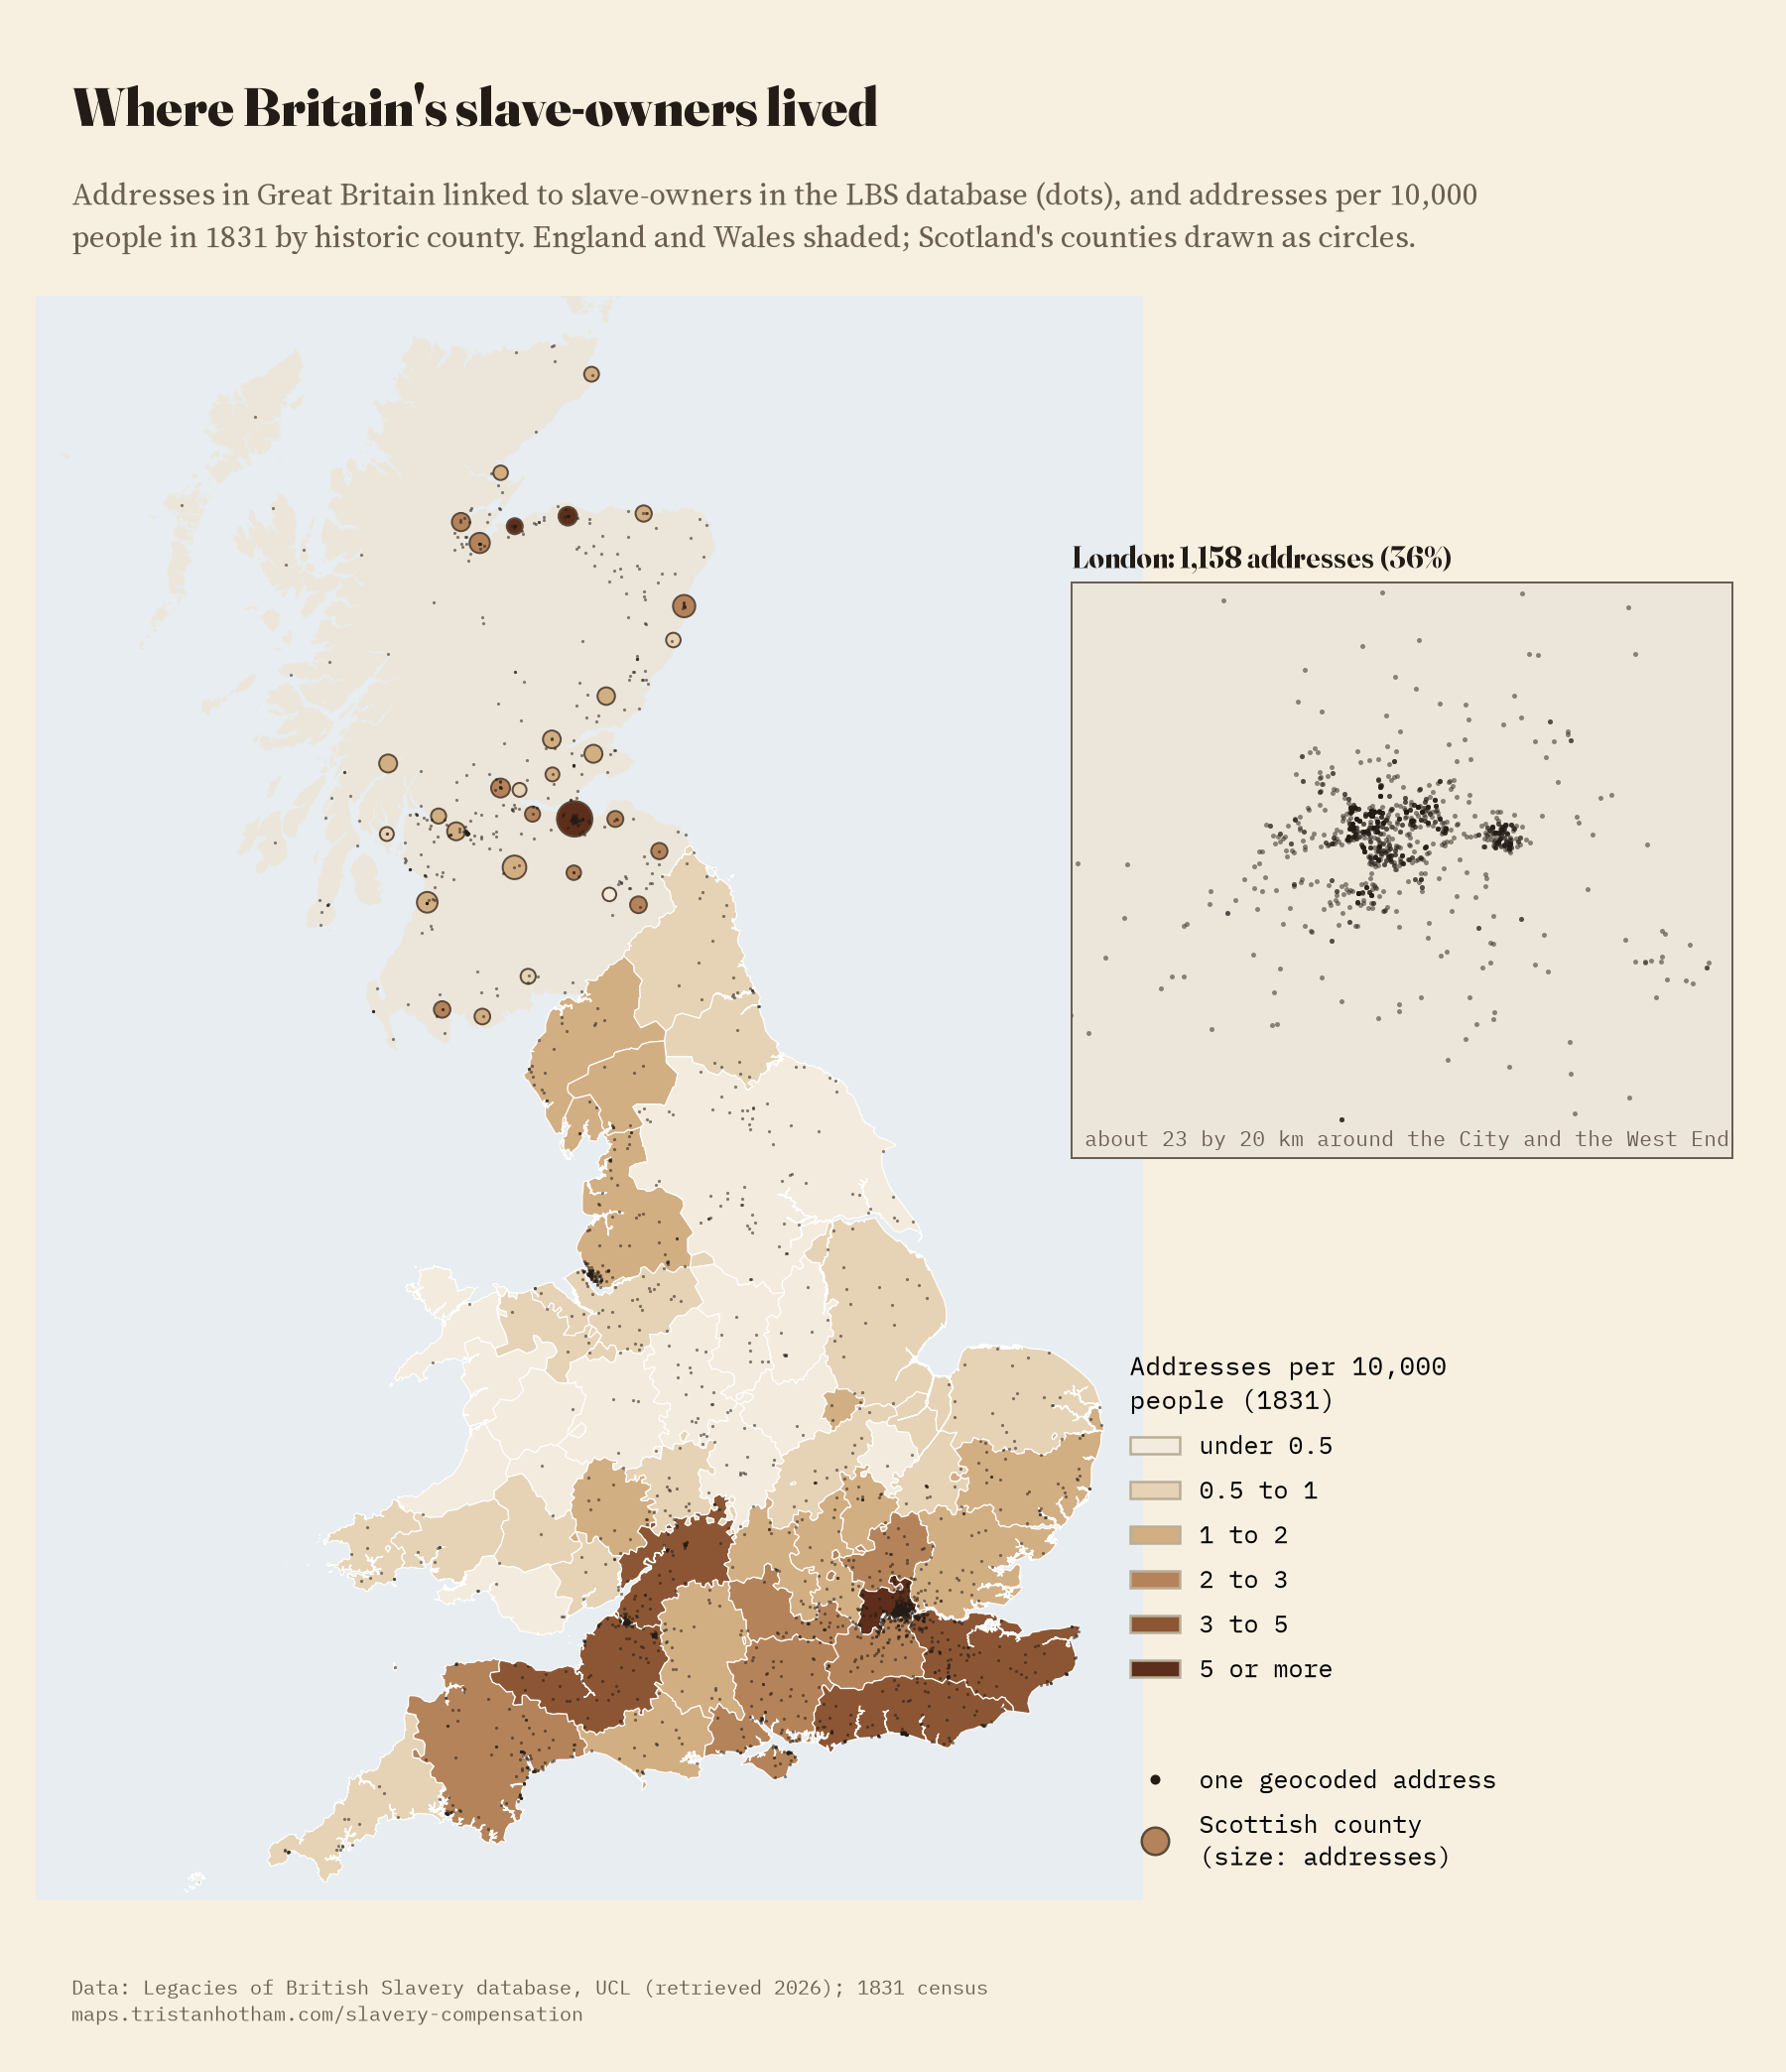
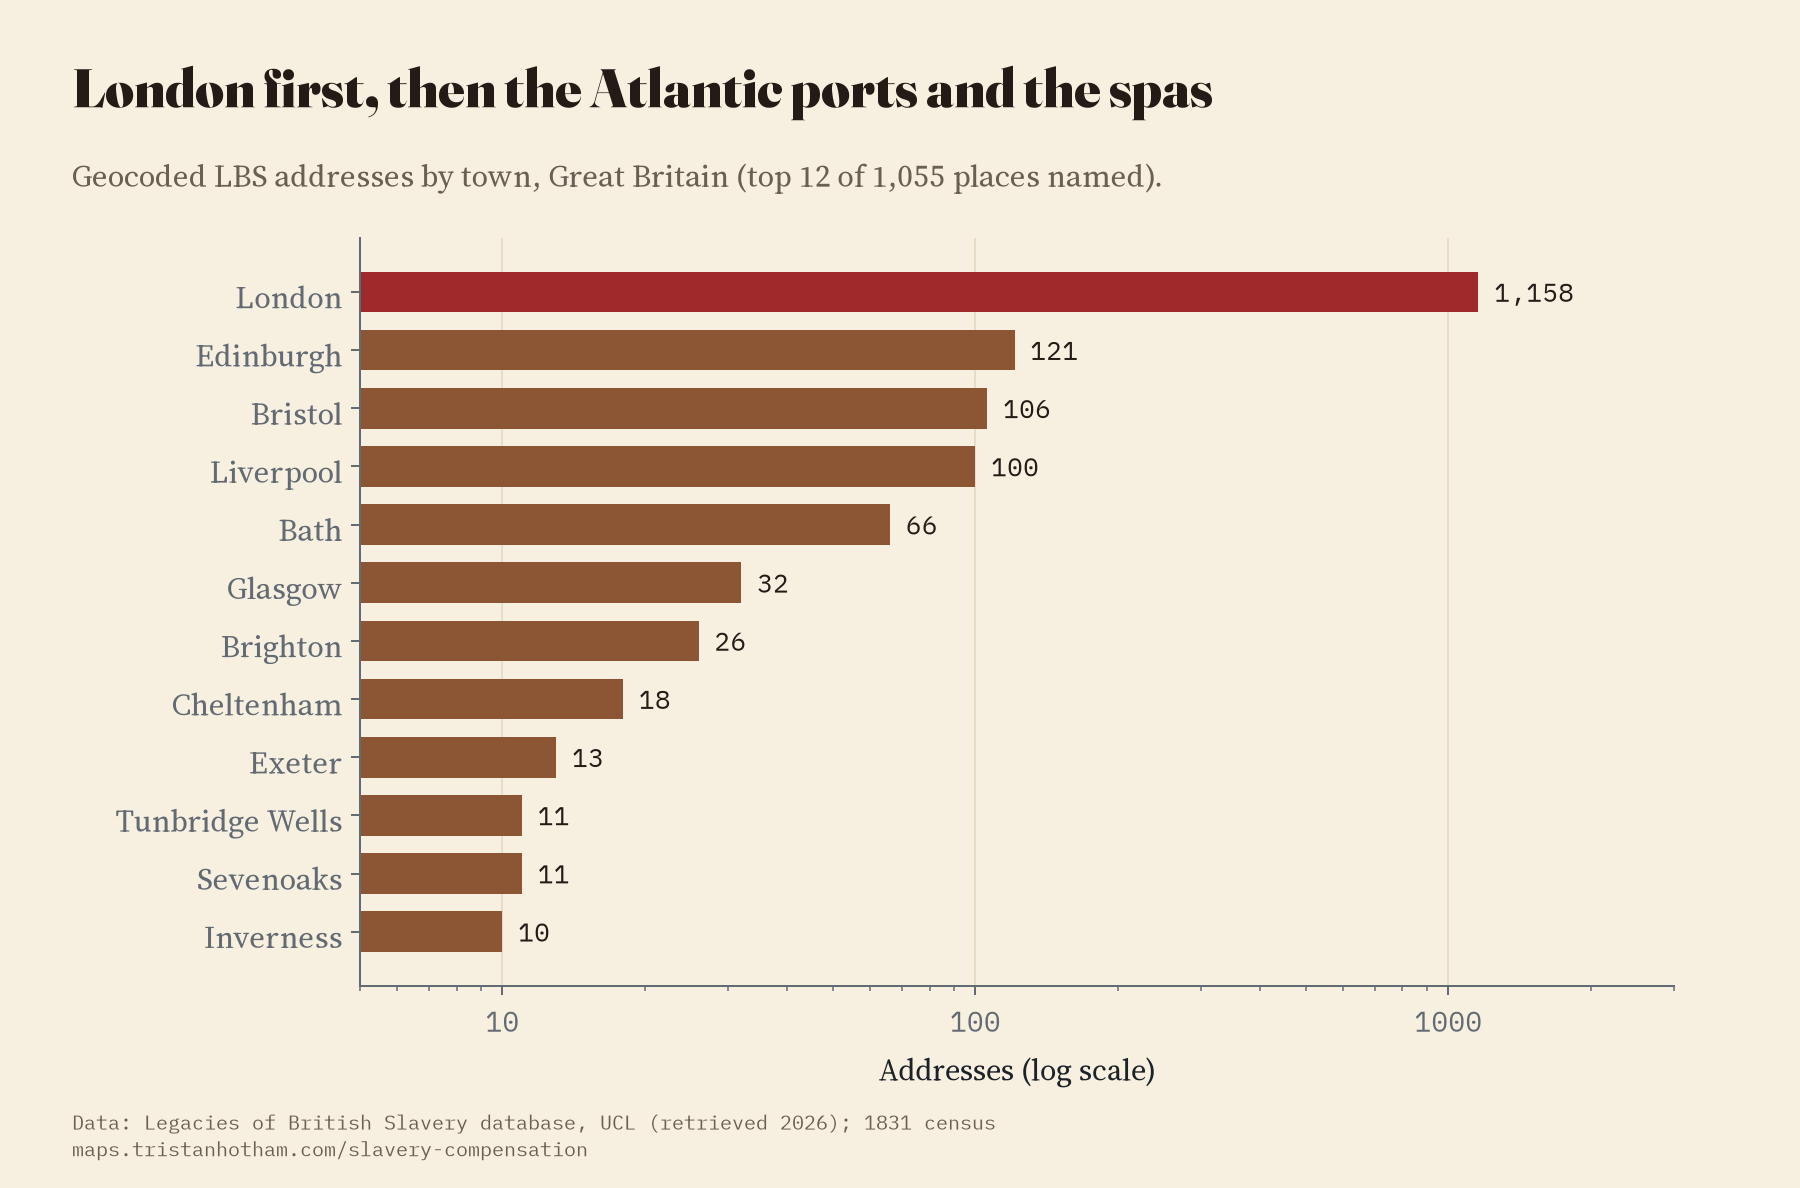
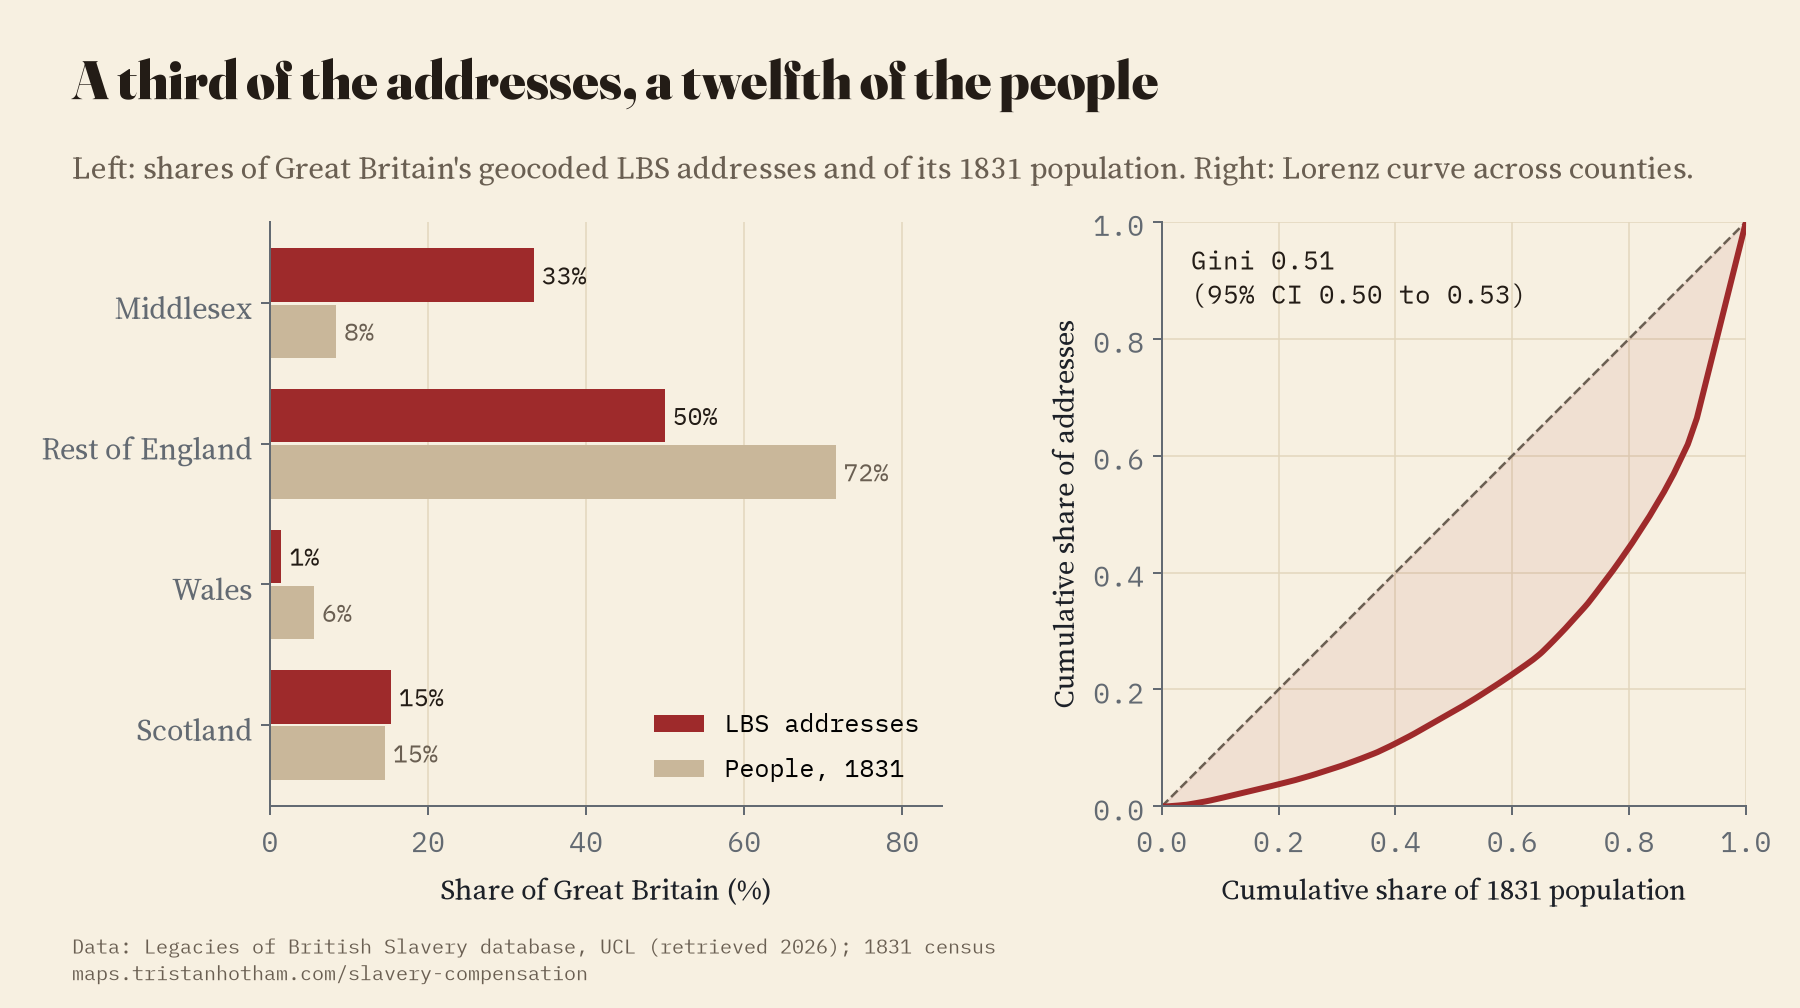
Of the 3,187 addresses in Great Britain, 1,158 are in London: 36%. Middlesex alone, where most of London stood, has 33% of the addresses and had 8% of the people in 1831. After London come Edinburgh (121), Bristol (106), Liverpool (100) and Bath (66), then Glasgow, Brighton and Cheltenham. It is a list of capitals, Atlantic ports and resort towns.
Per head
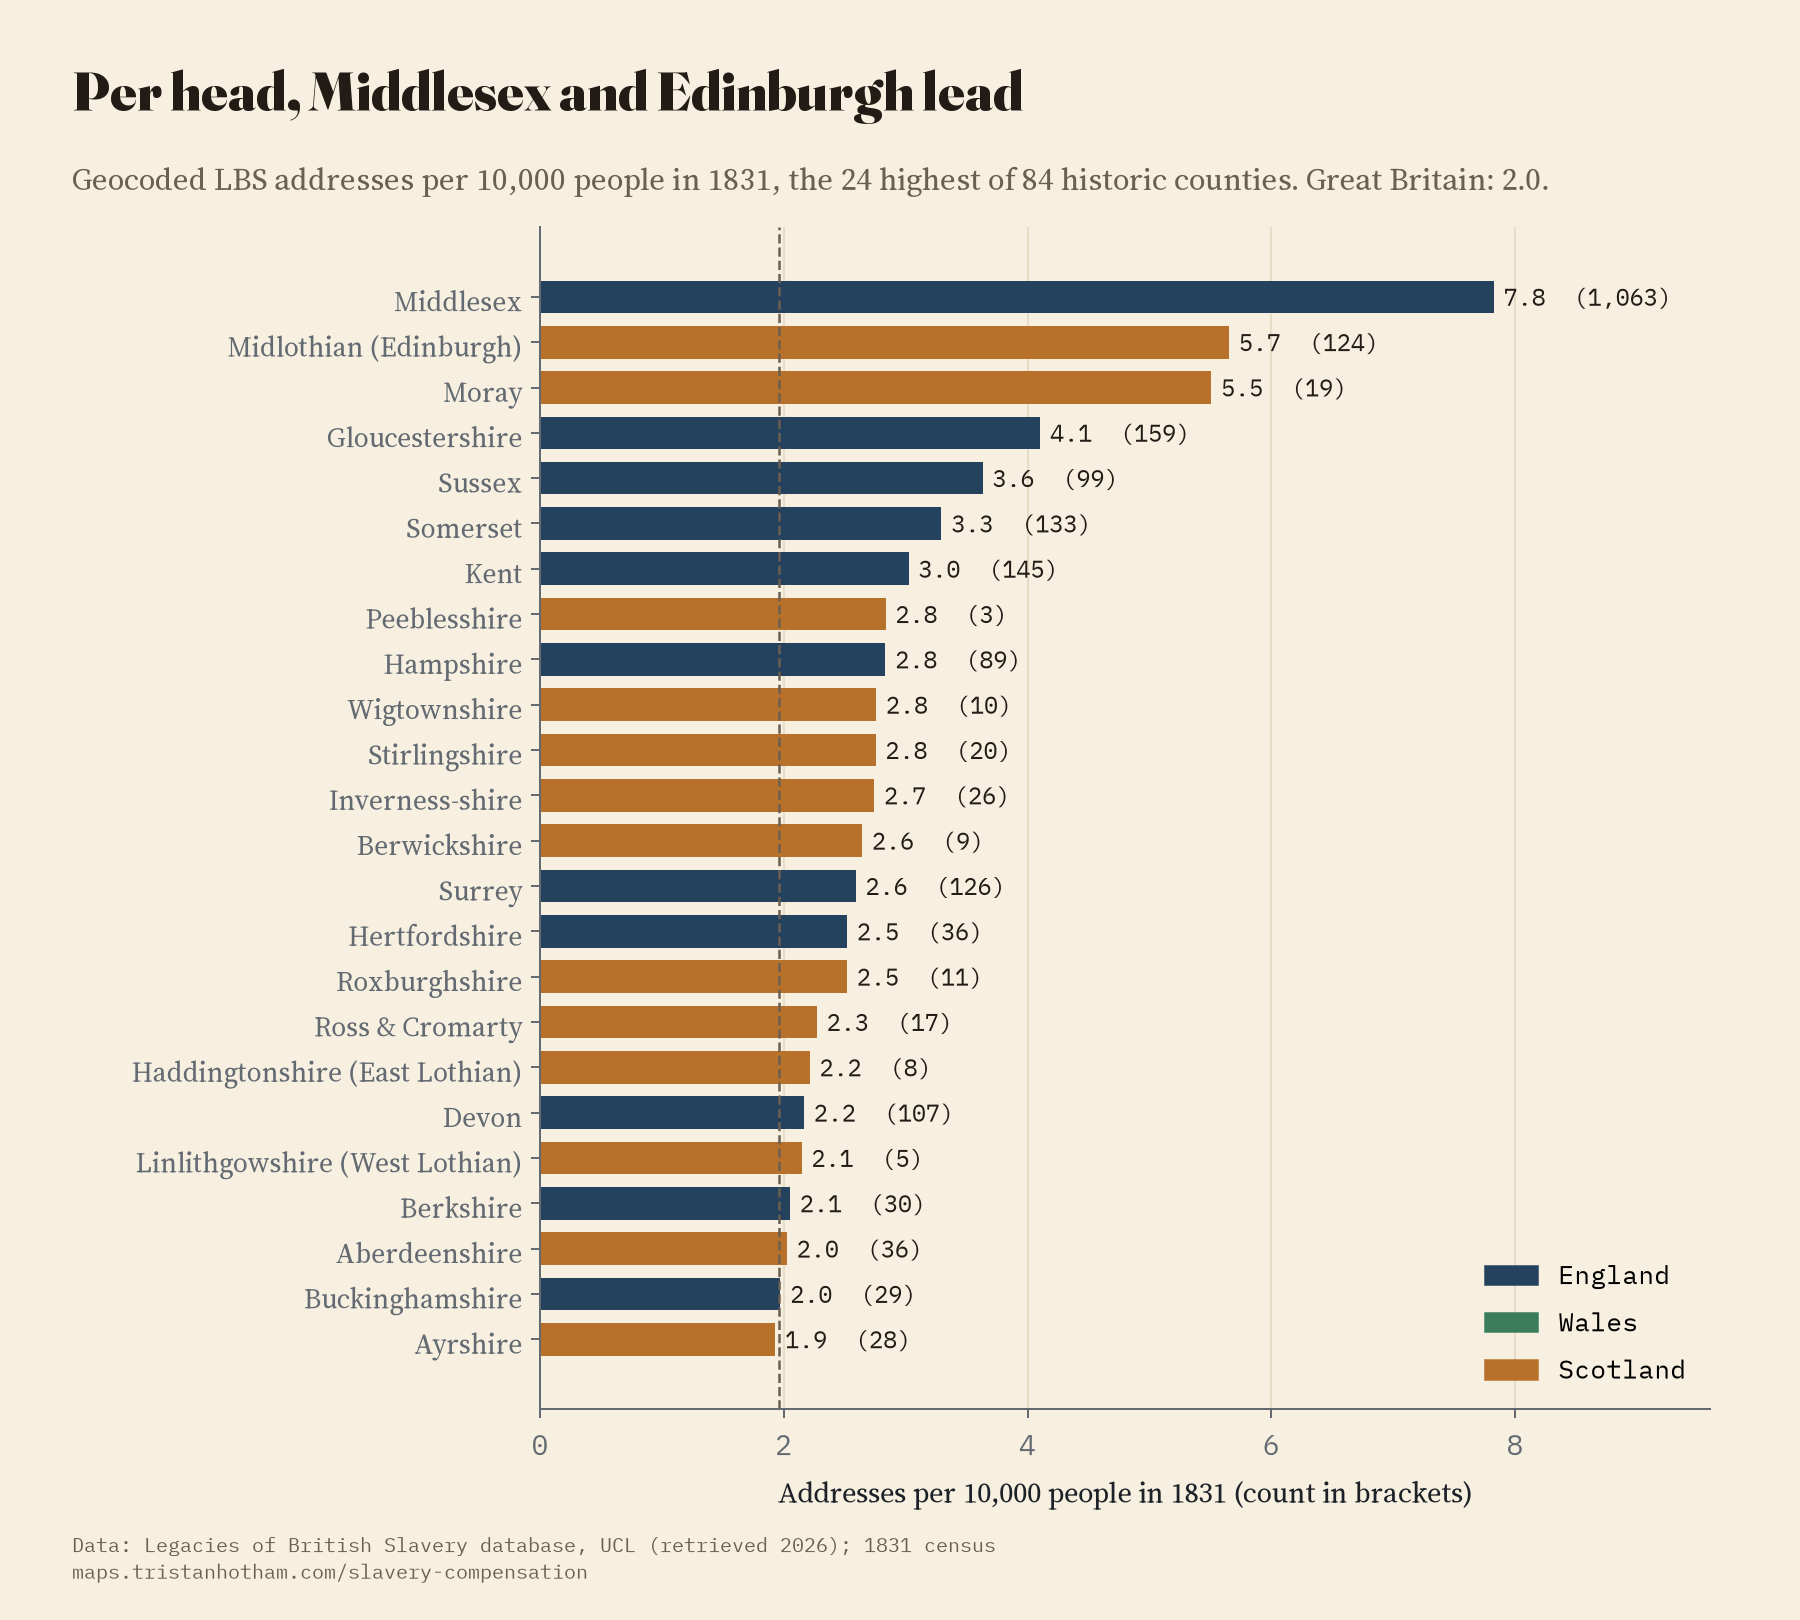
Across Great Britain there are 2.0 located addresses for every 10,000 people in 1831. Among counties with at least 10,000 people, Middlesex has 7.8, Midlothian, which is Edinburgh, 5.7 and Moray 5.5, then Gloucestershire, with Bristol and Cheltenham, and Sussex, Somerset and Kent. Scotland as a whole (2.1) matches England (2.0), which fits a lot of recent work on Scotland’s part in Caribbean slavery. Wales is far lower (0.5). The big industrial counties are low too: Lancashire, with Liverpool in it, has 1.1, because so many other people lived there.
The records were made to value property and pay its owners. A map of their addresses shows where one side of that relationship lived. It does not measure the harm done.
A pull towards London
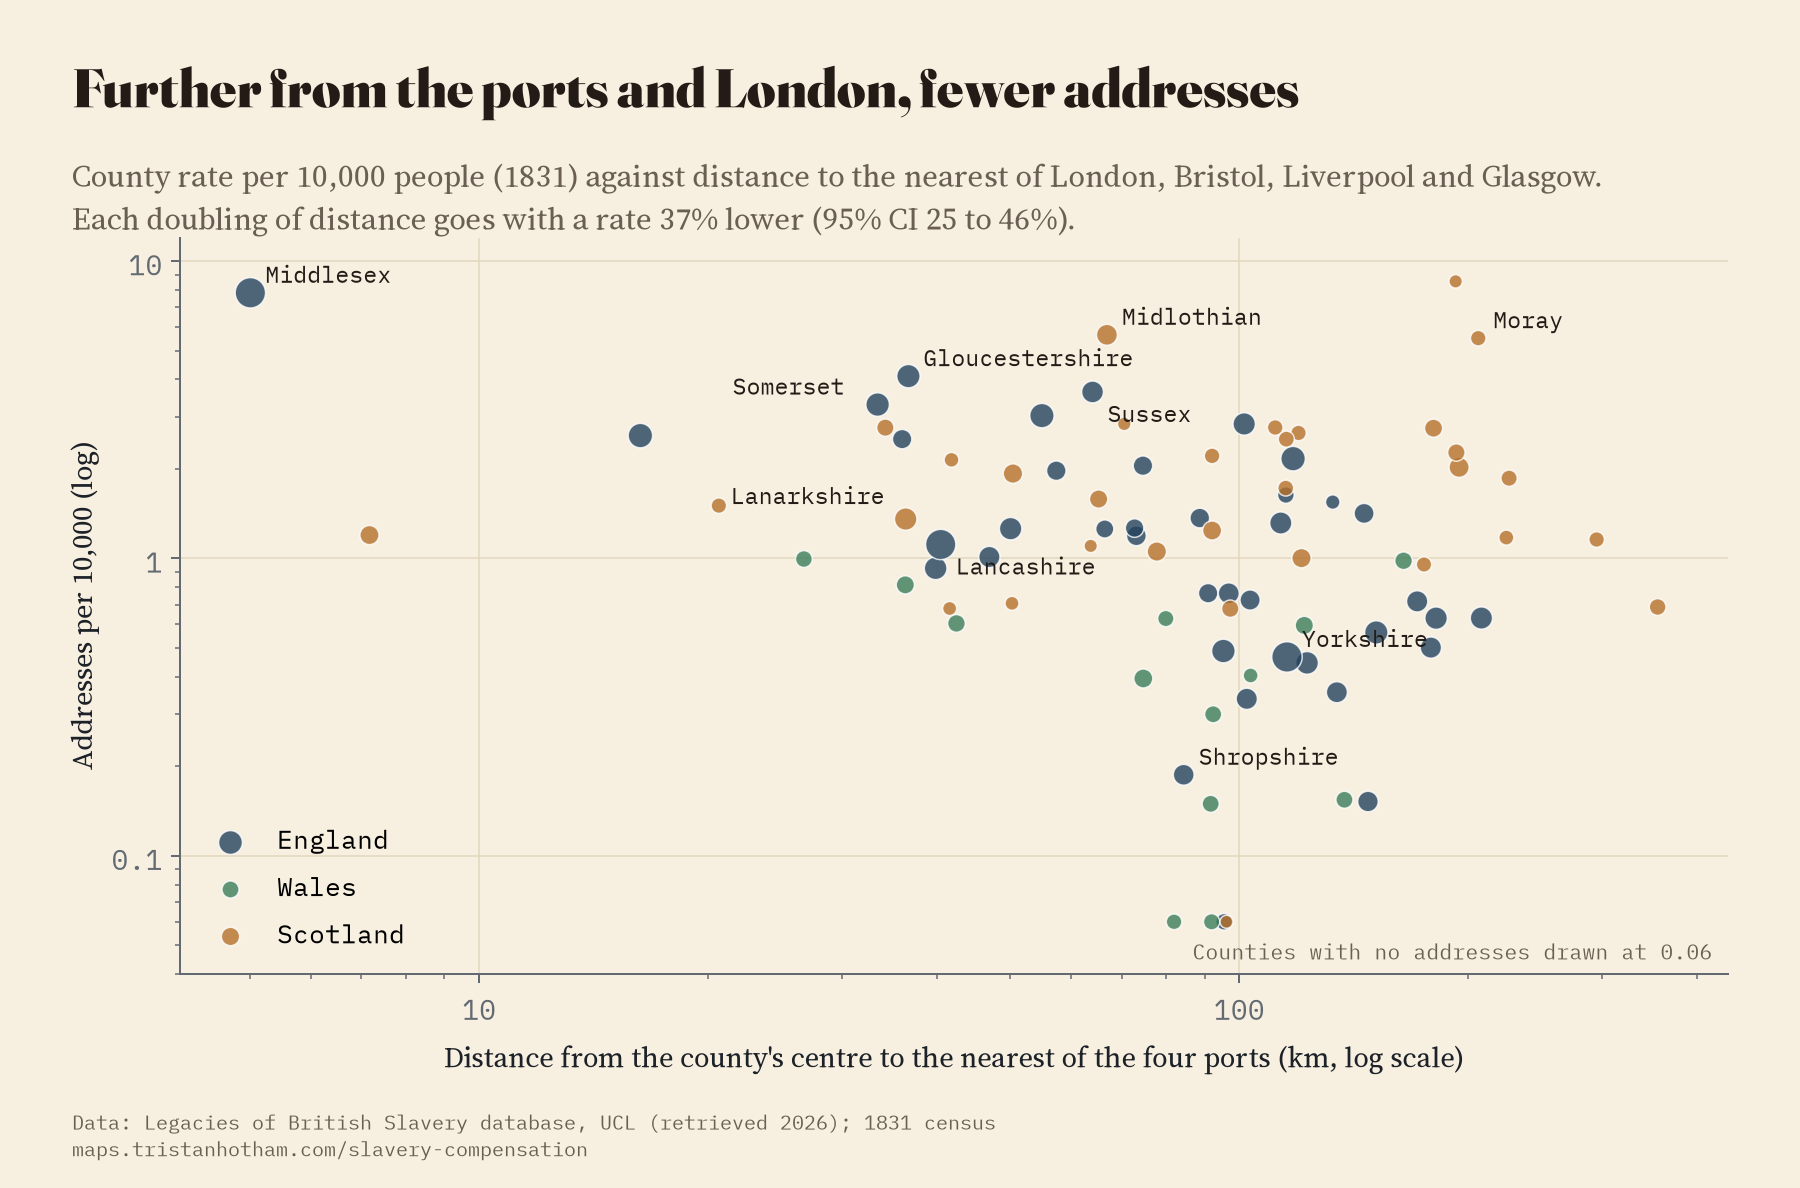
Before running anything I wrote down one test: are there more addresses per head in counties close to the four great West India ports of the time, London, Bristol, Liverpool and Glasgow? There are. Each doubling of the distance from the nearest port goes with 37% fewer addresses per head (the 95% range is 25 to 46%). But the details matter. Distance to London on its own fits better than distance to the nearest port. The pattern loses its certainty when the South-East is left out. And it is carried by town addresses: named country houses show no such pattern, and neither do today’s grandest listed houses, which I used as a rough stand-in for old landed wealth. So this is mostly a pull towards London, not a simple map of the trade.
Town houses and country seats
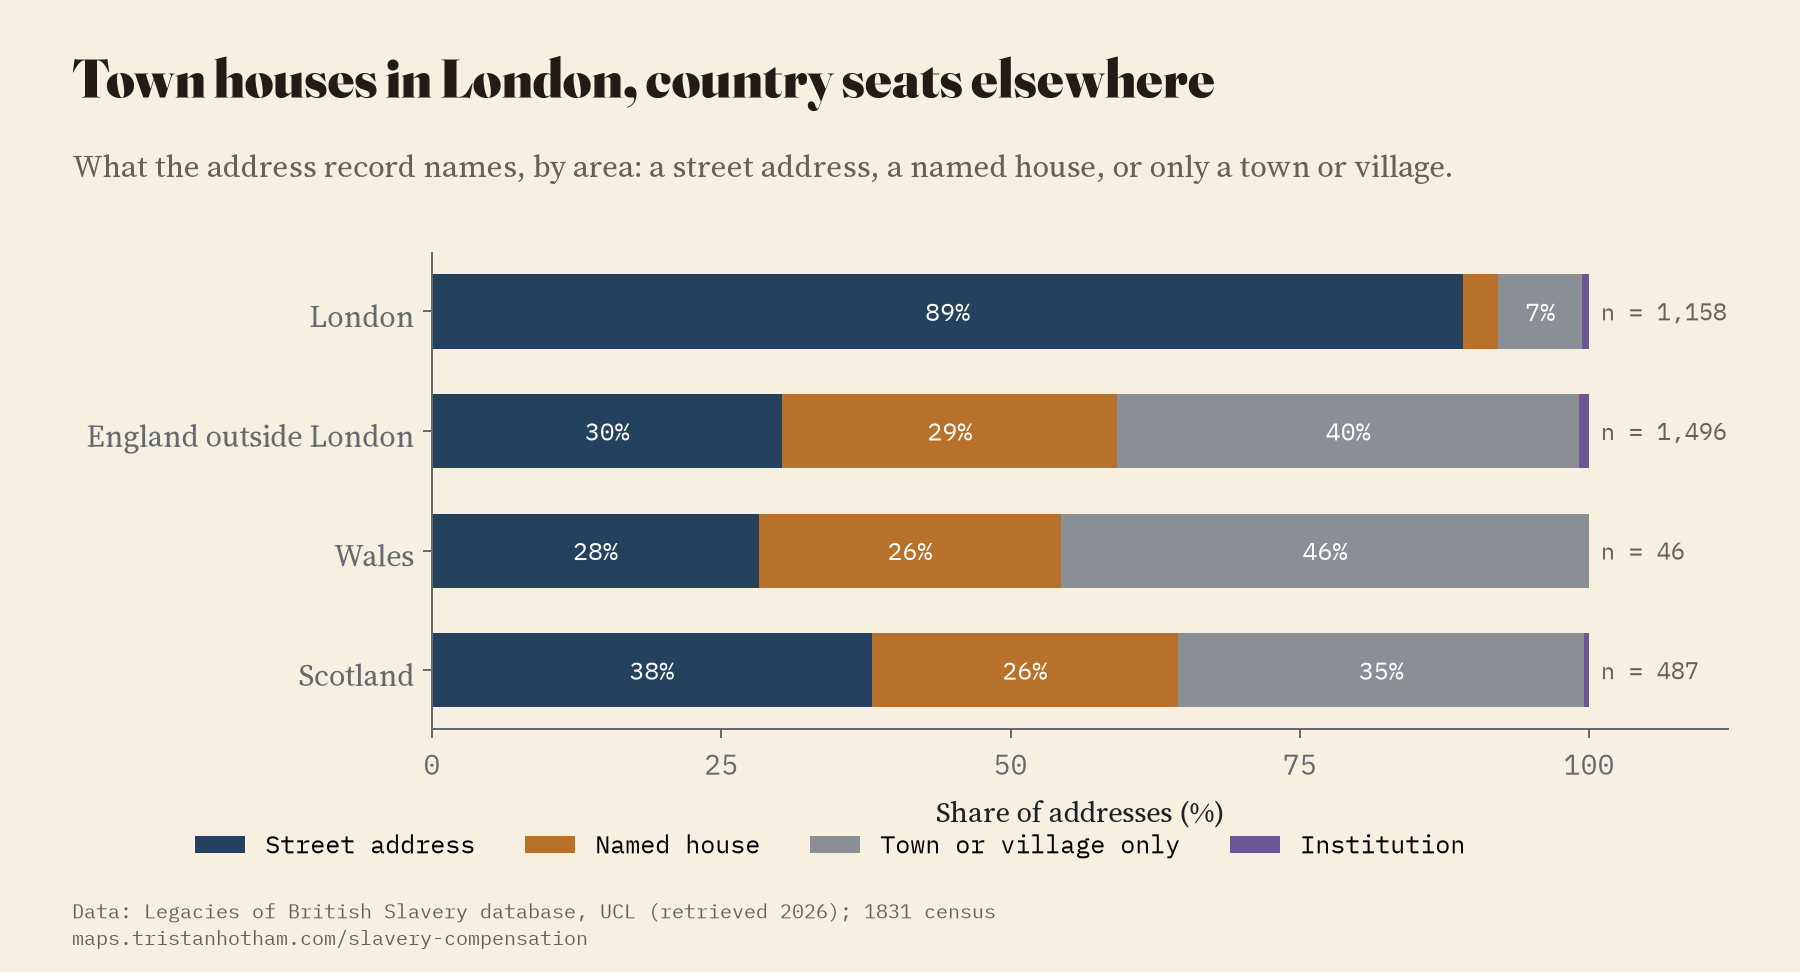
In London, 89% of the addresses are a number in a square, a street or a terrace. Outside London only 32% are. Another 28% are named houses, the Halls, Parks and Castles, and 39% name only a town or village.
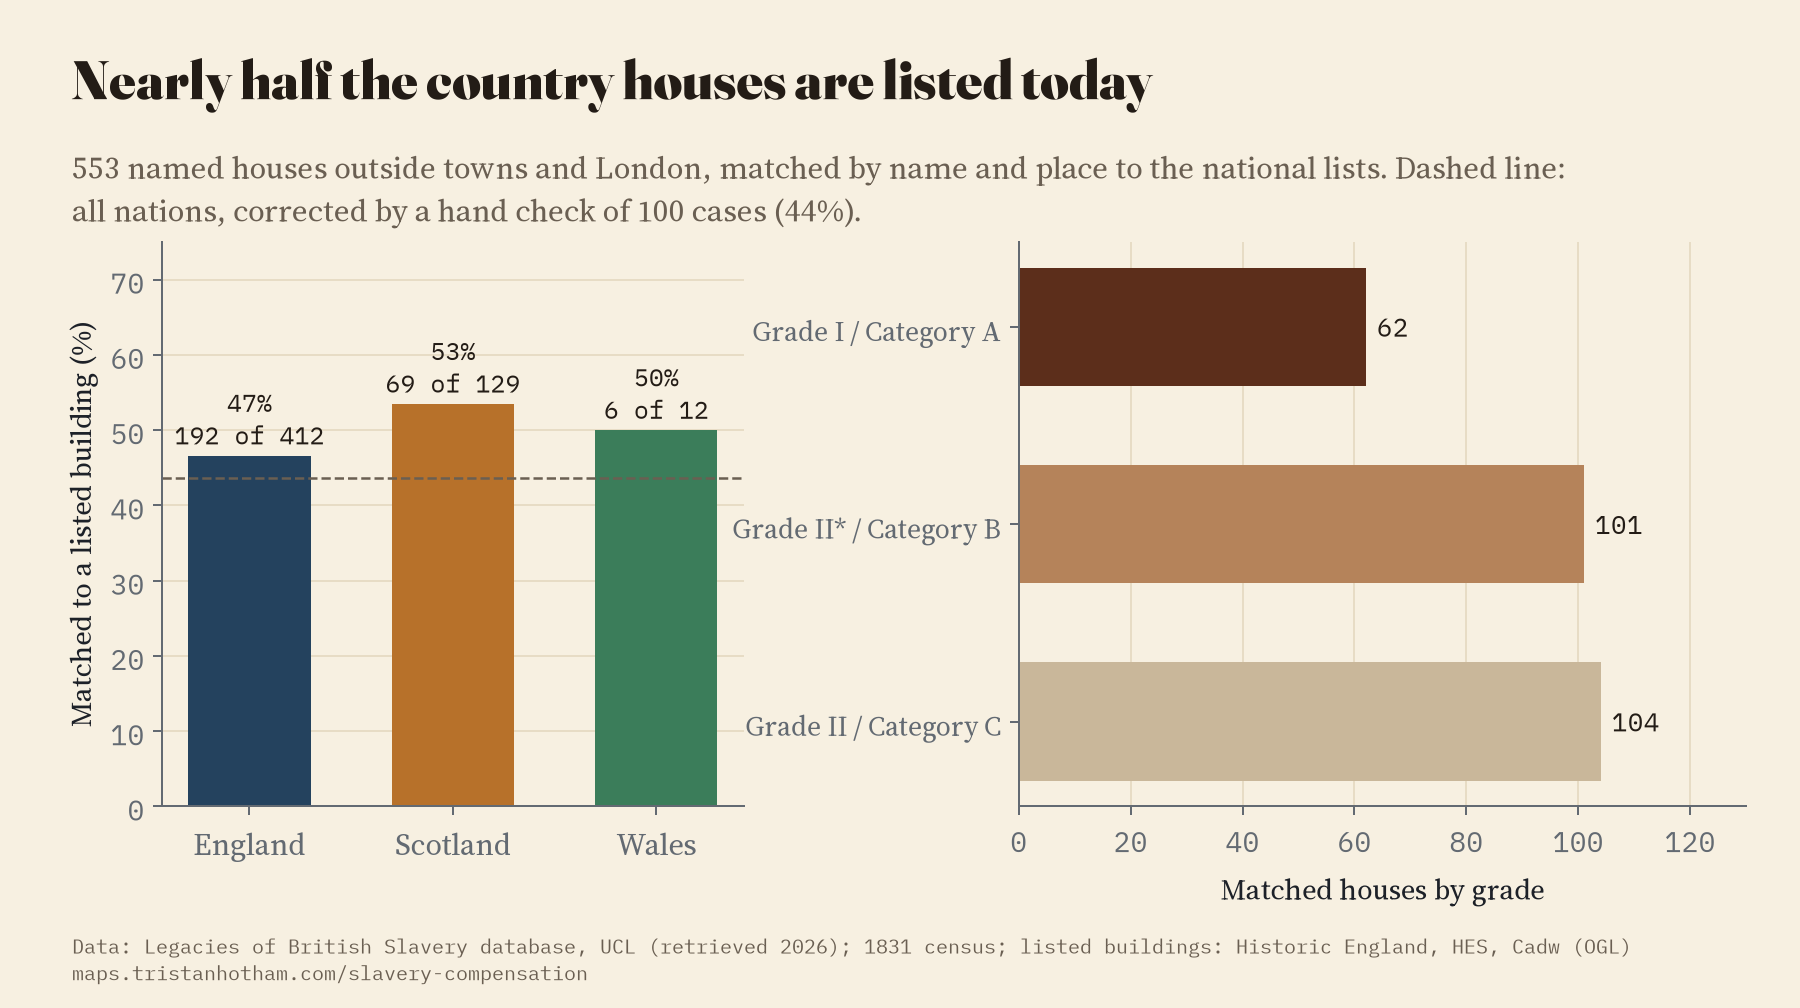
I took the 553 named houses outside London and the towns and looked for each one on today’s national lists of listed buildings, by name and place. 267 matched. I then read 100 cases by hand to see how often the matching was right, and the best estimate is that about 44% of these country houses are listed buildings today. 62 of the matches are in the top grade. The others were demolished, were never listed, or could not be matched by name. A match is a starting point for a local historian, not a verdict on a building.
How I did this
The addresses come from the file behind the Legacies of British Slavery map: each address’s place, town and county and how many people in the database are linked to it. I counted people and never used their names; on the interactive map each dot links to a record at UCL for one of the people linked to it. I matched the counties to those of the 1831 census and divided by the census population. I sorted each address into a street address, a named house or a town or village only from its text. For listed buildings I used the national lists for England, Scotland and Wales. The analysis was pre-specified in a written plan before I computed any results, and the paper reports every check, including the ones that weakened the result.
What this cannot tell you: how much money anyone received, because the address file has no amounts; where people lived in any one year; or anything about the people who were enslaved, who appear in these records mostly as numbers and valuations. The located share of addresses varies from county to county, though not in a way that lines up with the results. And about a third of the addresses are placed only at a town, village or parish.
Notes and sources
- Legacies of British Slavery database, Centre for the Study of the Legacies of British Slavery, UCL (ucl.ac.uk/lbs), map address data retrieved 2026. Only counts and unnamed points are reproduced.
- Population: Census of Great Britain, 1851, Population Tables I (county totals for 1831). Listed buildings: Historic England, Historic Environment Scotland and Cadw (Open Government Licence), via my earlier study The Listed Kingdom.
- Context: J. Baker, “1833 Slavery Abolition Act”, History of Parliament (2024); N. Draper, The Price of Emancipation (2010); C. Hall and others, Legacies of British Slave-ownership (2014); M. Dresser and A. Hann (eds), Slavery and the British Country House (2013); S. Mullen, The Glasgow Sugar Aristocracy (2022).
- County outlines rebuilt from the 1851 parishes in Caprettini and Voth’s replication data (CC BY 4.0). Base map: OpenFreeMap, OpenStreetMap contributors (ODbL).
- I wrote the text, with drafting and editing assistance from Claude (Anthropic), which also helped prepare the analysis code. I reviewed and checked all text and results.

