
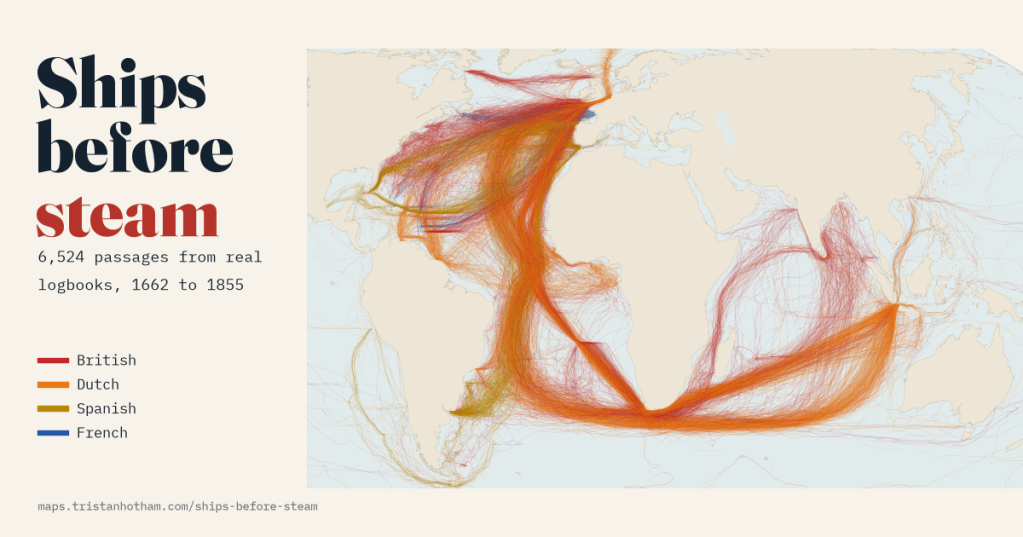
Before engines, a ship went where the wind let it. Officers wrote down their position and the wind every single day, and a European project typed up more than a quarter of a million of those entries. Drawn as lines, they show the hidden highways of the age of sail.
Every day at noon, on every ocean-going European ship of the eighteenth century, an officer opened the logbook and wrote down where the ship was, which way it was heading and how the wind blew. The wind mattered for navigation: it pushed the ship sideways off its course, and without satellites or reliable clocks the officers needed every clue to know where they were. Thousands of these logbooks survive in archives in London, The Hague, Seville, Madrid and Paris.
Between 2001 and 2003 a European project called CLIWOC, the Climatological Database for the World’s Oceans, went through 1,740 of them and typed up 260,631 daily entries, mainly so that climate scientists could see what the weather was like before thermometers went to sea. But the same entries also say exactly where the ships were. So I drew them: 6,524 passages from 1,973 British, Dutch, Spanish and French logbook records, from 1662 to 1855.
Out by Africa, home by the Azores
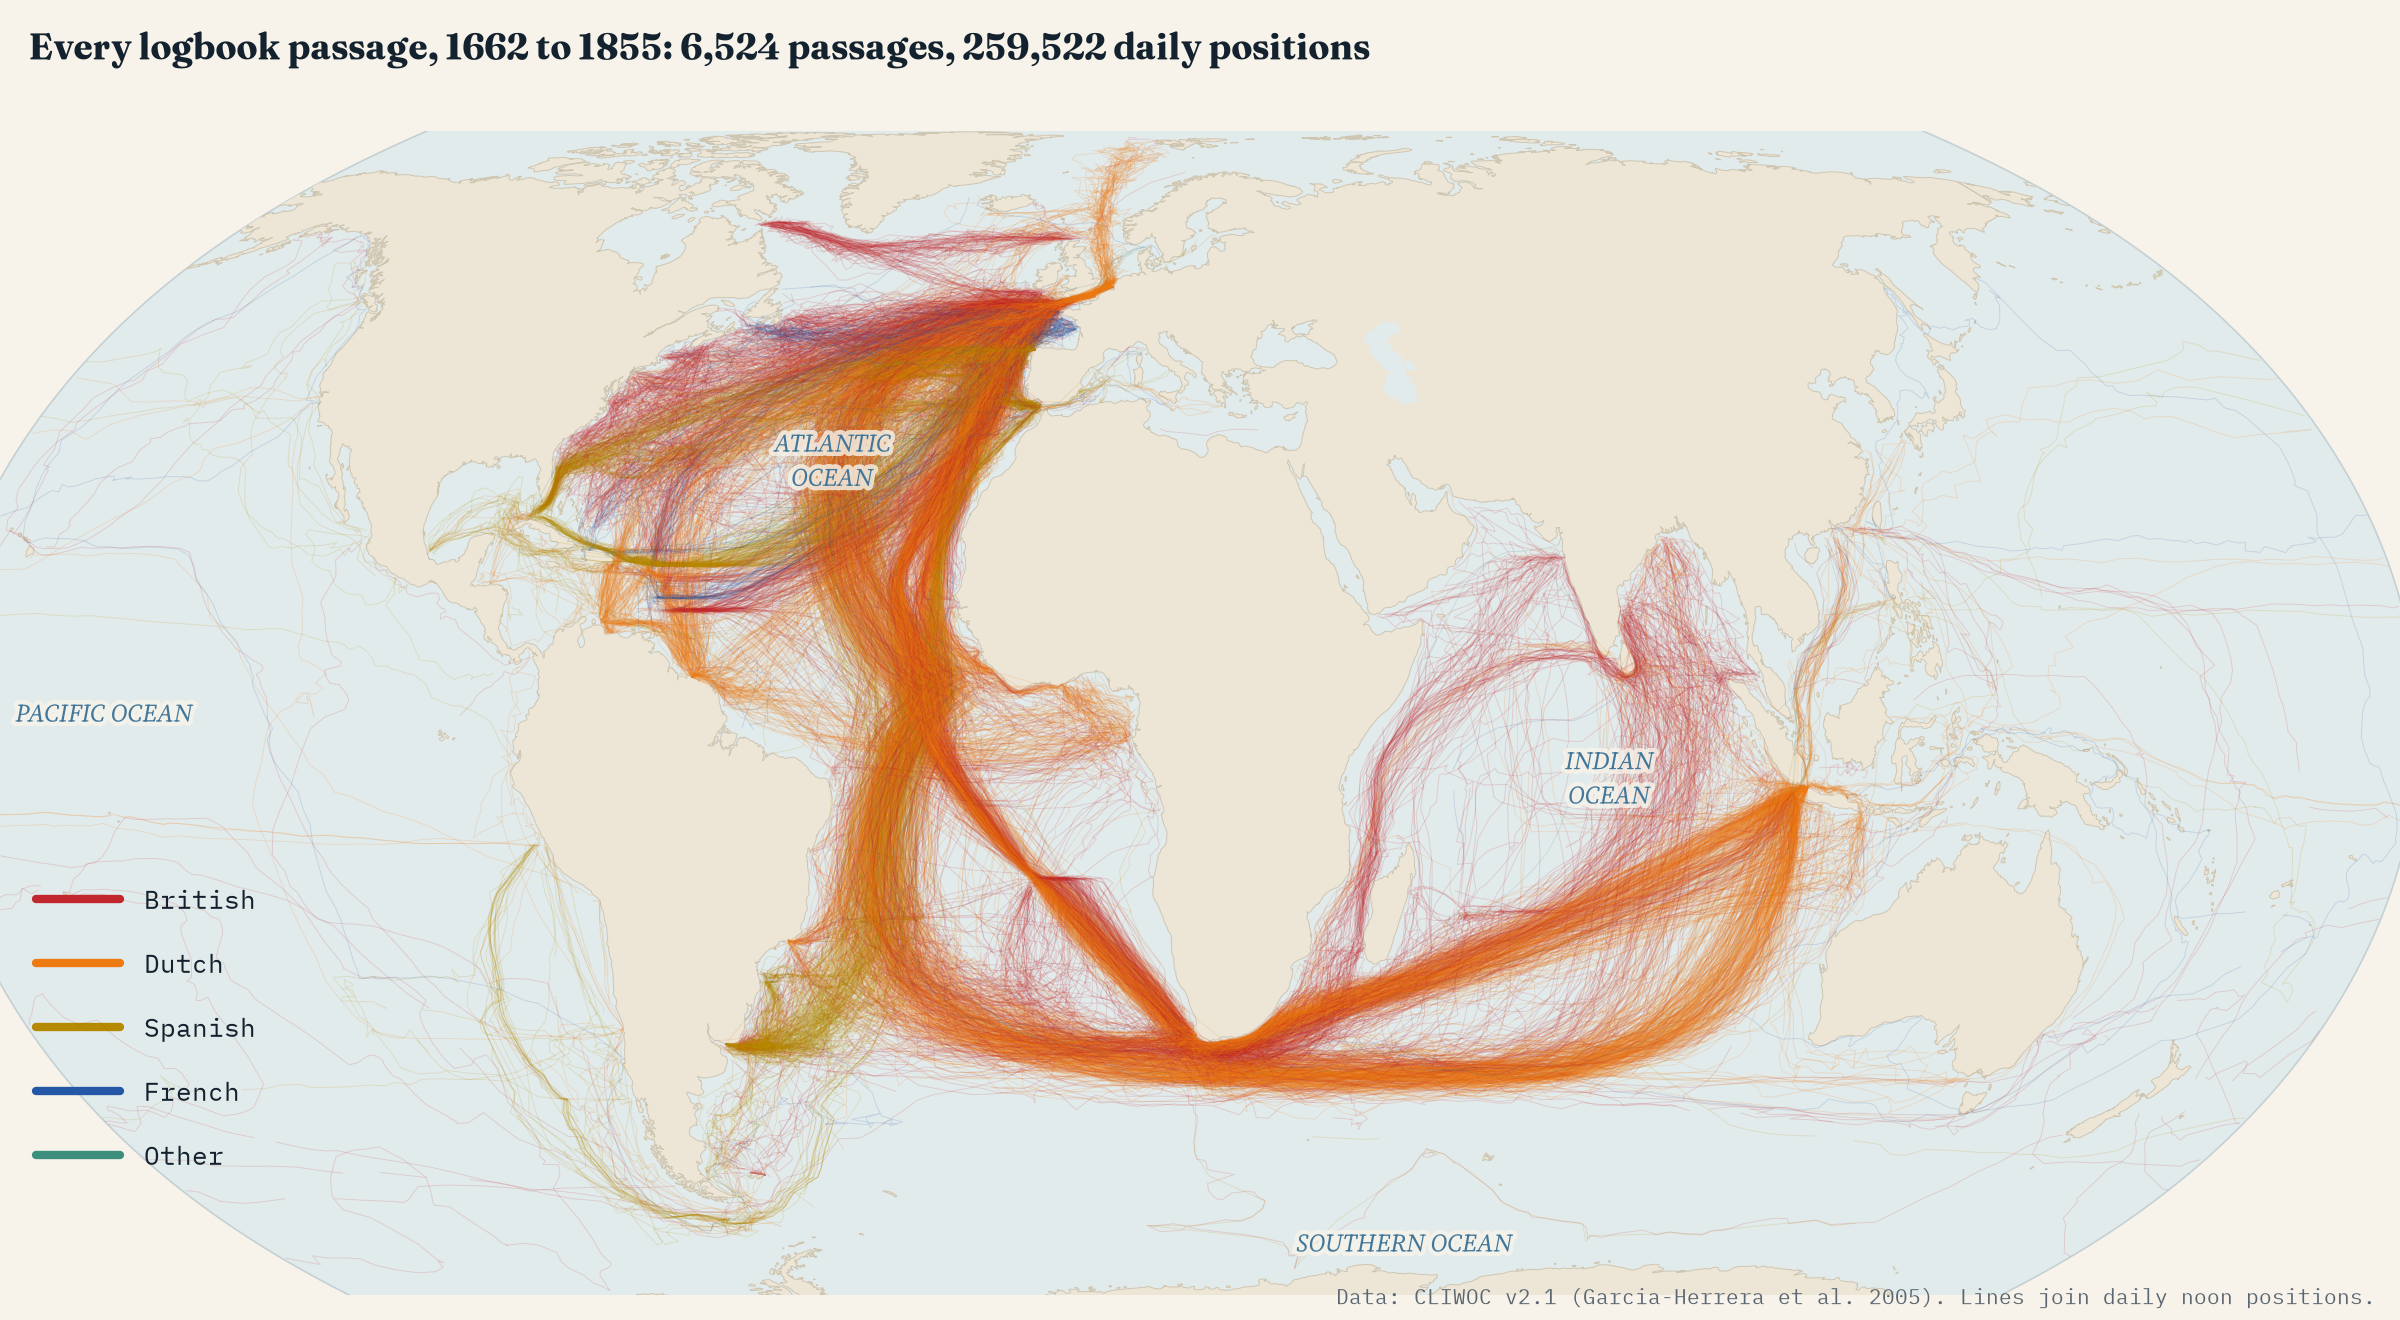
The first thing the map shows is that ships did not come back the way they went. Going south from Europe, they ran down past Madeira and the Canaries, picked up the north-east trade winds and crossed the equator well out in the Atlantic, at a median of 23° W. Coming home they could not sail into those same trades. Instead they swung west in a great arc, the Portuguese sailors’ volta do mar, the “turn of the sea”, until they found the westerlies near the Azores and ran home before them.
The logbooks measure it neatly. Ships sailing between Europe and the South Atlantic crossed 30° N at a median of 18° W on the way out and 36° W on the way home: 18° further west, about 1,724 km at that latitude. At the latitude of the Azores, 66% of homebound ships passed within the islands’ longitudes. Only 2% of outbound ships did.
The Dutch road through the roaring forties
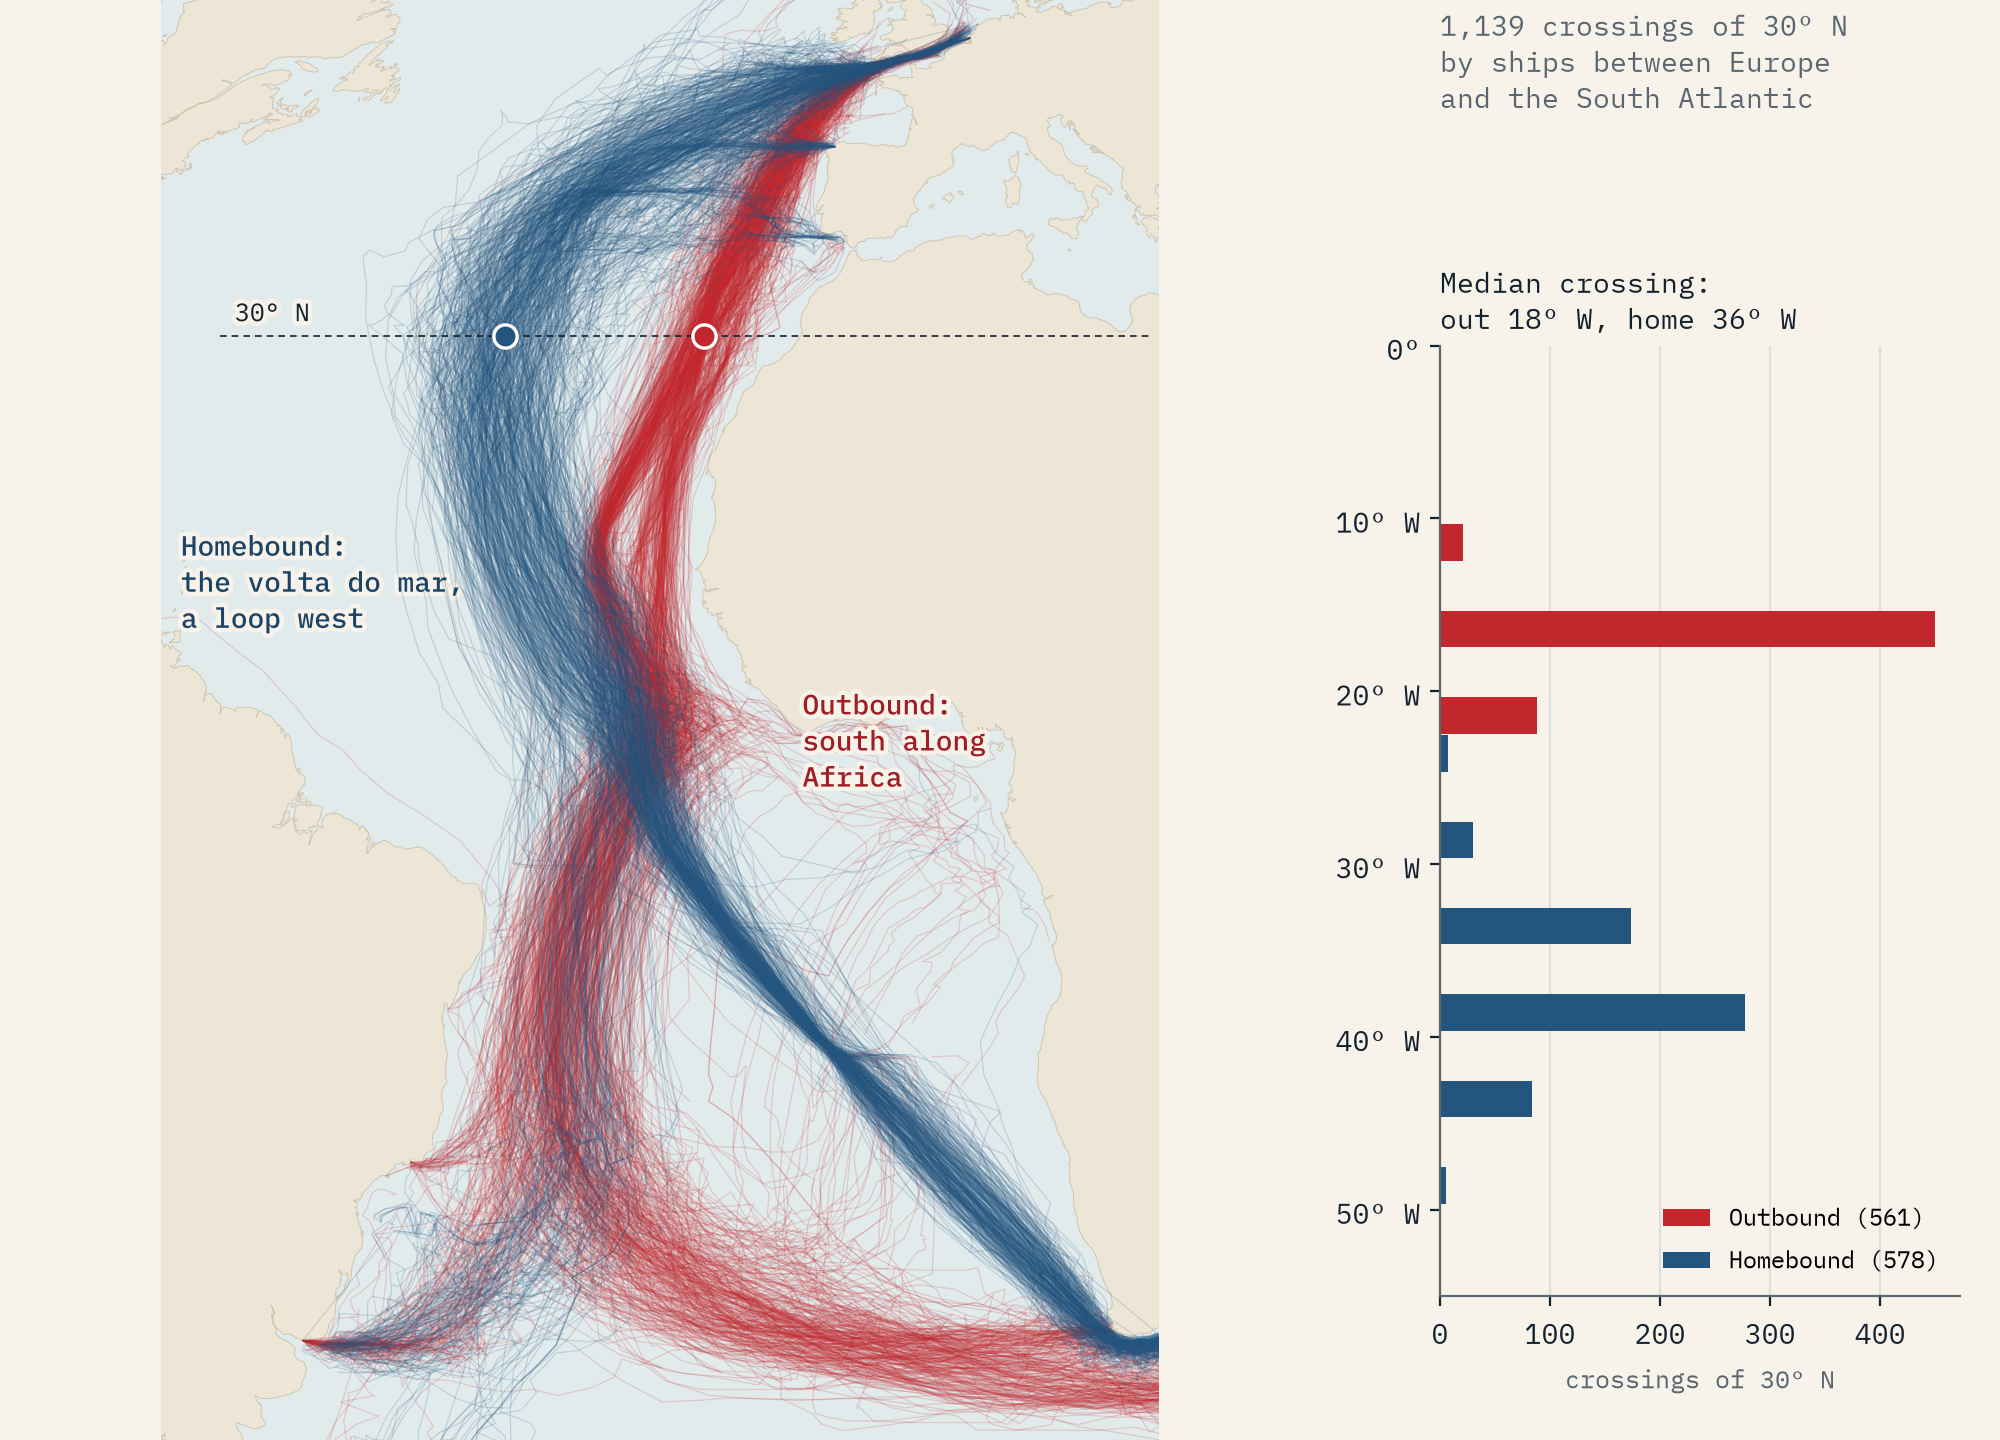
In 1611 the Dutch captain Hendrik Brouwer tried something bold. Instead of creeping up the east coast of Africa from the Cape of Good Hope, against the monsoon, he sailed south-east into the strong westerly winds near 40° S, ran east for thousands of miles and only then turned north for Java. It cut months off the voyage, and the Dutch East India Company soon made his route compulsory.
Two centuries later the logbooks show Dutch ships still doing exactly that. Of 323 Dutch crossings of 75° E heading east, the median was at 38° S, and 100% were south of 30° S. The British used the same westerlies, but many were heading for India rather than Java and turned north sooner. The logbook winds in those latitudes blow from a westerly point 70% of the time.
A hundred days to Batavia
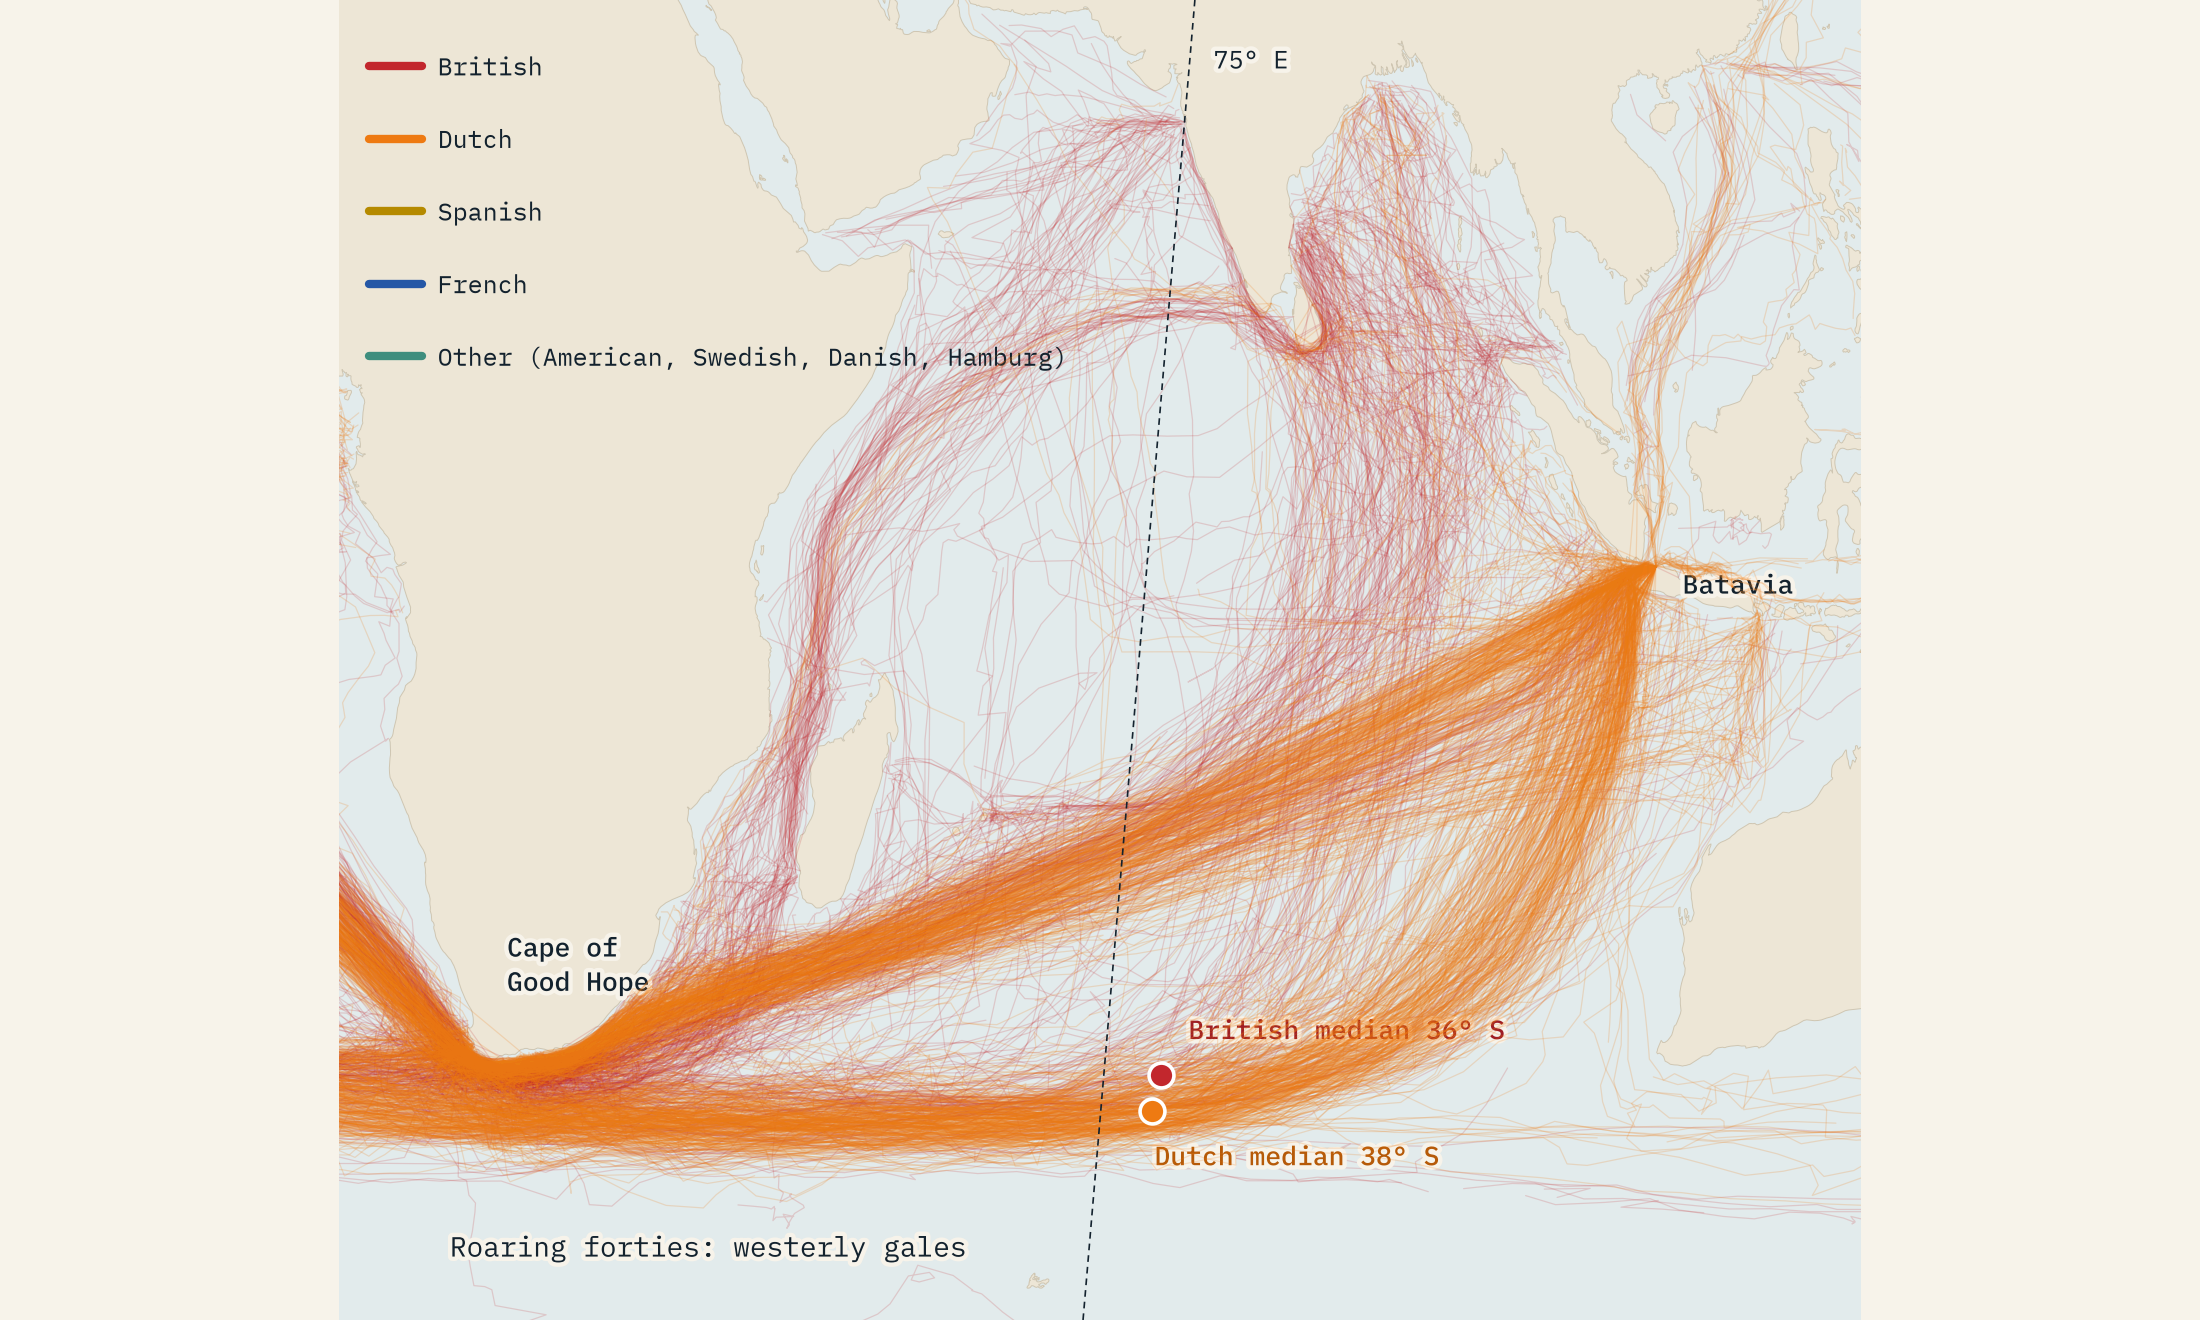
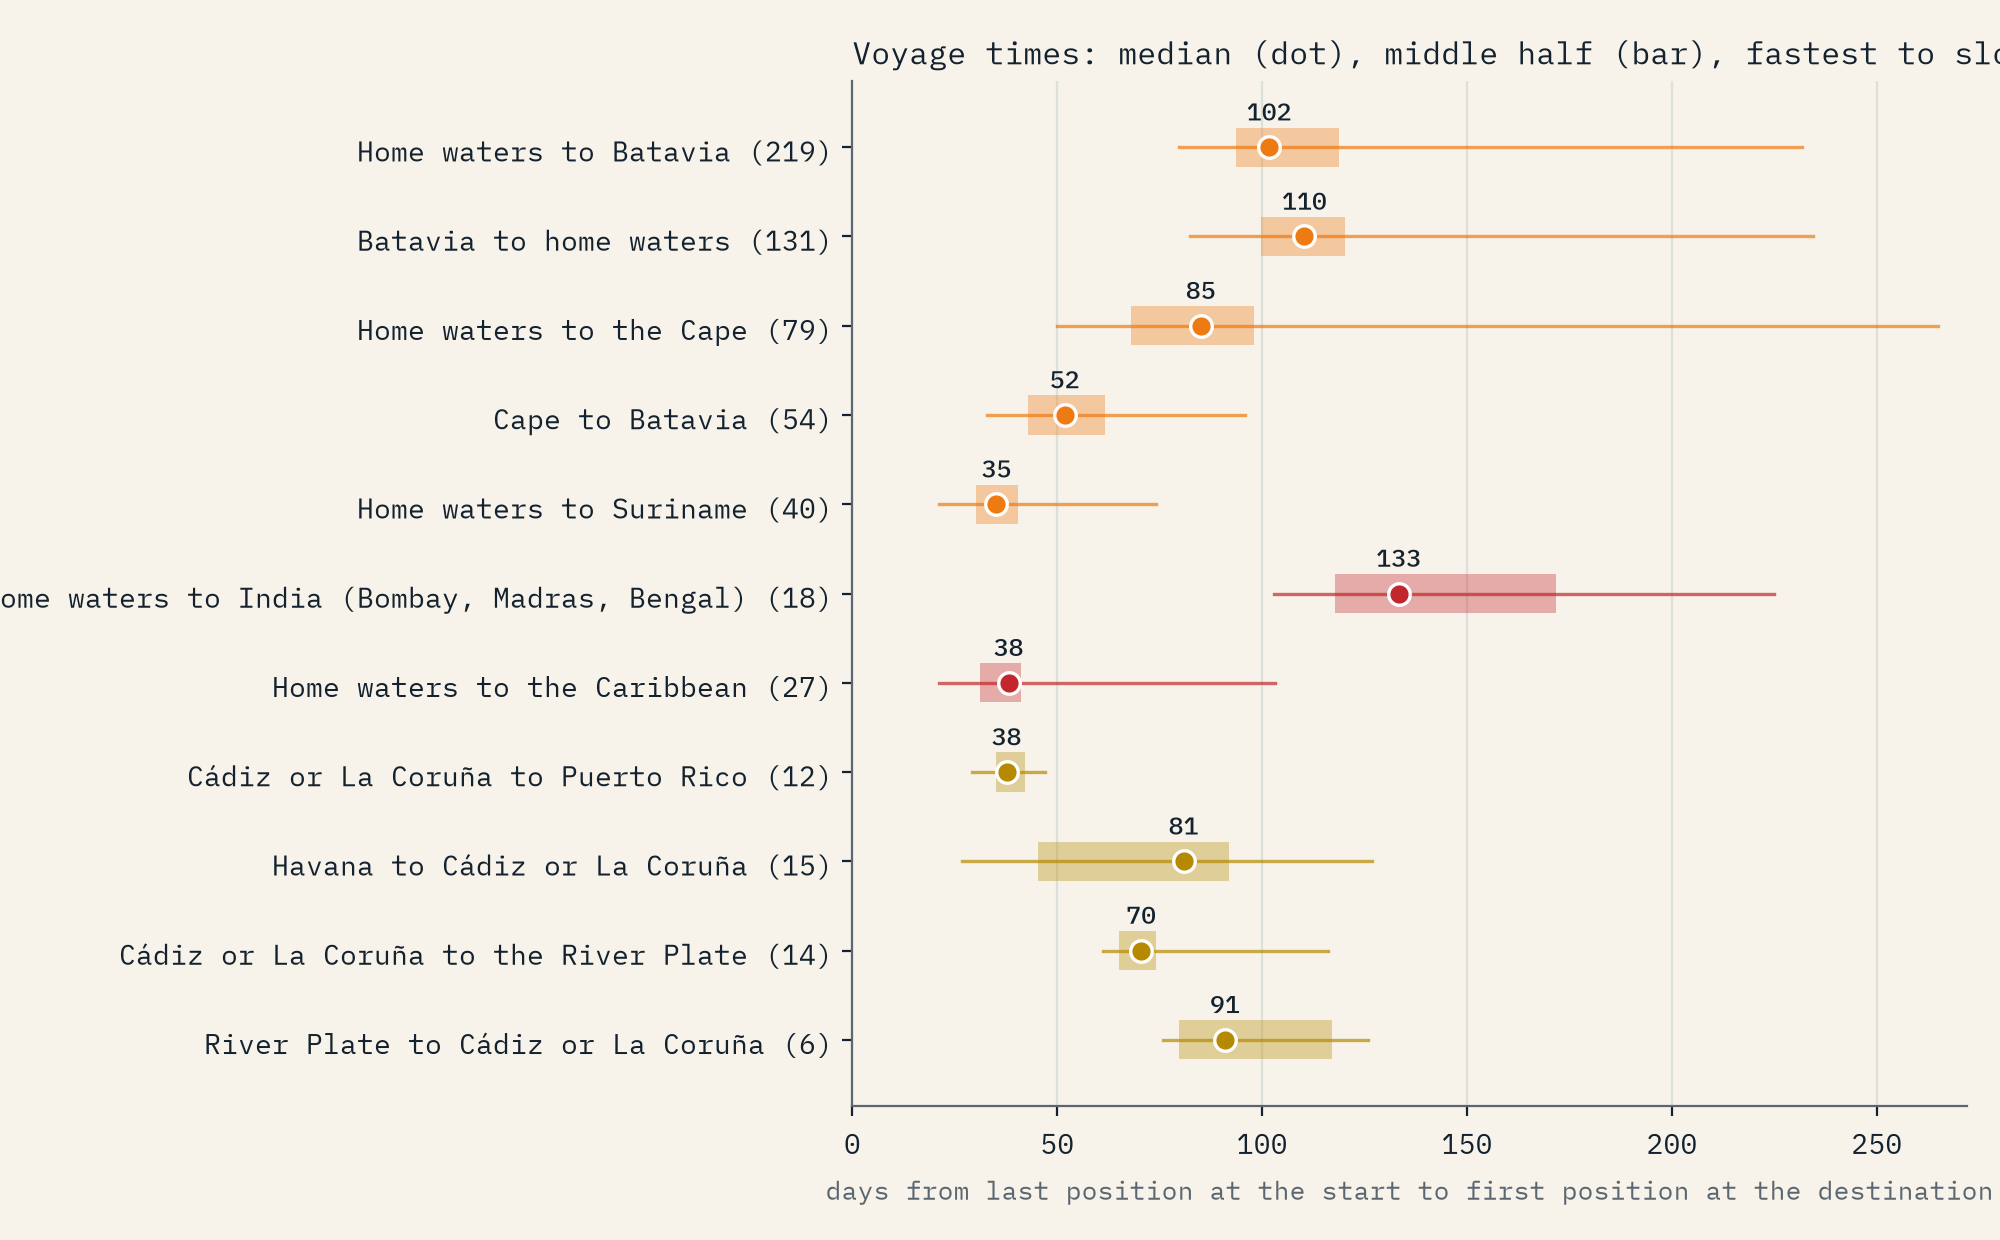
Because every entry is dated, voyage times fall out of the logs. I counted from the last day a ship was in home waters (the North Sea, the Channel and its approaches) to the first day it was off its destination. 219 voyages reached Batavia, the Dutch capital in Java, and the median took 102 days. The fastest, the ADMIRAAL JAN EVERTSEN in 1842, did it in 80.
The early voyages were much slower: a median of 176 days before 1820, against 101 after. Part of that is the weeks Company ships spent at the Cape, but even the leg from the Cape to Batavia shrank from 71 days to 45. There are only 15 early voyages, though, so take that as a sketch. Elsewhere, the Spanish mail packets ran downwind from La Coruña to Puerto Rico in 38 days, but needed 81 to get home from Havana.
Homebound ships crossed 30° N 18° further west than outbound ones. The wind, not the map, drew the route.
A weather record hiding in the logbooks
The wind entries are a treasure in their own right. The officers wrote in English, Dutch, Spanish and French, in compass points and in words like “topgallant breeze” and “flauwe koelte”, and the CLIWOC team translated them into degrees and forces. Averaged over 5° squares, they draw the world’s wind belts: steady easterly trade winds either side of the equator (73% of winds in the north-east trade belt came from between north and east), westerlies further out, and between them the doldrums, where 7.9% of entries were calm or variable, 2.9 times the rate in the trades. In the northern Indian Ocean you can watch the monsoon turn round between winter and summer.
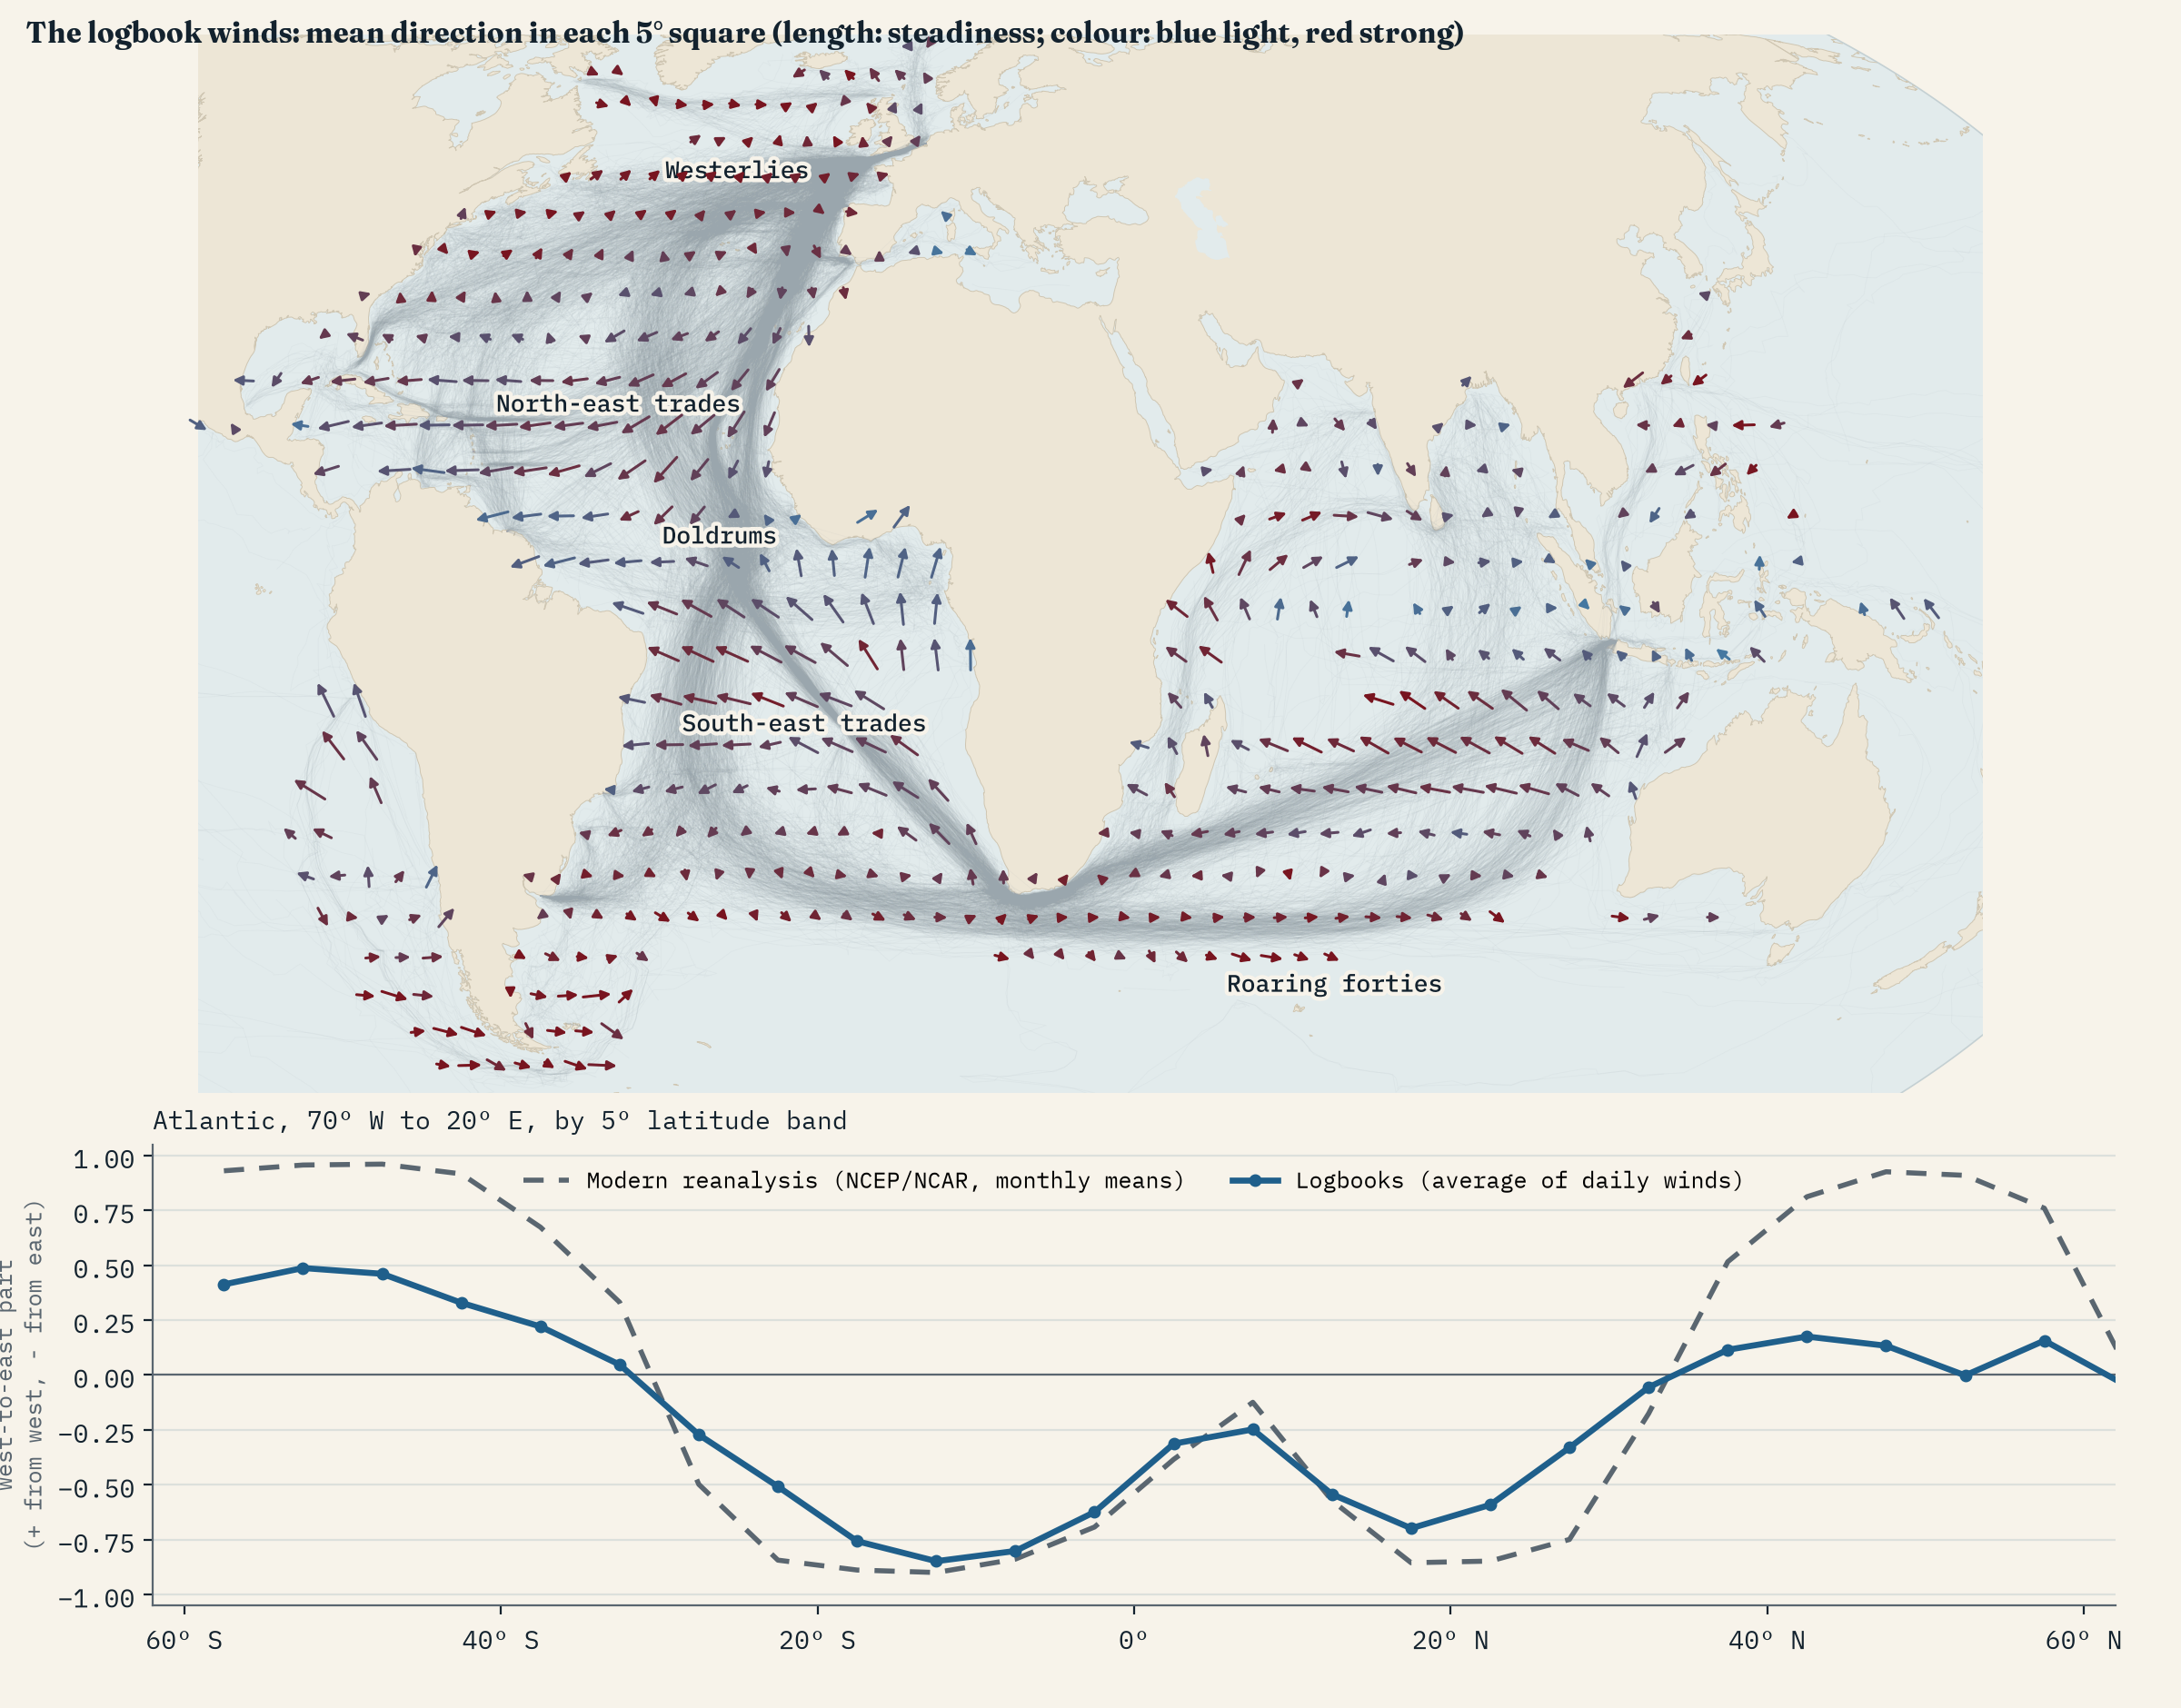
How good are they? I set each entry against today’s long-term average wind for the same place and month. In the 318 squares where today’s wind is steady, the logbook average points within 45° of the modern one in 97%, with a median difference of just 9°. Any single day’s entry is noisier, as you would expect from a day’s weather, but the climate is there, written down by men who never saw a weather map.
What the logbooks leave out
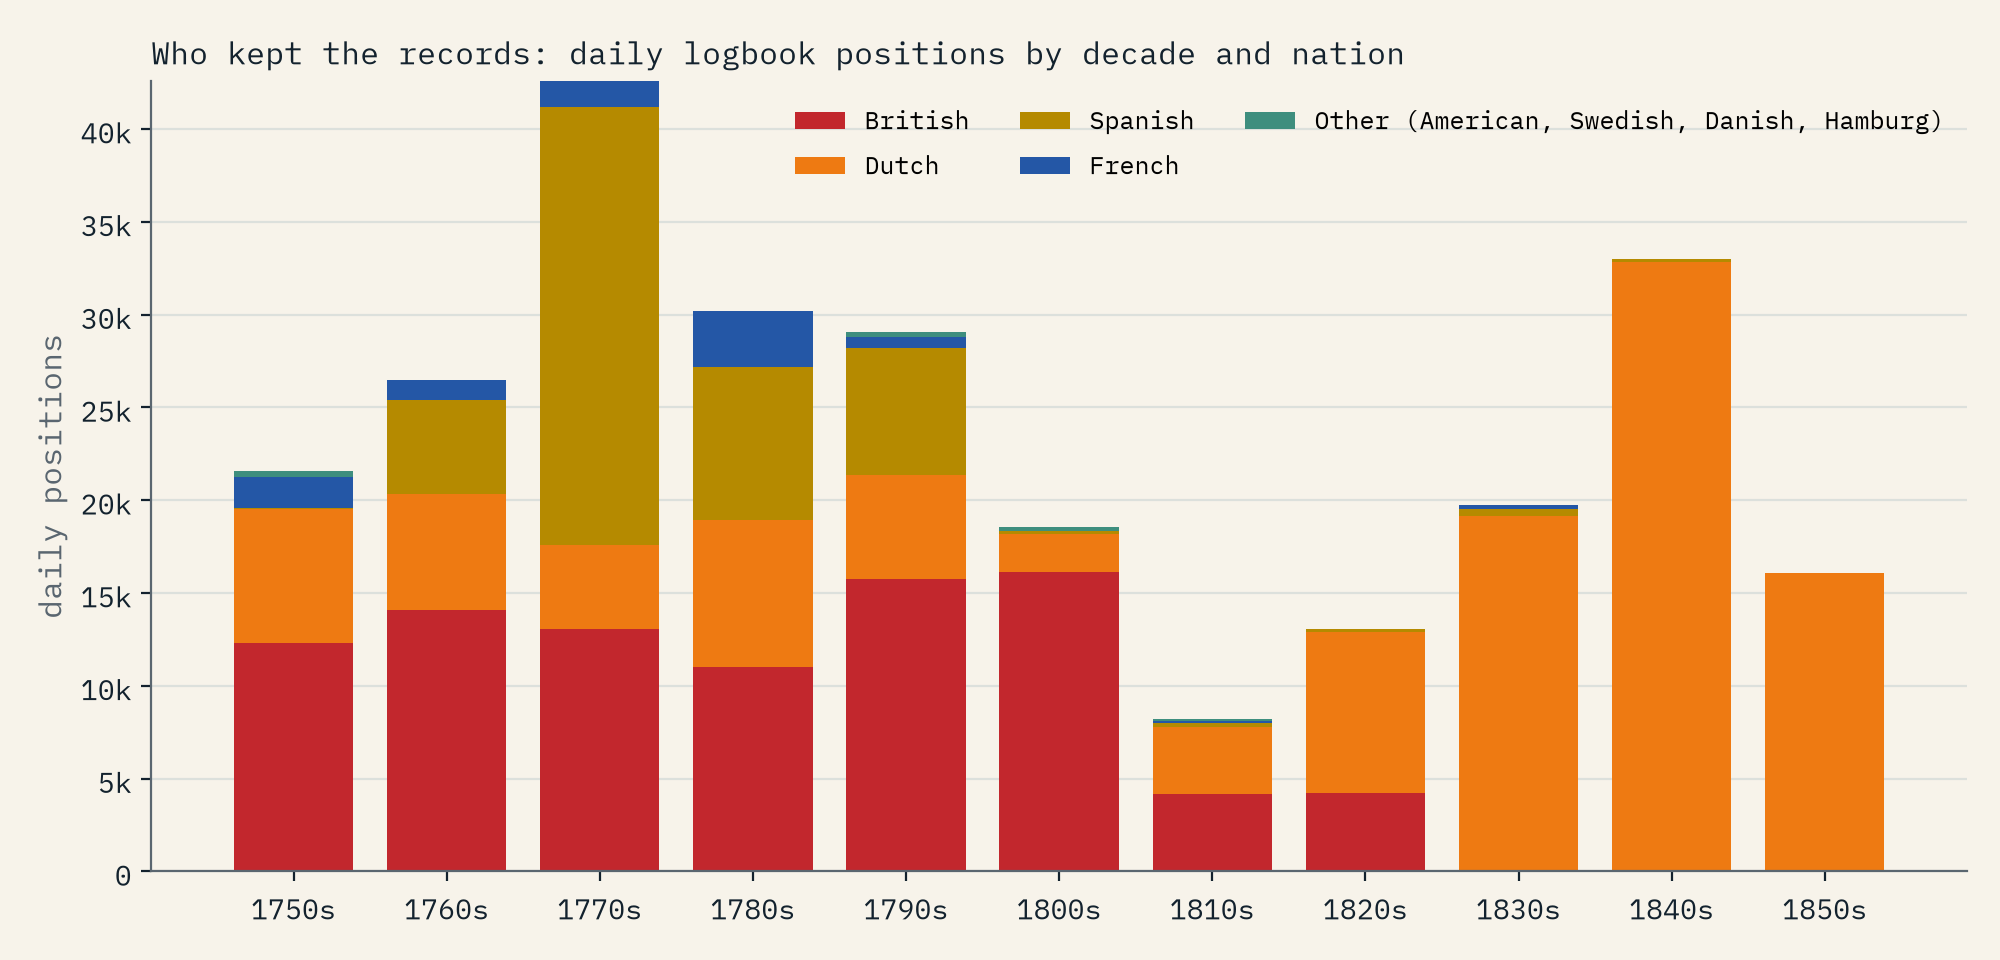
This is a map of the logbooks that survived and were typed up, not of all shipping, and the gaps are big. CLIWOC worked in British, Dutch, Spanish and French archives, so Portuguese, American, Danish and Swedish ships are almost missing, and so are most merchant ships. Navies dominate: 52% of the records are naval. Each nation is lopsided in time. 97% of the Spanish positions date from 1760 to 1799, 67% of the Dutch from 1820 or later, and the British stop in the 1820s. The Pacific is nearly empty, with Cook’s Endeavour and Resolution among the few lines there. And the positions are estimates, worked out from course and speed, with longitude especially uncertain before chronometers.
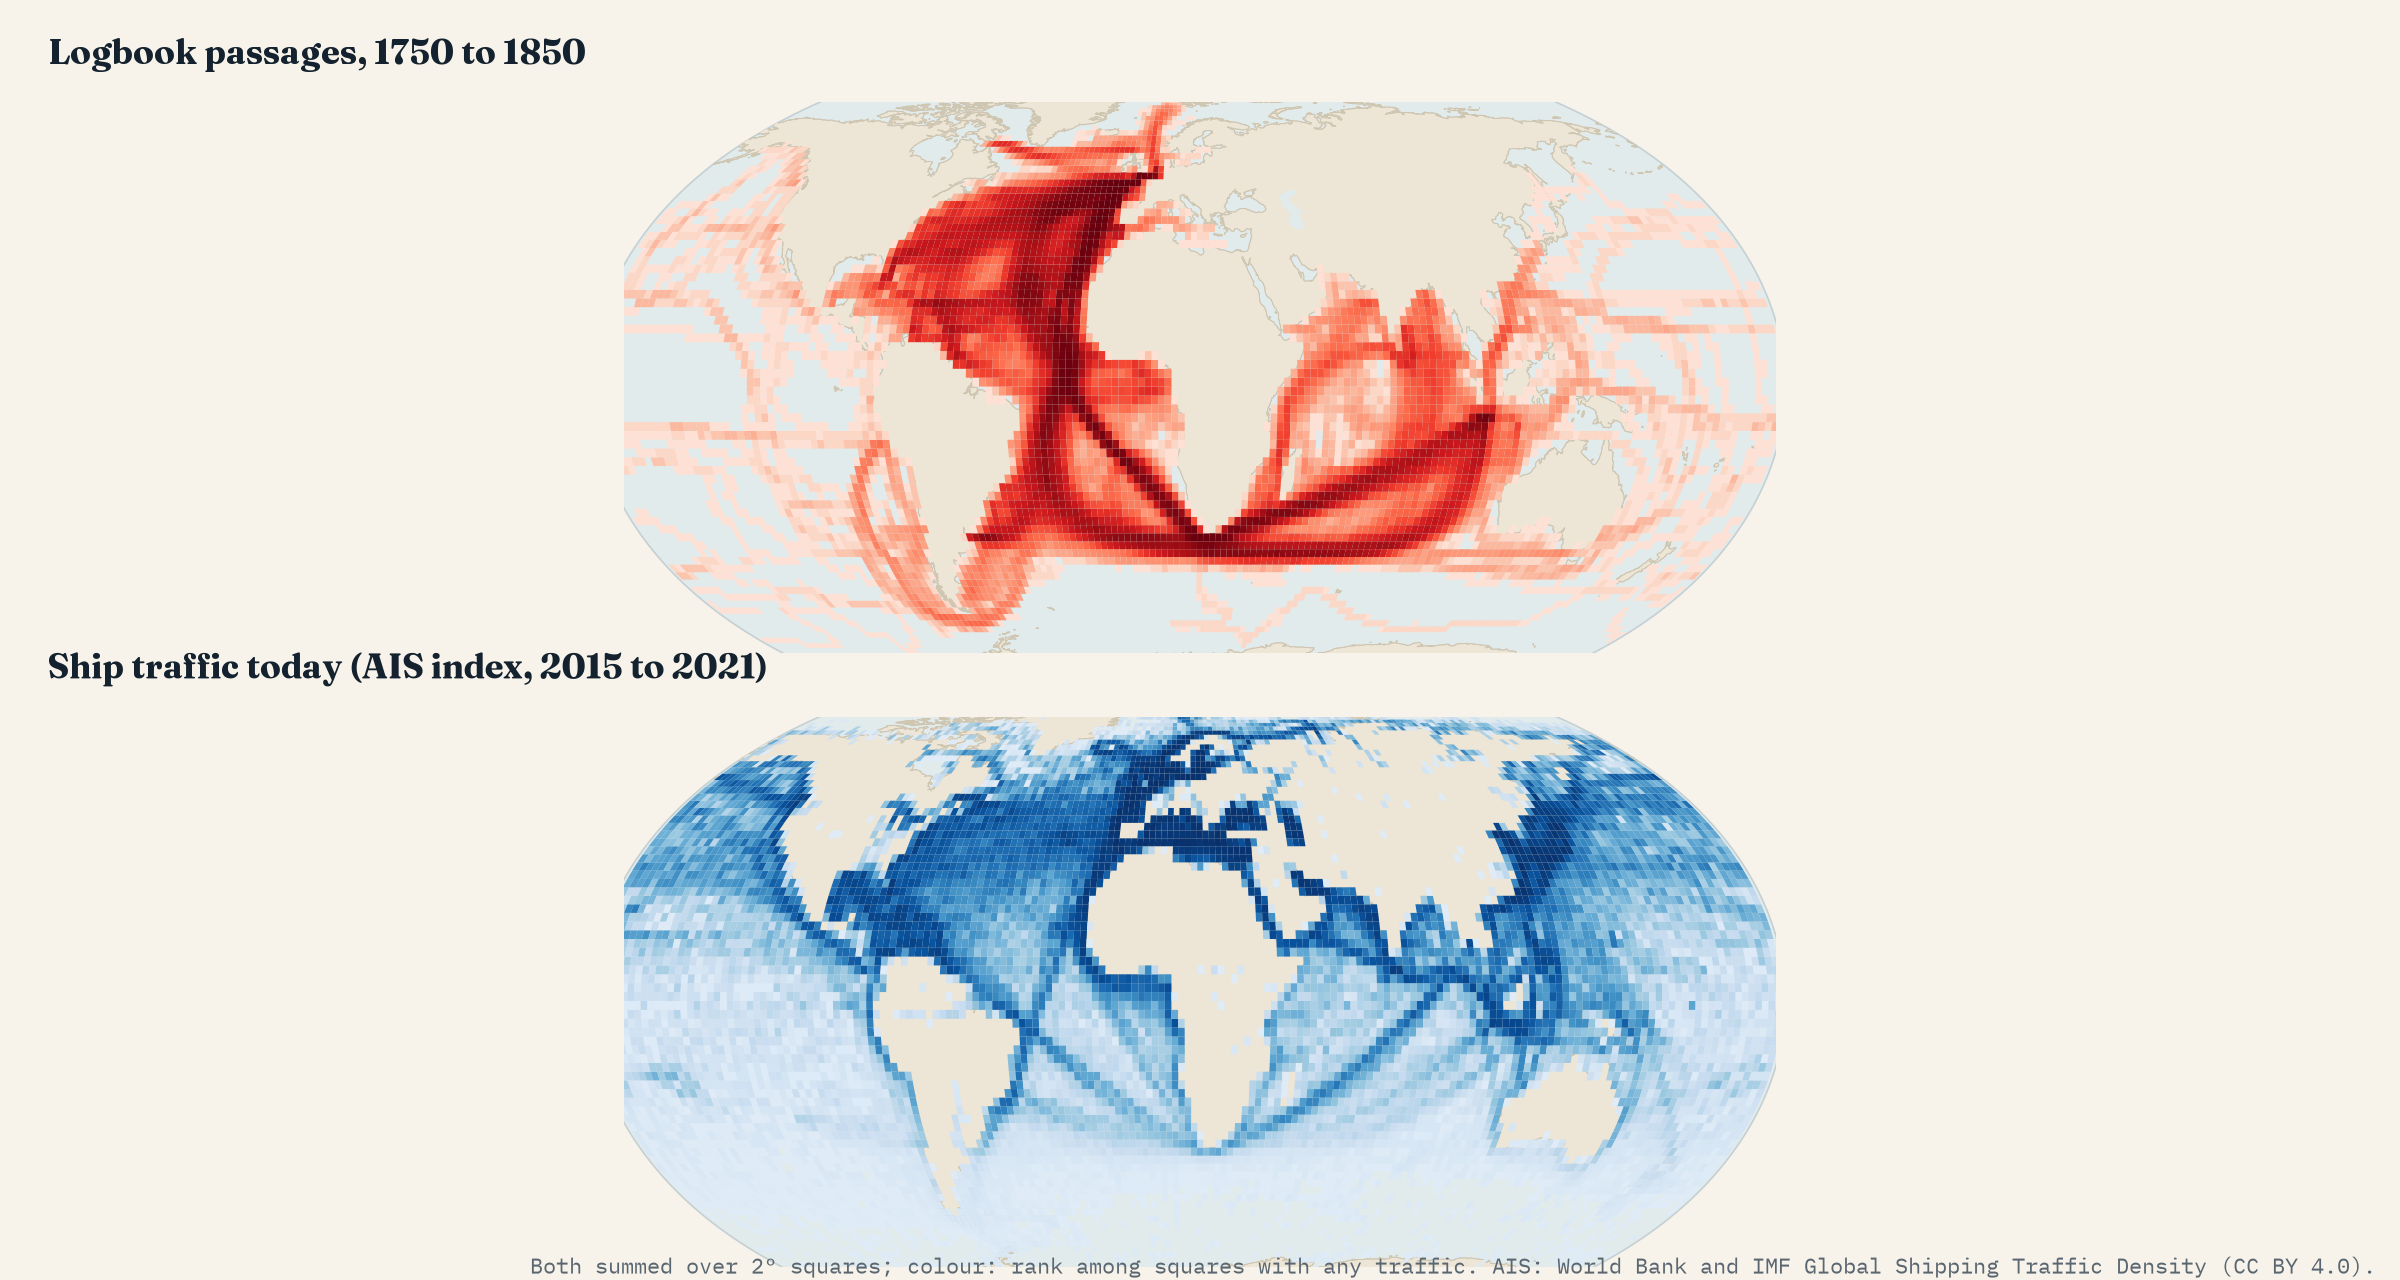
One more contrast. Set against today’s ship traffic, the old roads are nearly deserted. 5.9% of the logbook record crosses the southern Indian Ocean between 35° and 50° S; today that band carries about 0.00% of ship traffic. Steam, the Suez Canal and the Panama Canal moved the world’s shipping to the Red Sea and the Strait of Malacca, waters the logbook ships barely touched.
How I did this
I used CLIWOC version 2.1 as a GeoJSON of ship tracks prepared by Francisco Correoso, cut each record into passages wherever the log fell silent for more than 10 days, and removed 63 obvious position slips. For routes and voyage times I drew circles round 42 ports and anchorages and a box round European home waters, and timed each voyage from the last day at the start to the first day at the destination. Crossings of lines of latitude and longitude are interpolated between daily positions. The wind comparison uses the NCEP/NCAR reanalysis monthly averages for 1991 to 2020, and today’s shipping uses the World Bank and IMF ship density summed over 2° squares. Everything is in the paper and the code.
Notes and sources
- García-Herrera, R., Können, G.P., Wheeler, D.A., Prieto, M.R., Jones, P.D. and Koek, F.B. (2005) CLIWOC: a climatological database for the world’s oceans 1750 to 1854. Climatic Change 73, 1 to 12. Database version 2.1, released by the Universidad Complutense de Madrid and KNMI. Openly published research data; I found no formal licence, so please check the original terms before reusing the positions.
- Francisco Correoso, cliwoc_vis (github.com/kikocorreoso/cliwoc_vis): the GeoJSON of CLIWOC voyages used here.
- NCEP/NCAR Reanalysis 1 long-term monthly means, NOAA Physical Sciences Laboratory (Kalnay et al. 1996). Public domain.
- World Bank, Global Shipping Traffic Density (IMF and World Bank, AIS data 2015 to 2021). CC BY 4.0.
- Wikipedia, ‘Age of Sail’ and ‘Trade winds’, for background. Natural Earth for land and coastlines.
- This study’s text, figures and data: CC BY 4.0. Code: MIT.
- I wrote the text, with drafting and editing assistance from Claude (Anthropic), which also helped prepare the analysis code. I reviewed and checked all text and results.

