
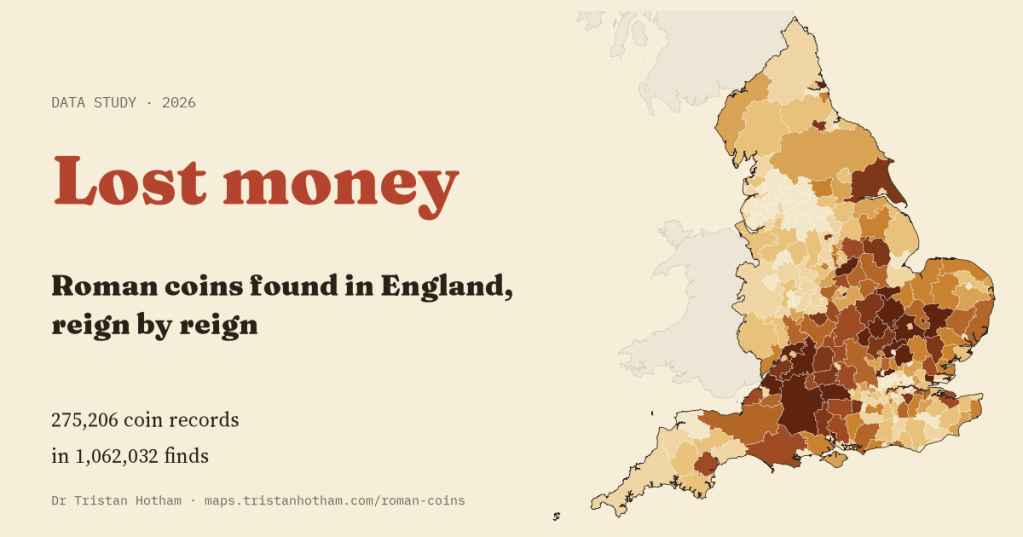
Every Roman coin found in an English field was lost by somebody. I mapped 275,206 records of them from the Portable Antiquities Scheme, district by district and reign by reign. The rhythm of loss is the one archaeologists know well. The map of it is not quite the one I expected.
Roman coins turn up everywhere in England: in ploughsoil, in gardens, on the foreshore of rivers. Most were small change, dropped in a market or a field and never picked up again. Since the late 1990s, people who find them, mostly metal detectorists, have been able to show them to the Portable Antiquities Scheme, which records what each one is, who issued it and the district where it was found. The database now holds hundreds of thousands of Roman coins.
Each coin carries an emperor’s name, so each can be dated, often to within a few years. Numismatists group them into 21 periods, devised by Richard Reece, from the coins before the Roman conquest to the last issues that reached Britain around AD 402. I used the Scheme’s public search to count, for every district in England, how many Roman coins of each period have been recorded, and how many finds of any kind.
Three peaks
Of the 188,831 coin records that can be dated to a period, only about one in six (16%) belongs to the first two centuries of Roman Britain. If coins had been lost at an even pace from AD 41 to 402, each year would account for about 2.8 in every 1,000. In AD 330 to 348, under Constantine and his sons, the figure is 13.2. Next come AD 364 to 378, under Valentinian and Valens (9.6), and AD 260 to 275, the years of the Gallic emperors and their thin, debased coins (8.9). More than four in five dated coins (82%) are later than AD 260.
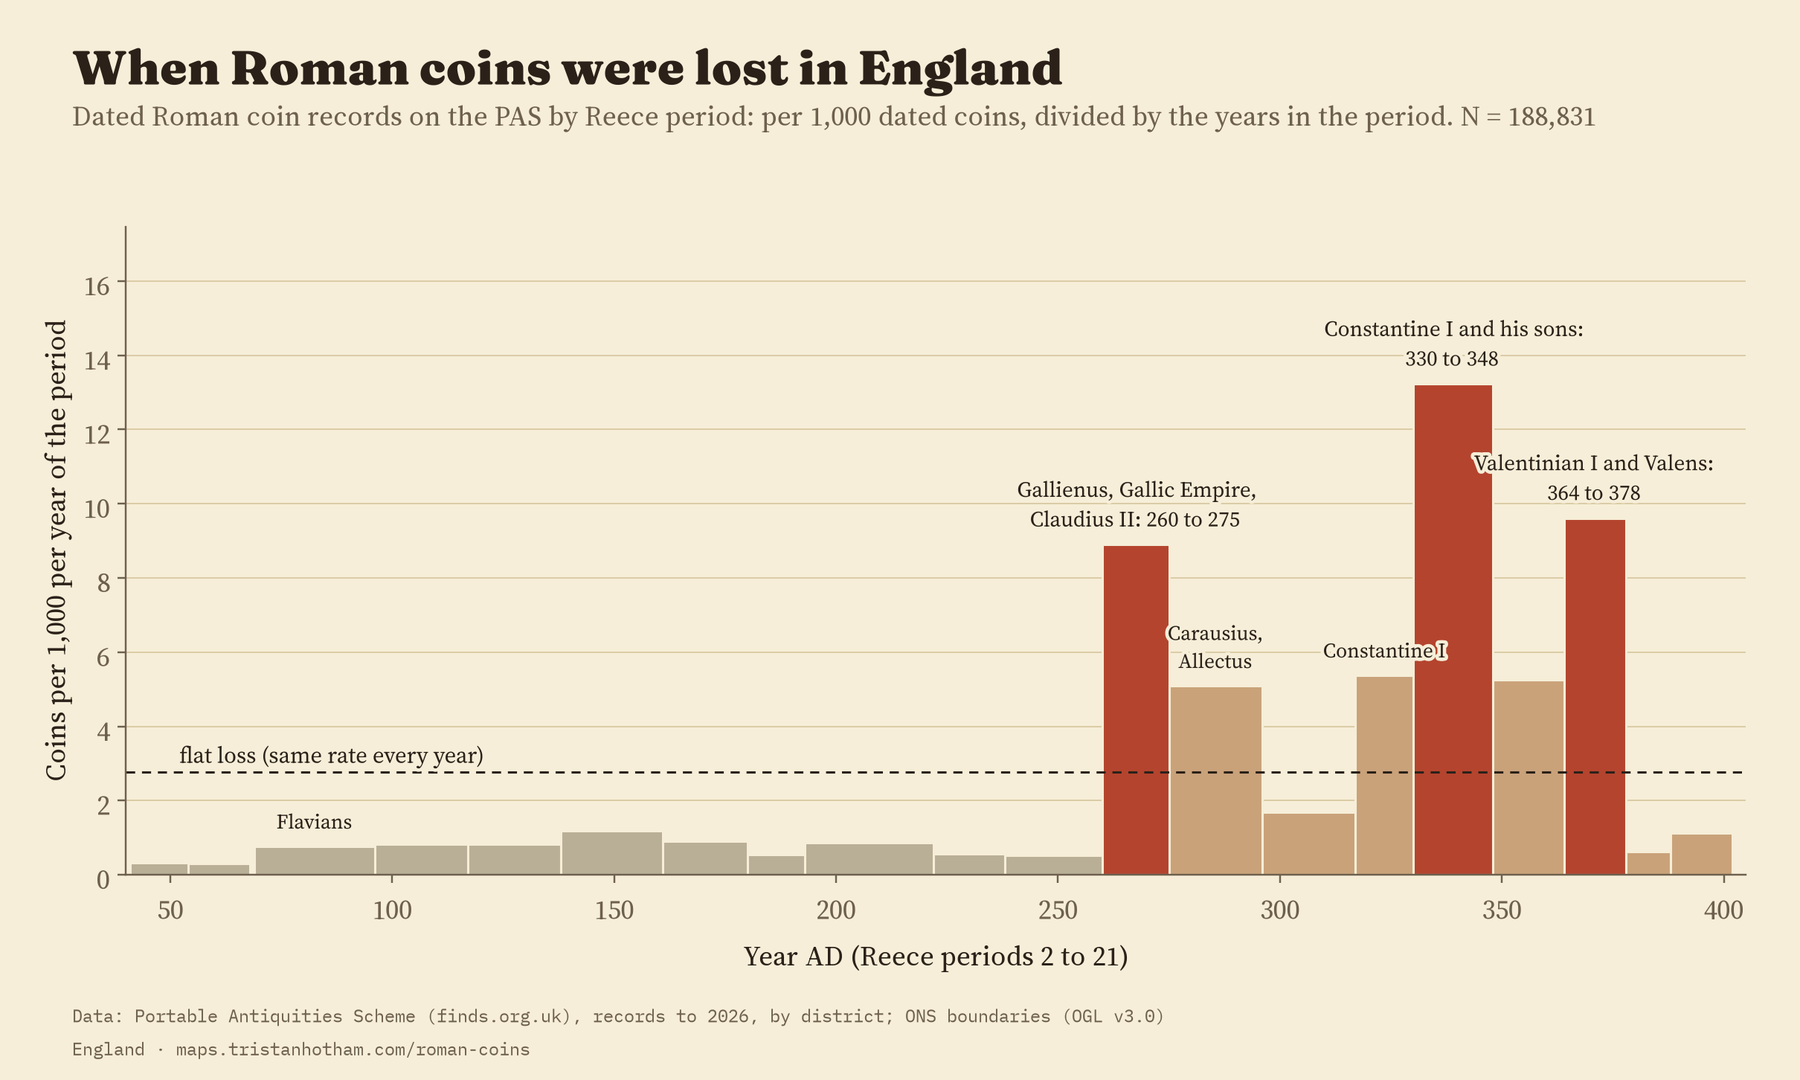
This is the shape Reece found for excavated British sites in the 1990s: a burst of coins in the late third century, a great peak under the house of Constantine, another high point under Valentinian, and then a cliff. Seeing it again in finds from fields across England is a quiet confirmation that the method works. In AD 378 to 388, only 6 of every 1,000 dated coins belong there. It suggests that little new small change reached Britain in those years.
The test that failed
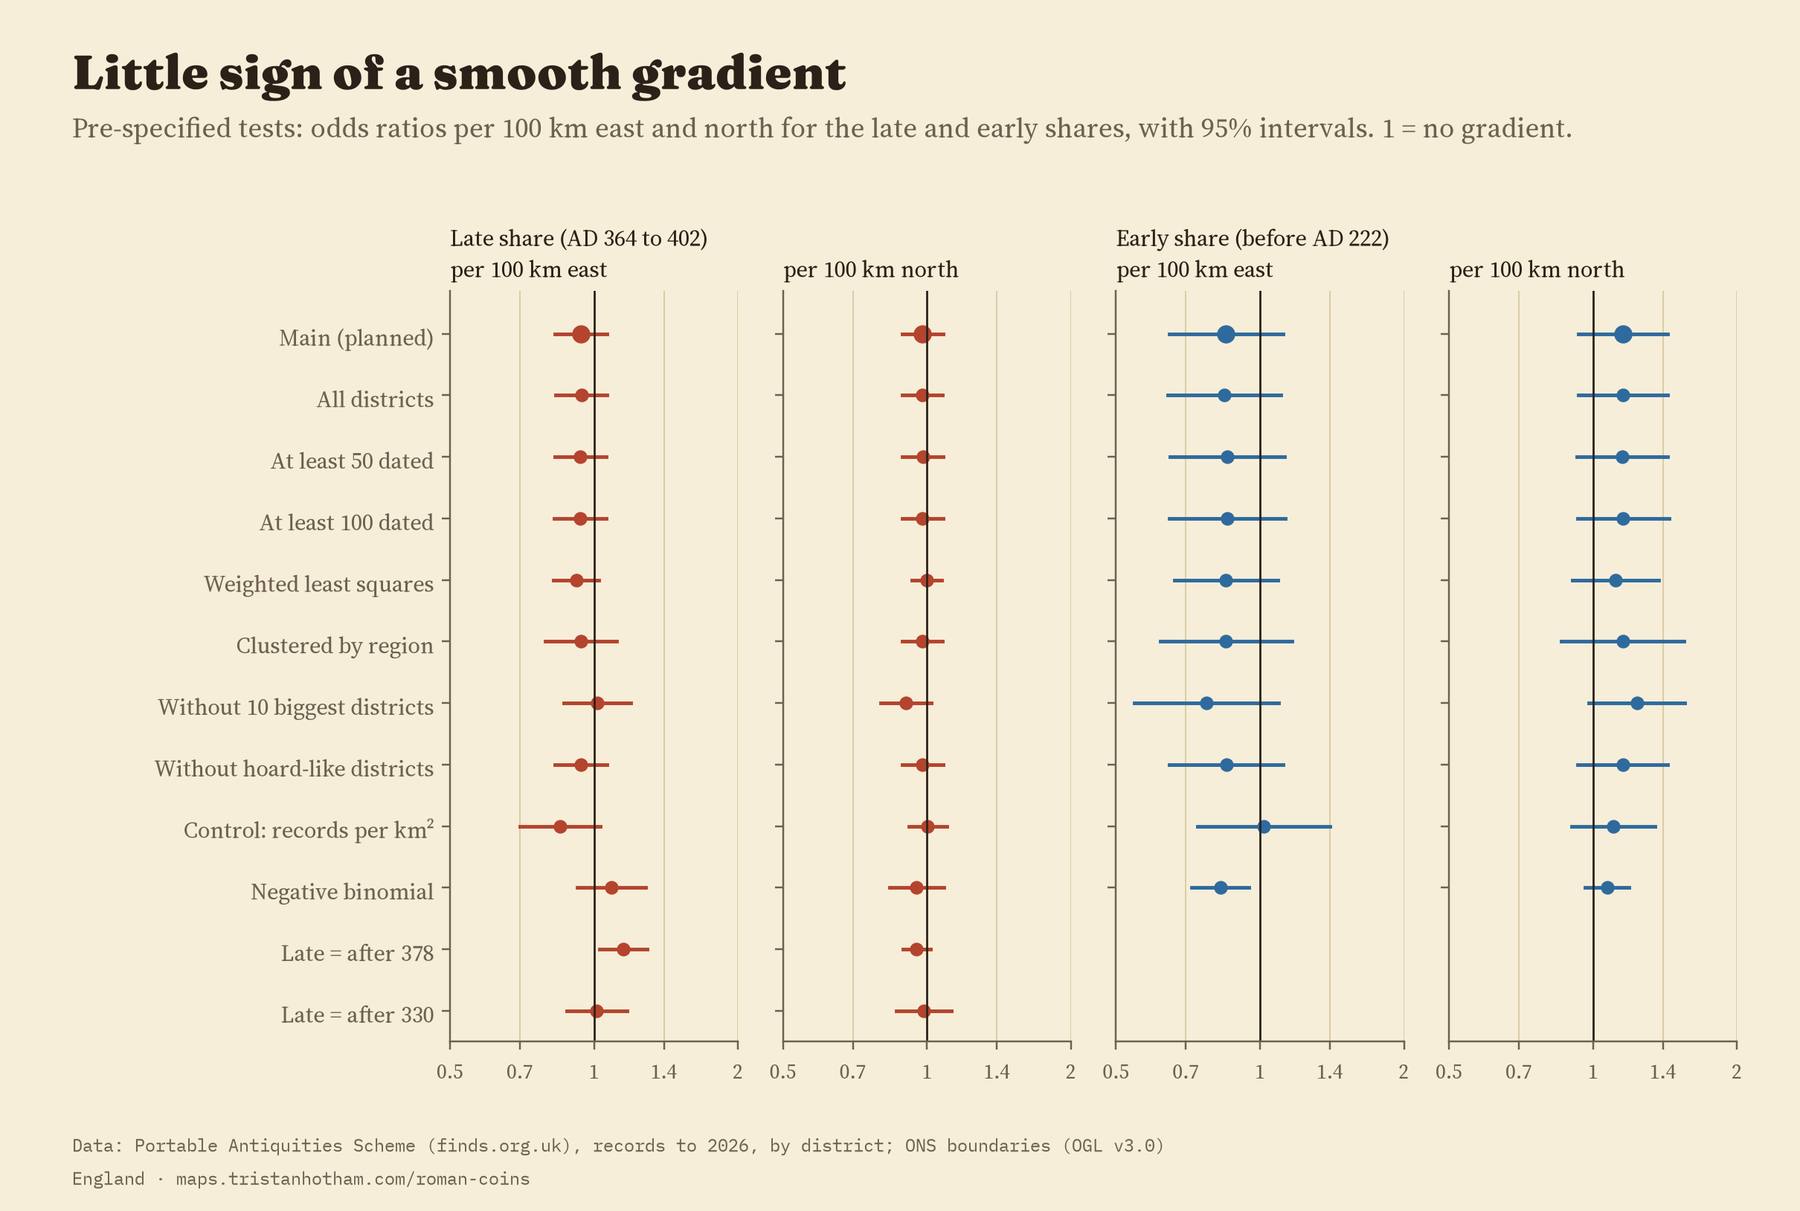
Then I asked where. Roman Britain is often described as two countries: a civil south and east of towns, villas and markets, and a military north and west of forts and soldiers. If coin use followed that divide, the share of late coins should rise steadily as you go east and fall as you go north, and the share of early coins should do the opposite. I wrote that test down before I worked out any shares by district.
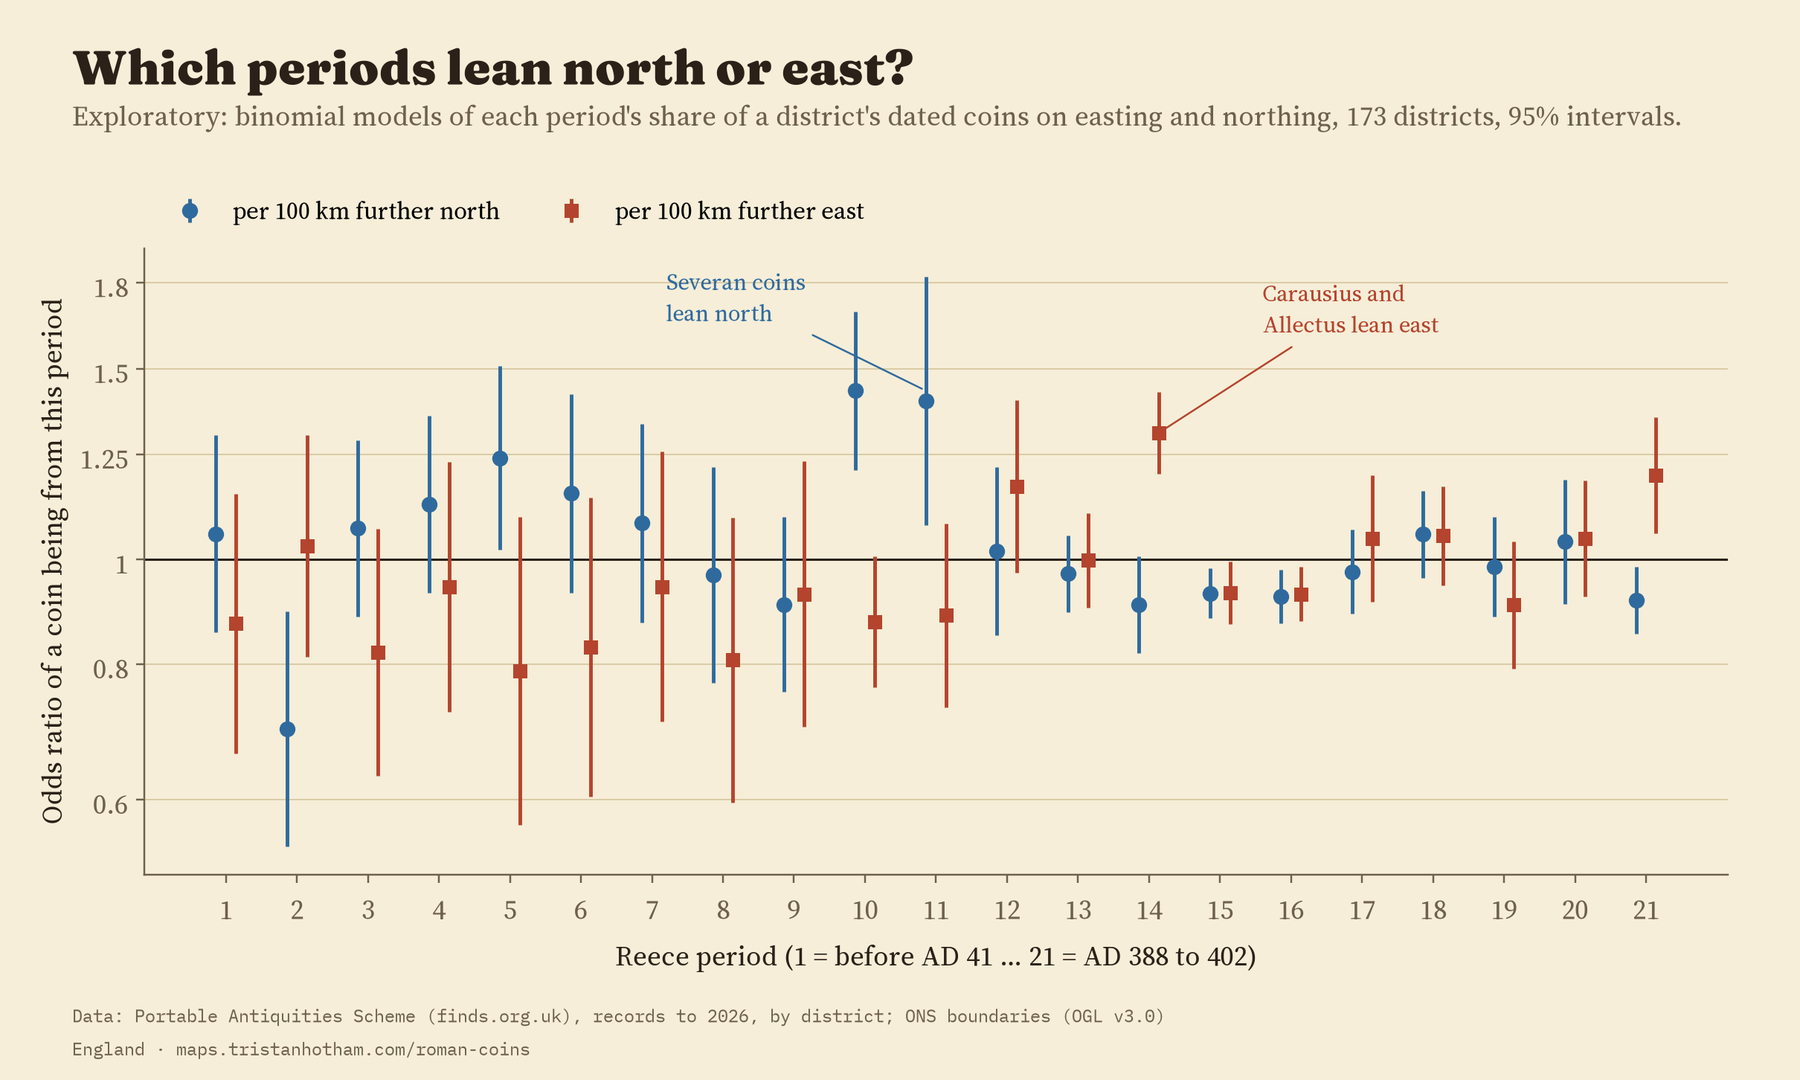
It didn’t work. Across the 173 districts with at least 20 dated coins, the share of late coins (AD 364 to 402) barely changes with distance east or north. The best estimate is that the odds of a coin being late change by a factor of 0.94 for every 100 km east, with a range from 0.83 to 1.06 that includes no change at all. The early coins tell the same story, and so do all but one of the 20 checks I ran on the late share. The exception counts only coins after AD 378, which lean slightly east.
A step, not a slope
That doesn’t mean the country is the same everywhere. It means the difference isn’t a slope. In the North East and the North West, the old frontier zone, 58% of dated coins are from before AD 222, against 15% in the rest of England. Only 4.3% are late, against 15.9%. Meanwhile the South West, as far west as you can go in England, has the highest share of late coins of any region (17.2%). This step wasn’t part of my plan, so I treat it as a description rather than a proven result. But it fits the idea of a military north much better than the idea of a tilt from east to west.
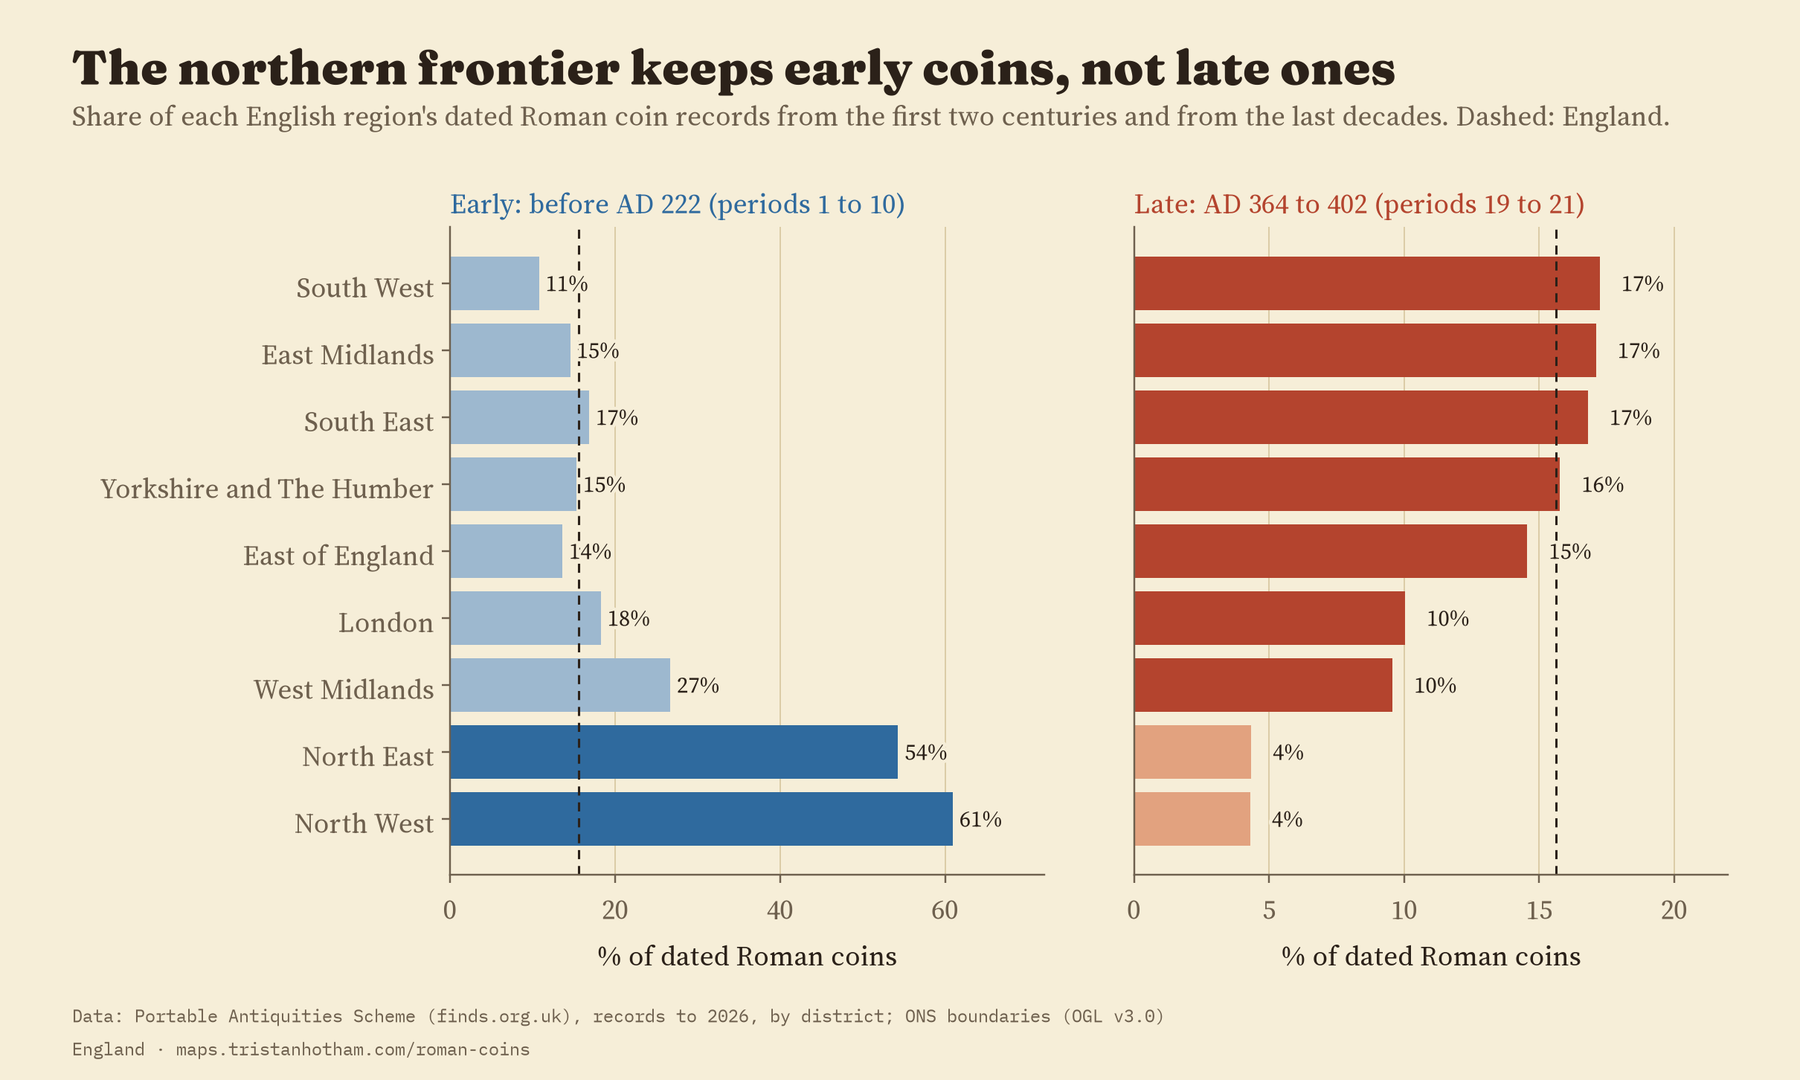
The simplest map of Roman Britain, a tilt from a civil south east to a military north west, does not describe how its coins were lost.
Reign by reign
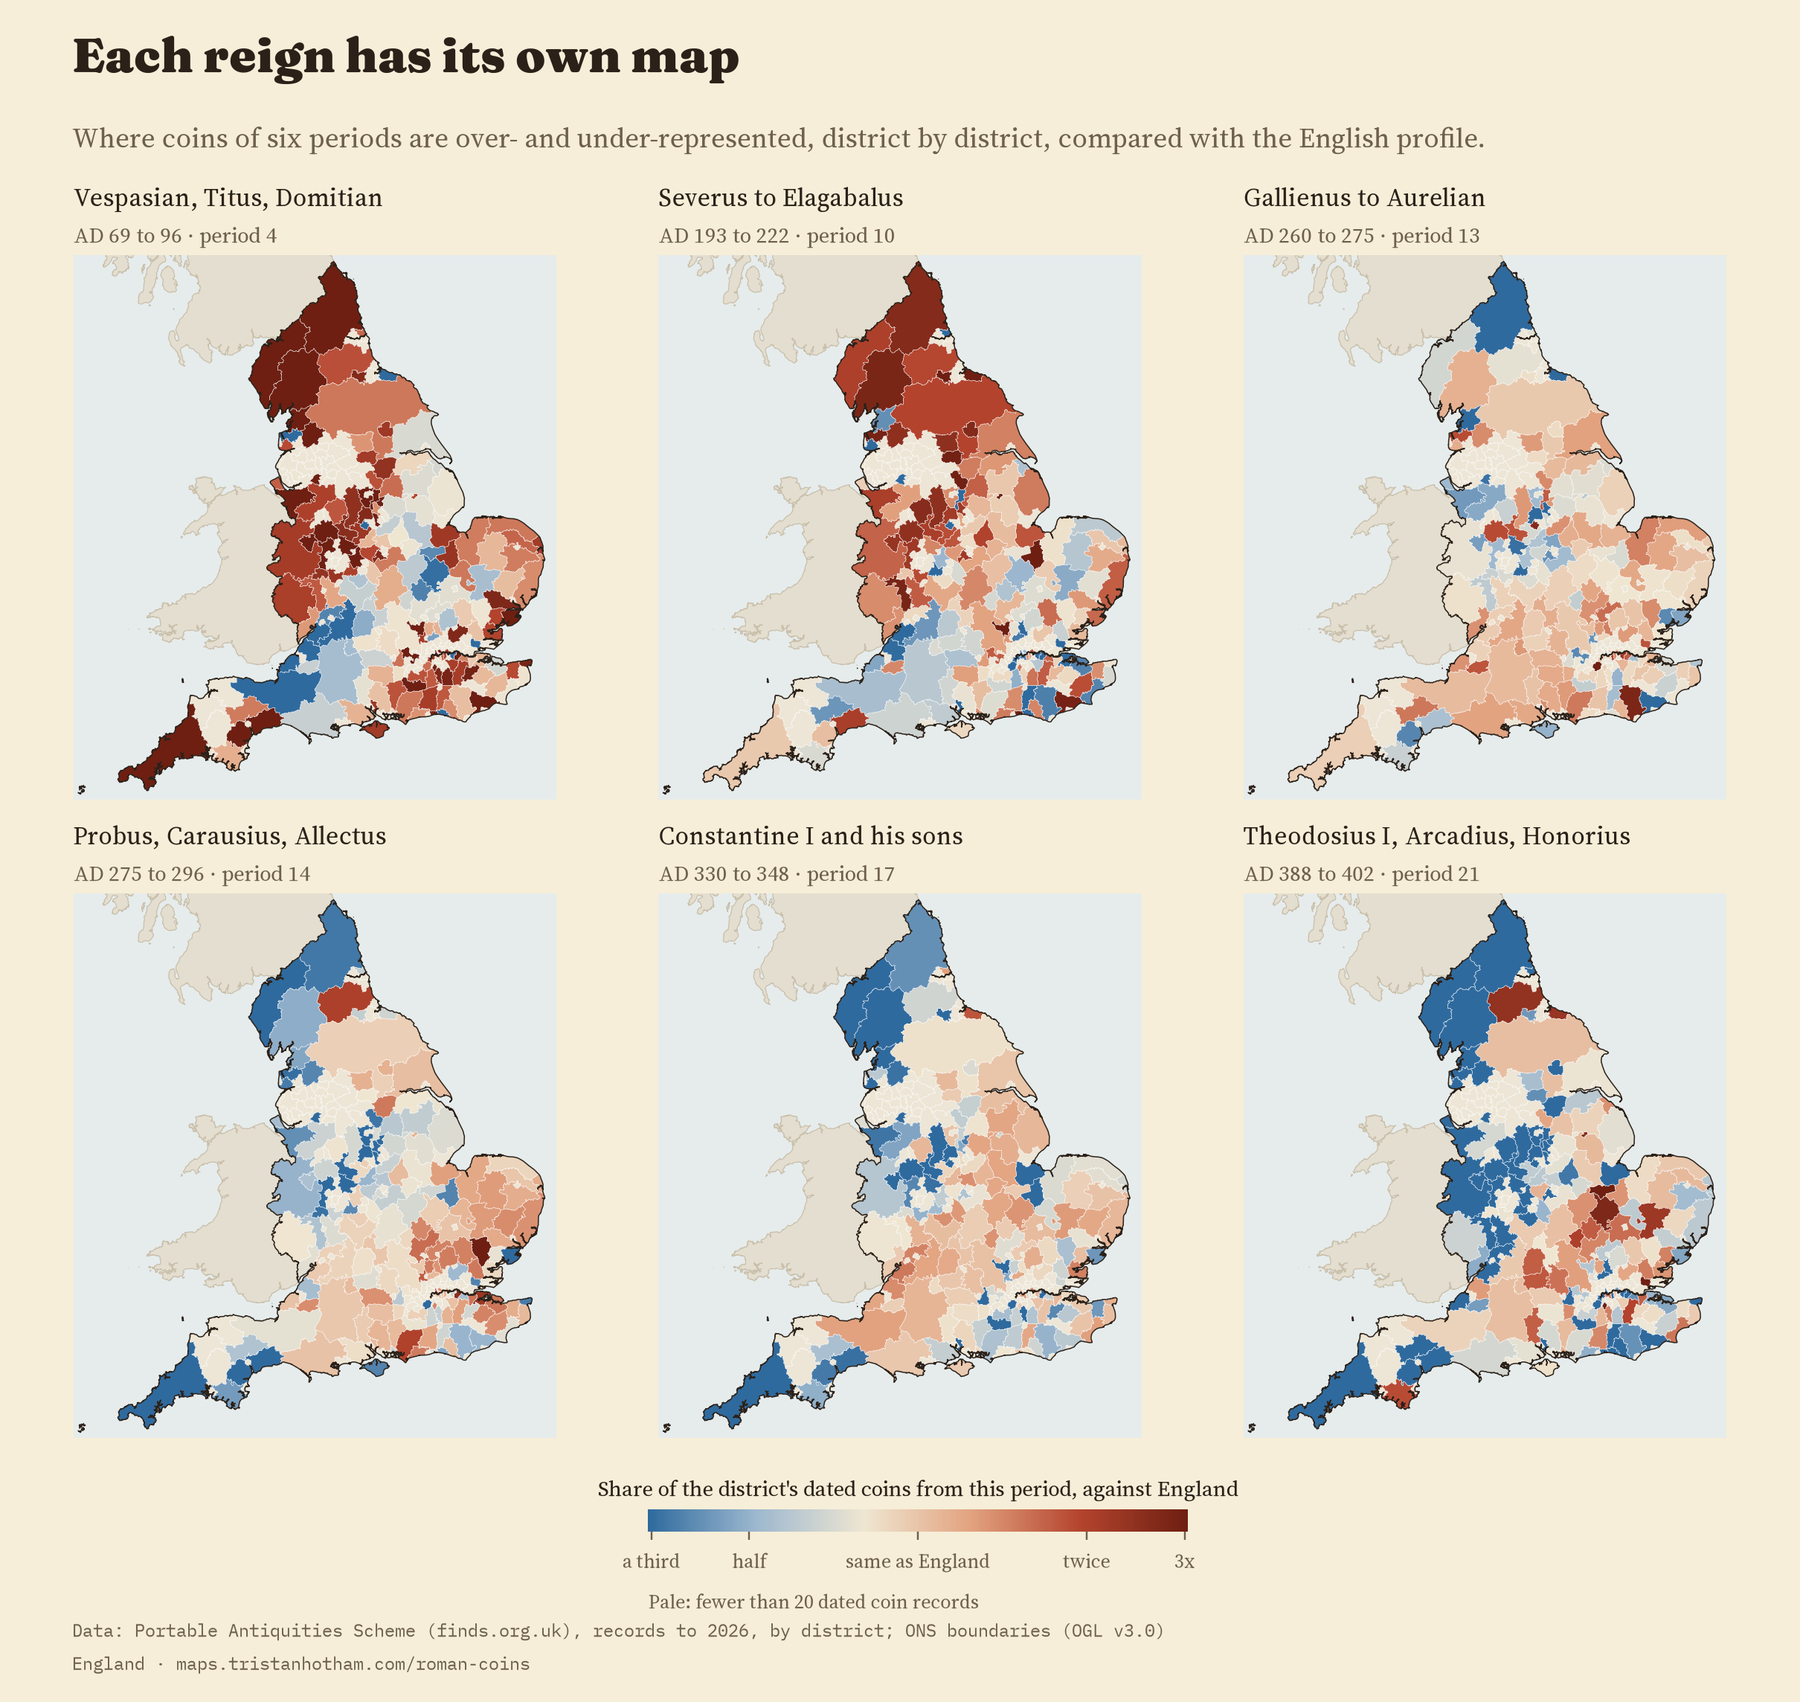
The interactive map has a slider that steps through all 21 periods. Flavian and Severan coins crowd into the north, where the army was. Coins of AD 275 to 296, the years of Probus and of Carausius and Allectus, the breakaway emperors of Britain, lean east. The very last coins, of Theodosius, Arcadius and Honorius, gather in a band from the Thames valley to the Wash and are scarce in the north west.
Letting every period have its own slope makes these patterns sharper. For every 100 km further north, the odds that a dated coin is from AD 193 to 222 rise by a factor of 1.43. For every 100 km further east, the odds for AD 275 to 296 rise by 1.31. I looked at these after the planned test, and with 21 periods some will stand out by chance, so they are leads to follow up rather than results.
Among everything else people find
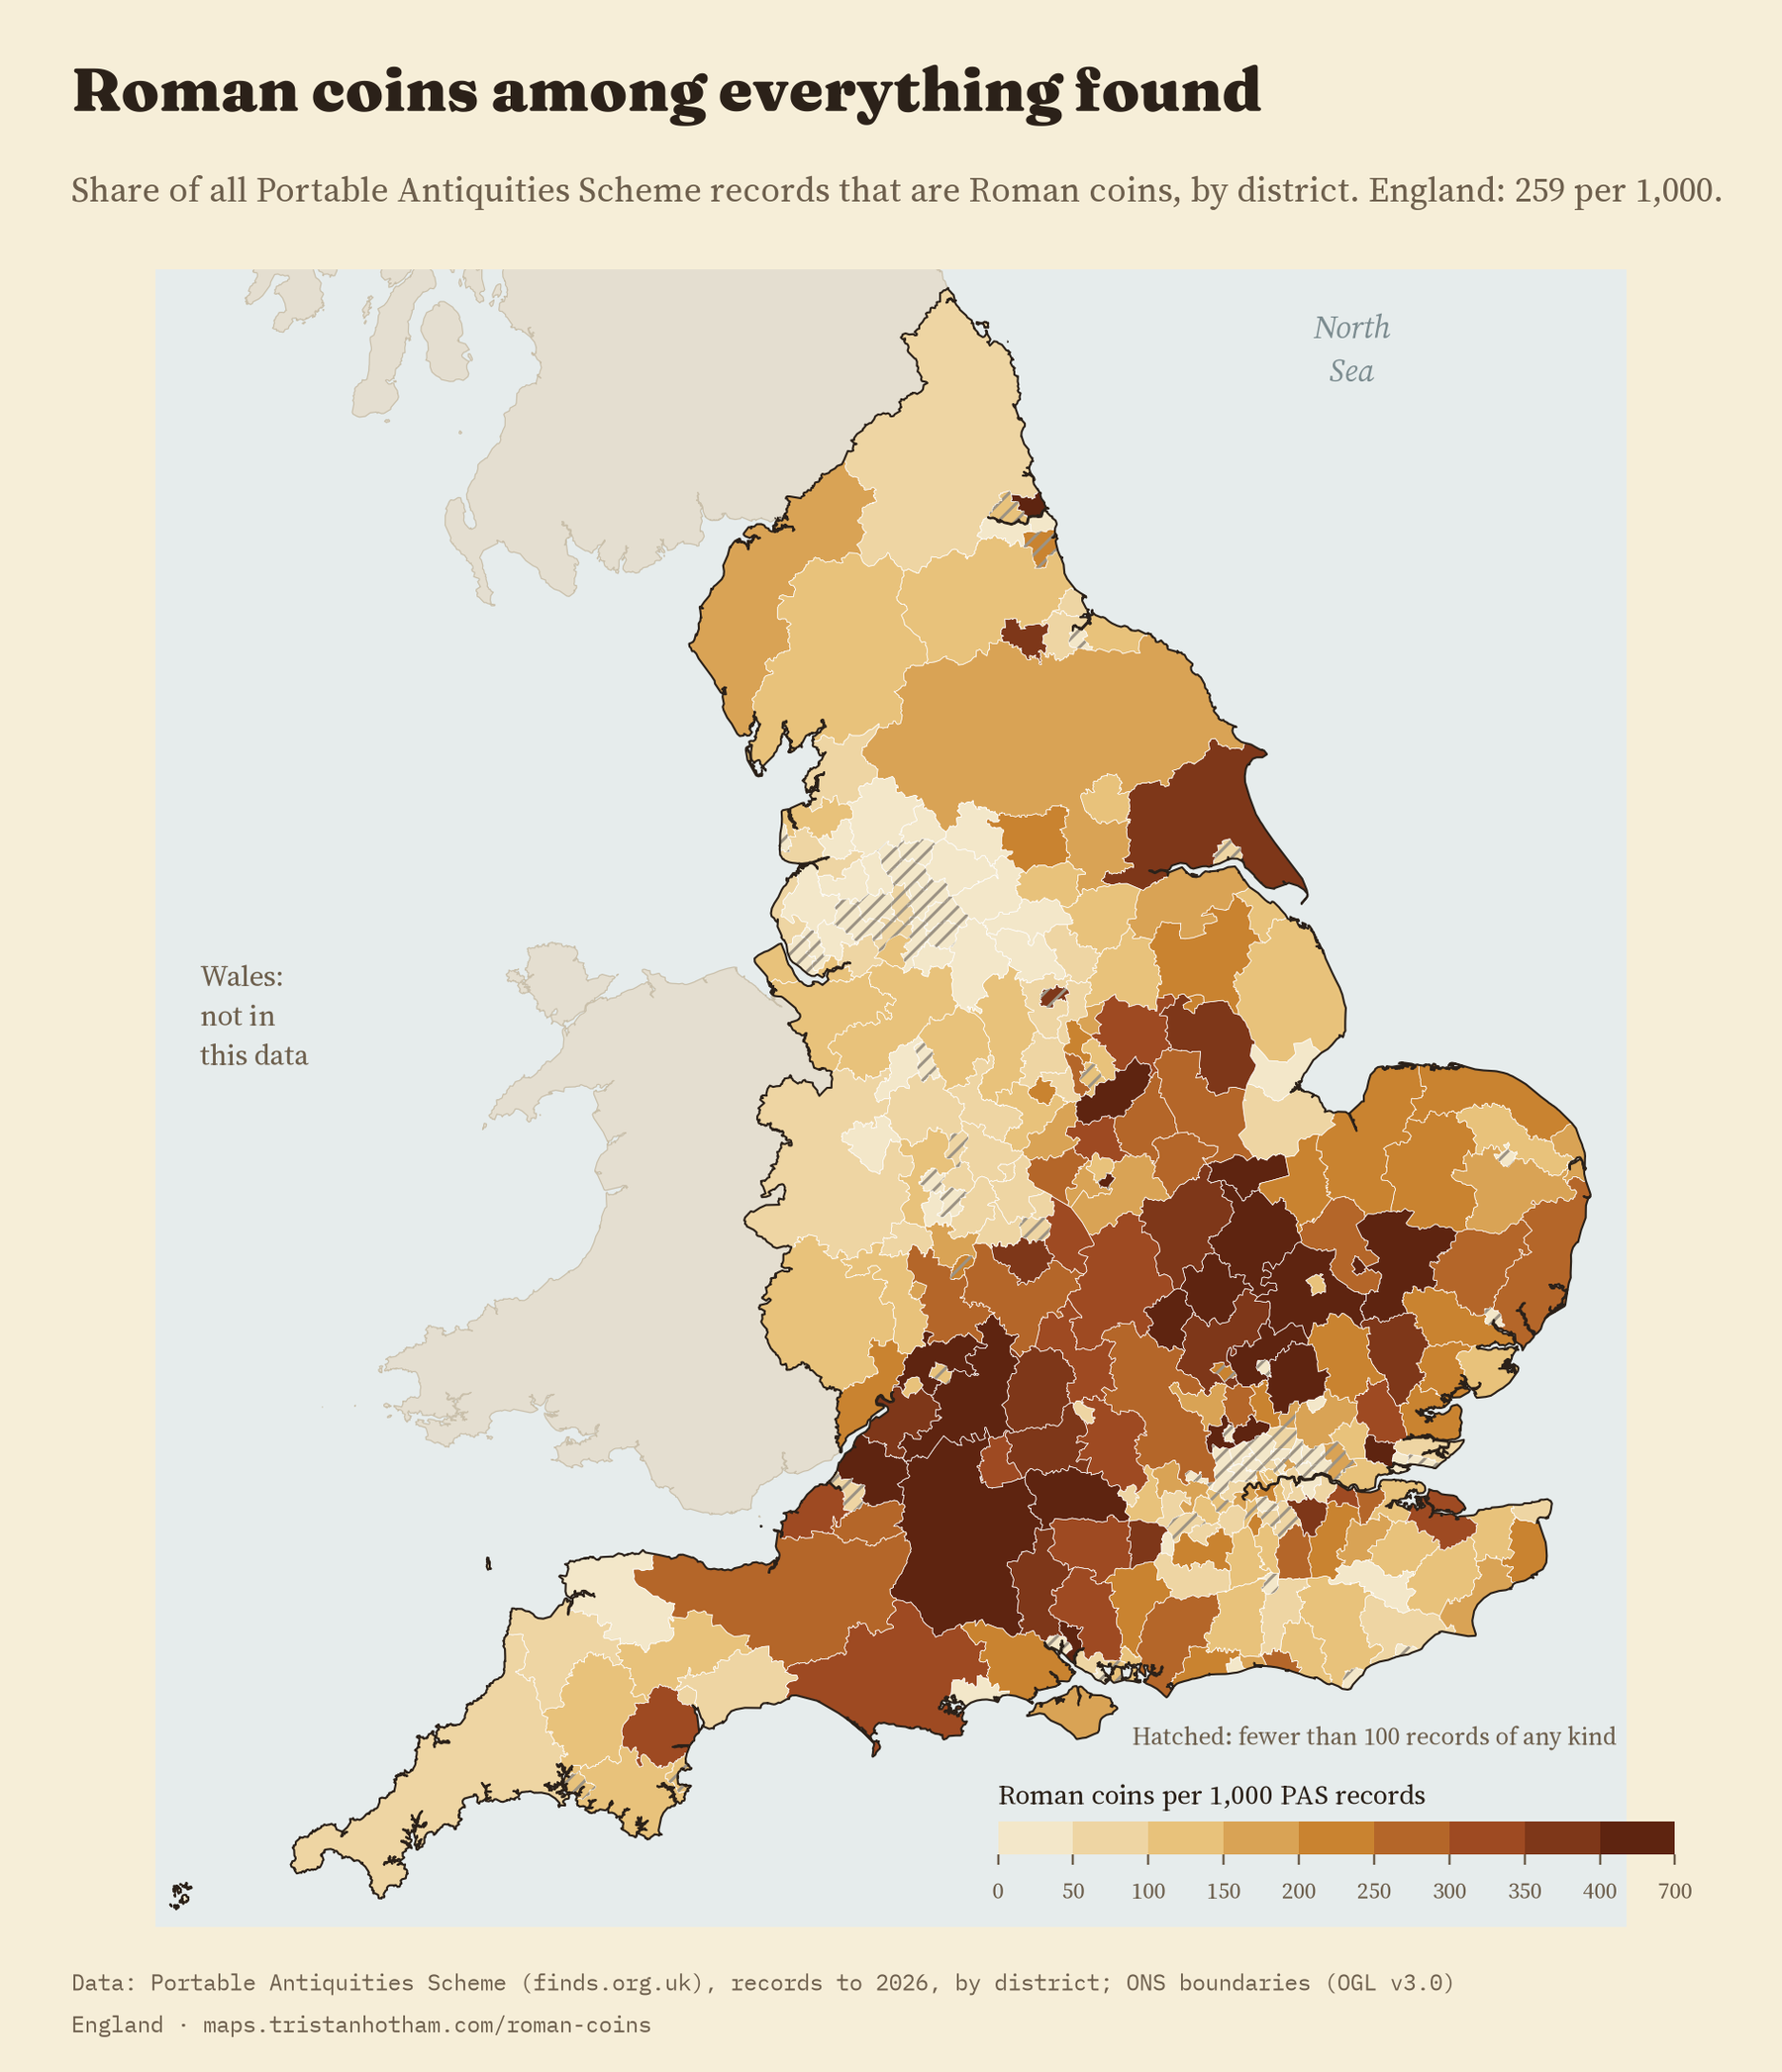
A map of raw coin counts mostly shows where people go detecting and where they report what they find. So the map divides each district’s Roman coins by every find recorded there, of any date. Across England, 259 of every 1,000 finds are Roman coins. In the South West region it is 328, in the North West 112 and in London 91. Among districts with at least 500 finds, the highest share is in Huntingdonshire: 605 in every 1,000.
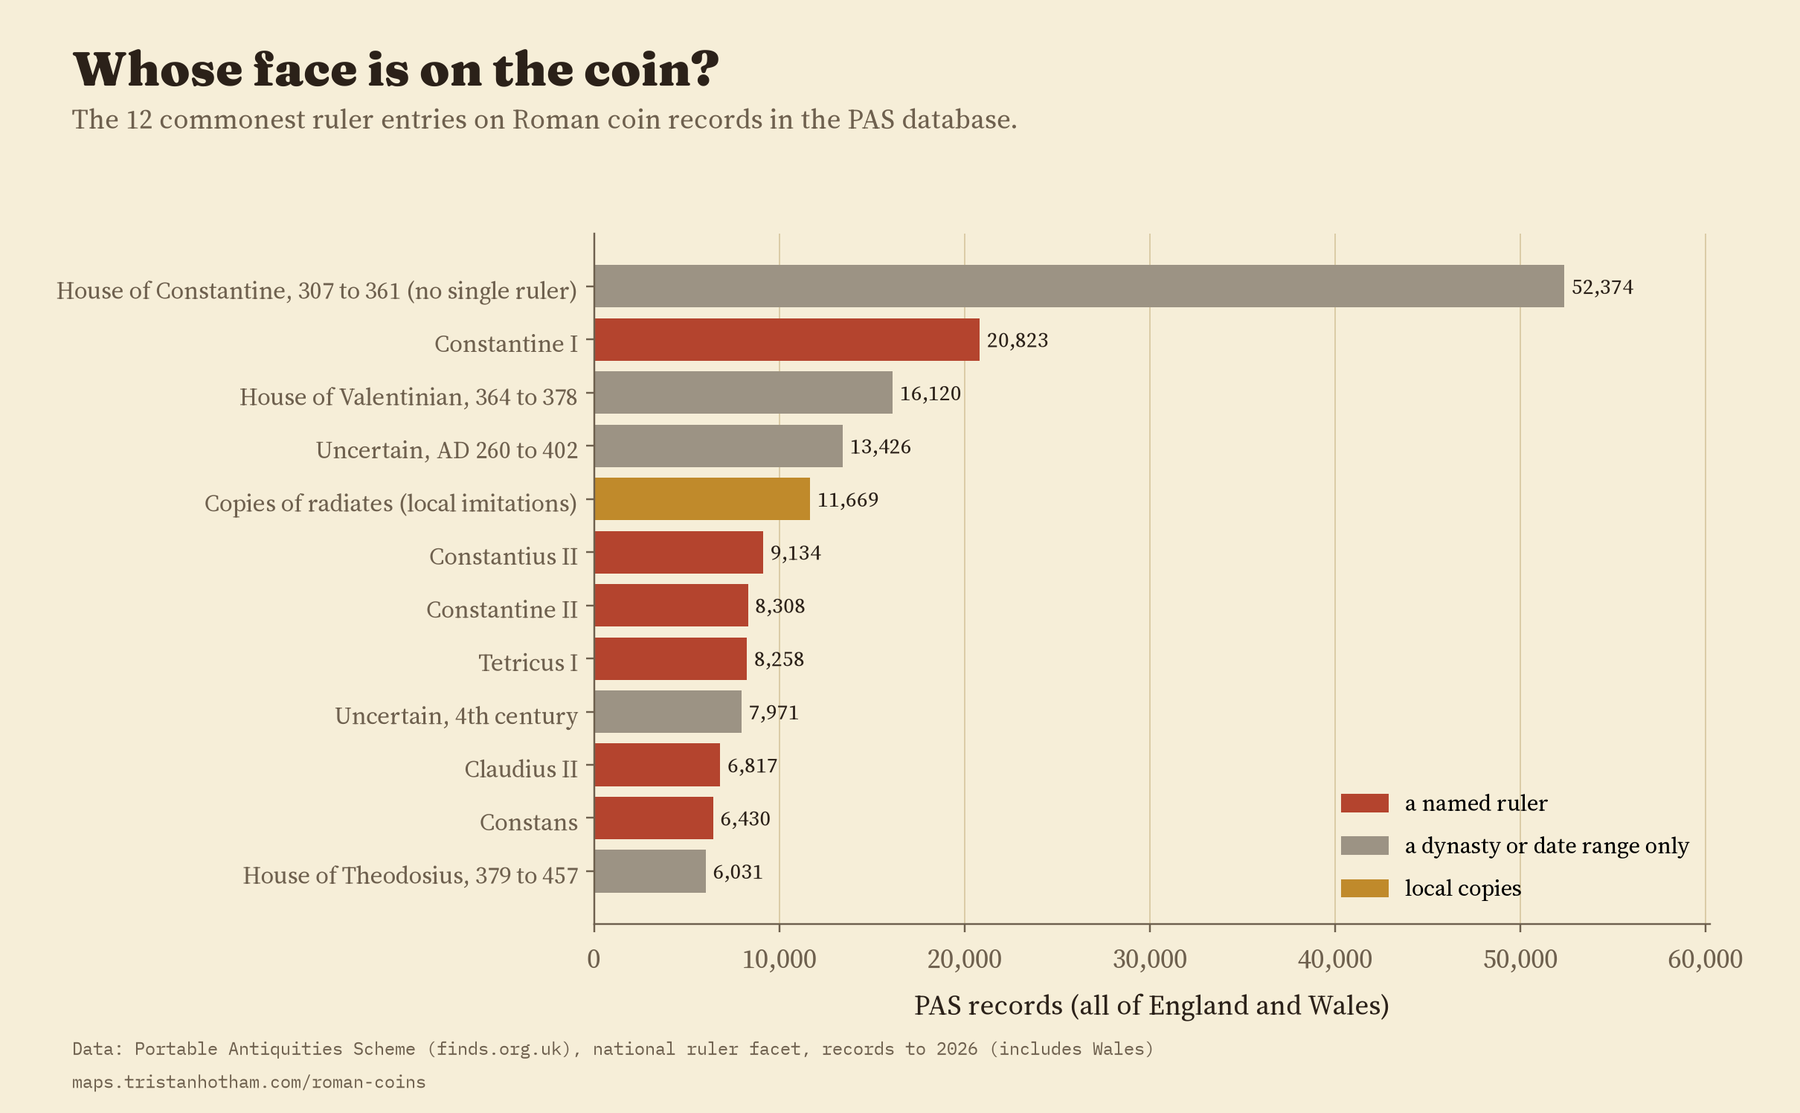
And whose face is on them? Constantine I is the commonest named emperor in 36 of England’s 47 counties. The exceptions are mostly in the north and west, where earlier emperors lead: Trajan in Cumbria, Cheshire, Shropshire and Lancashire, Severus Alexander in Durham, Antoninus Pius in Northumberland, Hadrian in Cornwall and Derbyshire. Constantius II leads in West Yorkshire, and in Staffordshire and Greater Manchester coins of the Roman Republic outnumber those of any single emperor. Nationally, the fifth commonest entry is not an emperor at all but local copies of third century coins, 11,669 of them.
How I did this
All the numbers come from the Portable Antiquities Scheme’s public search, retrieved in 2026, grouped by district and by Reece period for every English county. Findspots are public only to district level, so the district is the smallest unit. The counts are records, not coins: one record can hold several coins, and some hoards are recorded coin by coin. All 296 district names match the 2023 local authority districts exactly. The data cover England only, because Welsh finds are filed under a different county field and were not in the download. The tests were pre-specified in a written plan before I computed any district shares, and the paper reports every planned test, including the ones that failed.
What this can’t tell you: the Scheme records what people choose to show it. Ploughed land is searched more than pasture, some areas have more detectorists or more recording staff, and small, worn late Roman coins are easy to miss. Dividing by all finds removes some of that, not all. These are patterns in the record of what has been found, not a census of what was lost.
Notes and sources
- Finds: Portable Antiquities Scheme database (finds.org.uk), British Museum and Amgueddfa Cymru, public search counts retrieved 2026. With thanks to the finders and the Finds Liaison Officers who recorded them. Only counts are republished.
- Reece period dates from Nomisma.org (CC BY). District, region and county boundaries from the Office for National Statistics (Open Government Licence v3.0). Base map: OpenFreeMap, OpenStreetMap contributors (ODbL).
- Further reading: R. Reece, “Site-finds in Roman Britain”, Britannia 26 (1995); P. Walton, Rethinking Roman Britain: Coinage and Archaeology (2012); P. Walton and S. Moorhead, “Coinage and collapse?”, Internet Archaeology 41 (2016); R. Henry, “A new corpus of Roman coins from England and Wales”, Britannia 55 (2024); K. Robbins, “Balancing the scales”, Landscapes 14 (2013).
- I wrote the text, with drafting and editing assistance from Claude (Anthropic), which also helped prepare the analysis code. I reviewed and checked all text and results.

