
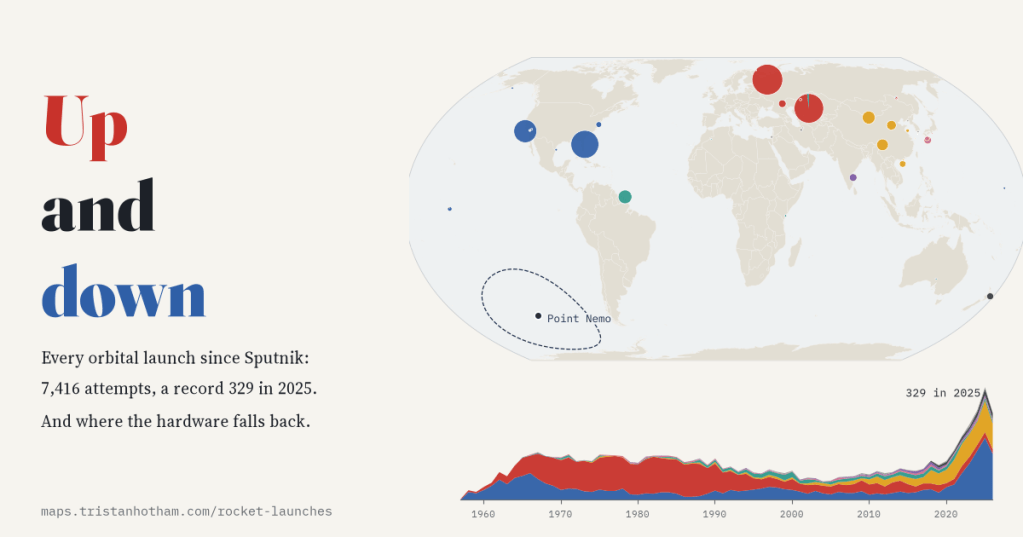
Since Sputnik, rockets have tried to reach orbit 7,416 times. I mapped every one of them from Jonathan McDowell’s catalogue of everything humans have put into space, and then followed the hardware back down, to the loneliest point in the ocean.
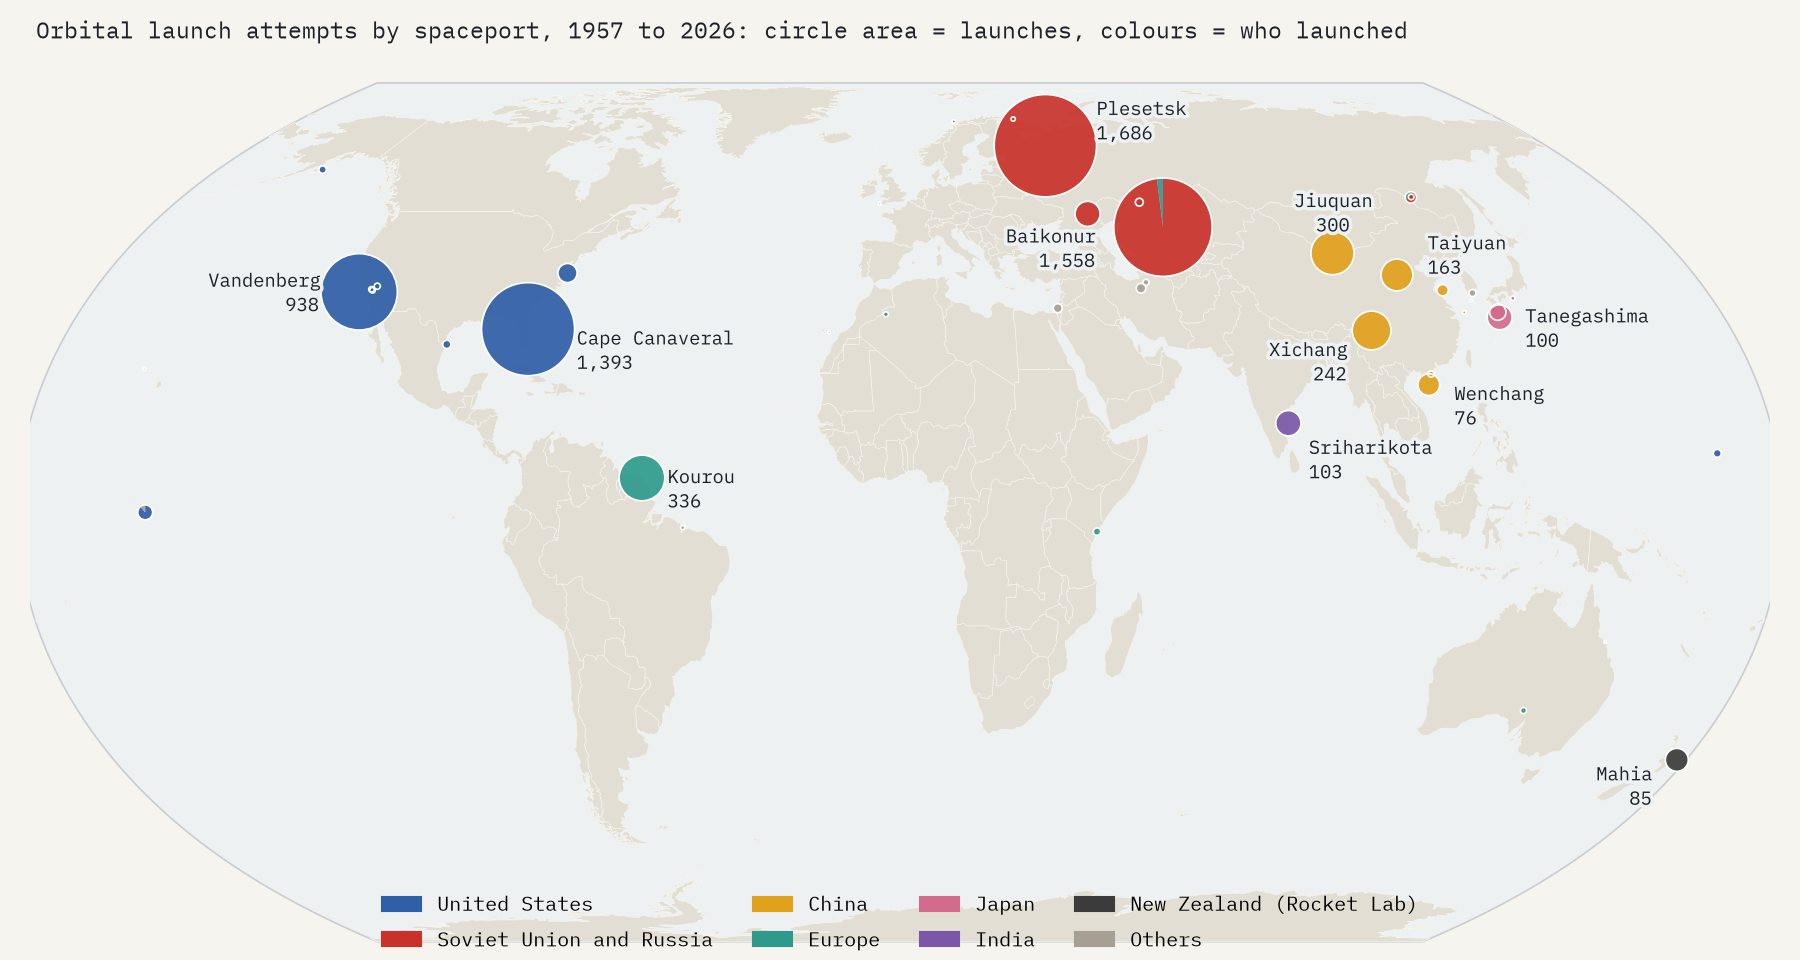
On 4 October 1957 a Soviet rocket put a beeping metal ball called Sputnik into orbit. Jonathan McDowell, an astronomer at the Harvard and Smithsonian Center for Astrophysics, has spent decades cataloguing every launch since, and every satellite, spent rocket stage and scrap of debris they left behind. His General Catalog of Artificial Space Objects, GCAT for short, is free for anyone to use. By my count it holds 7,416 orbital launch attempts, from 46 spaceports, up to 2026 Oct 27.
Put them all on one map and three places dwarf everything else: Plesetsk in the forests of northern Russia, Baikonur on the steppe of Kazakhstan, and Cape Canaveral in Florida.
Three eras
The yearly count tells the story of the space age in one line. The space race took the world from 28 attempts in 1958 to a peak of 139 in 1967. For the next twenty years the Soviet Union kept launching more than a hundred times a year, peaking at 108 in 1982, many of them from Plesetsk. Then the Soviet Union collapsed, and so did the launch rate: by 2004 the whole world managed just 54.
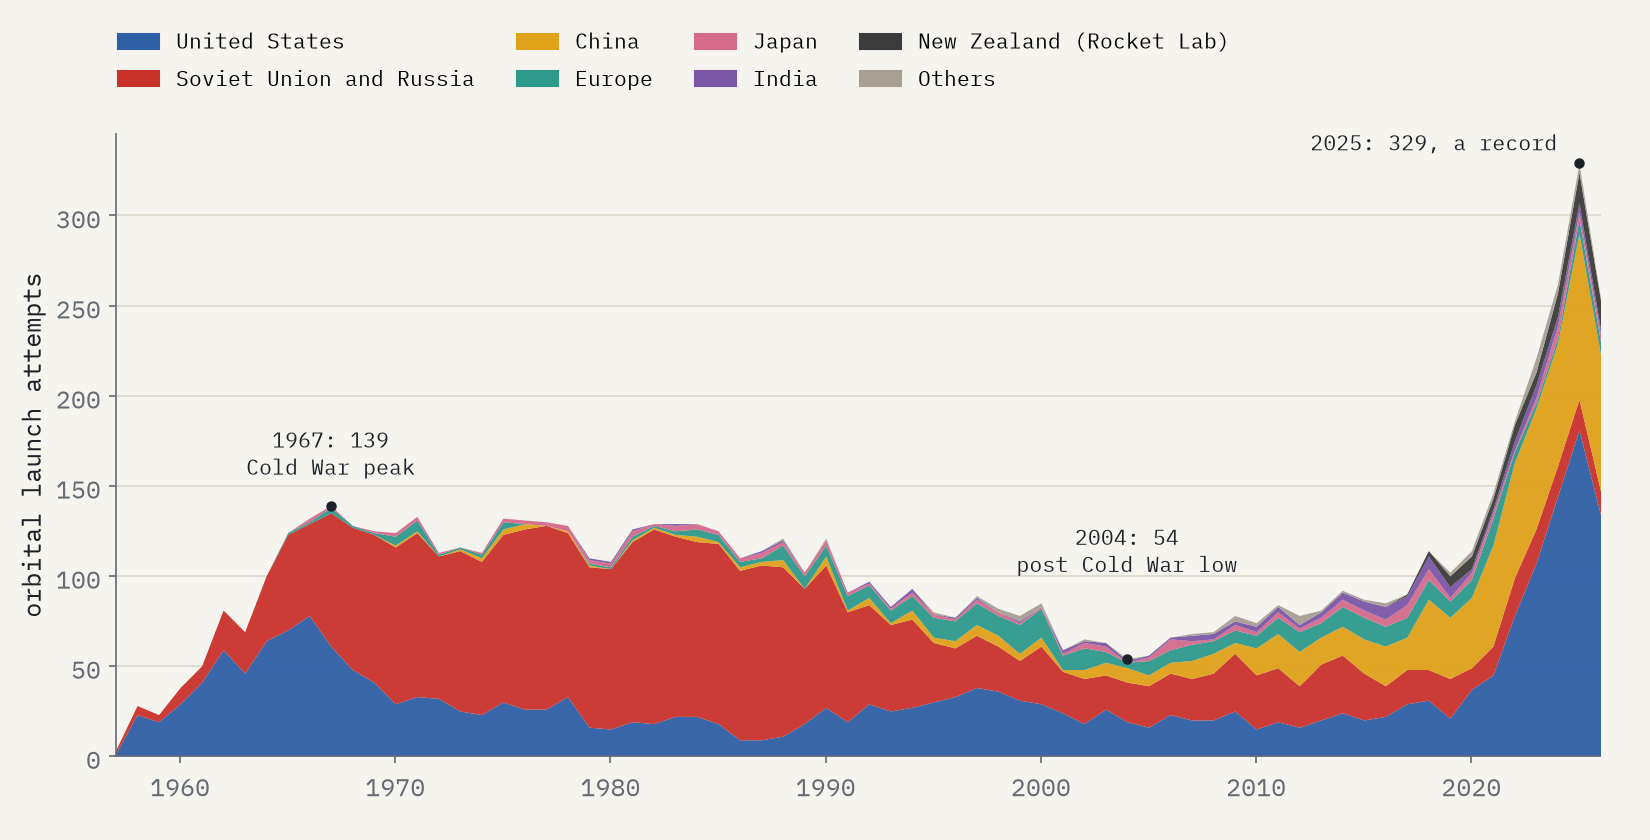
The third era began around 2020. SpaceX’s Falcon 9, whose first stage lands and flies again, started launching every few days, much of the time to build its own Starlink internet constellation. The world beat the 1967 record in 2021, and in 2025 it managed 329 attempts. SpaceX made 170 of them, 52%. China, which launched its first satellite in 1970, made 92. Russia, heir to the busiest space programme of the twentieth century, made 17.
20% of all the orbital launches in seventy years have happened since 2020.
The busiest pads, then and now
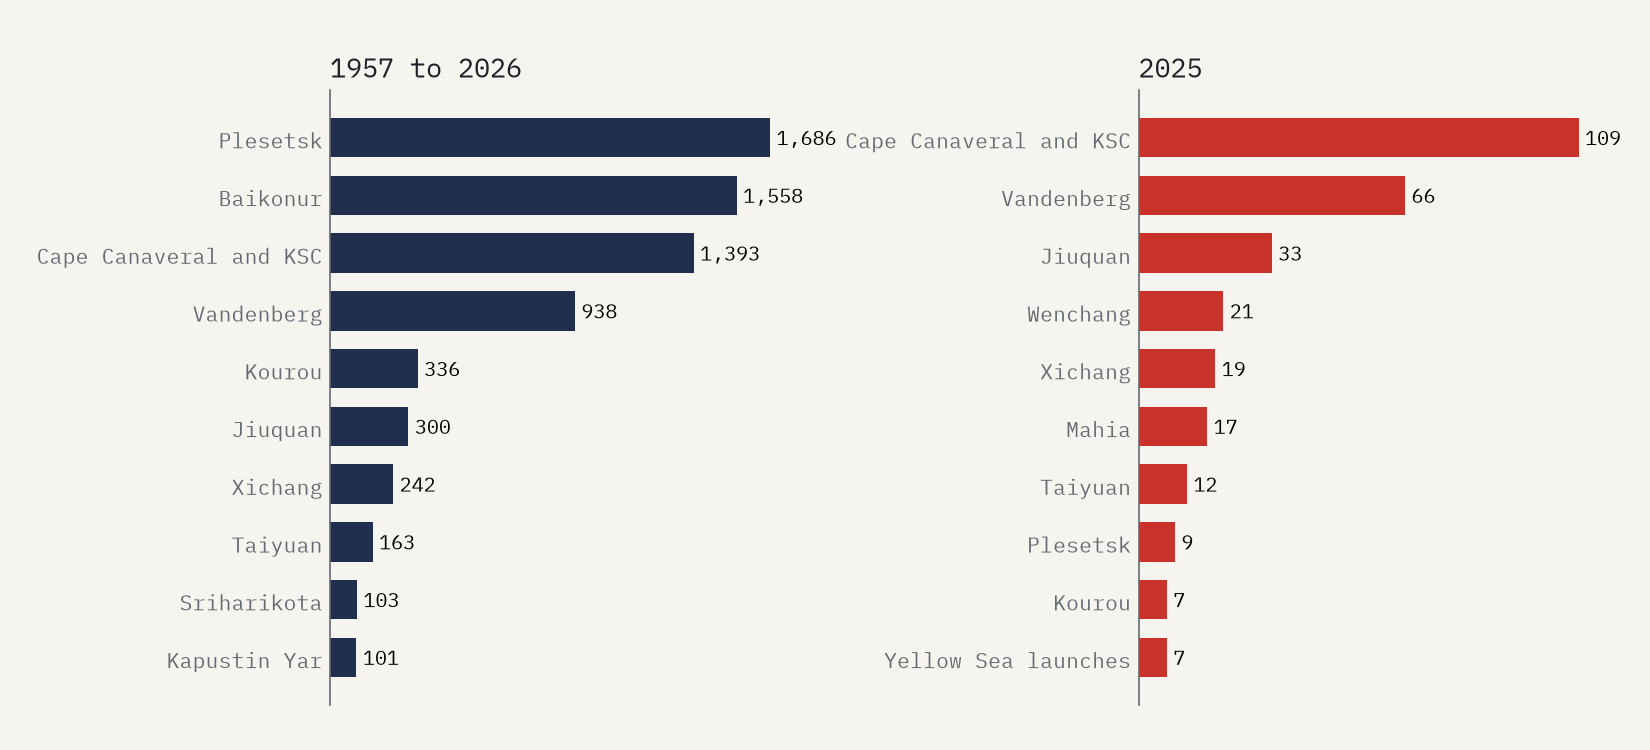
Over the whole period Plesetsk is the busiest spaceport on Earth, with 1,686 attempts, almost all of them during the Cold War. In 2025 it saw 9. Florida, meanwhile, hosted 109 launches, 33% of the world’s total. One of the more surprising names on the current list is Mahia, on a farm called Onenui Station on New Zealand’s North Island, where Rocket Lab built its pad: 17 launches in 2025, more than Baikonur’s 6.
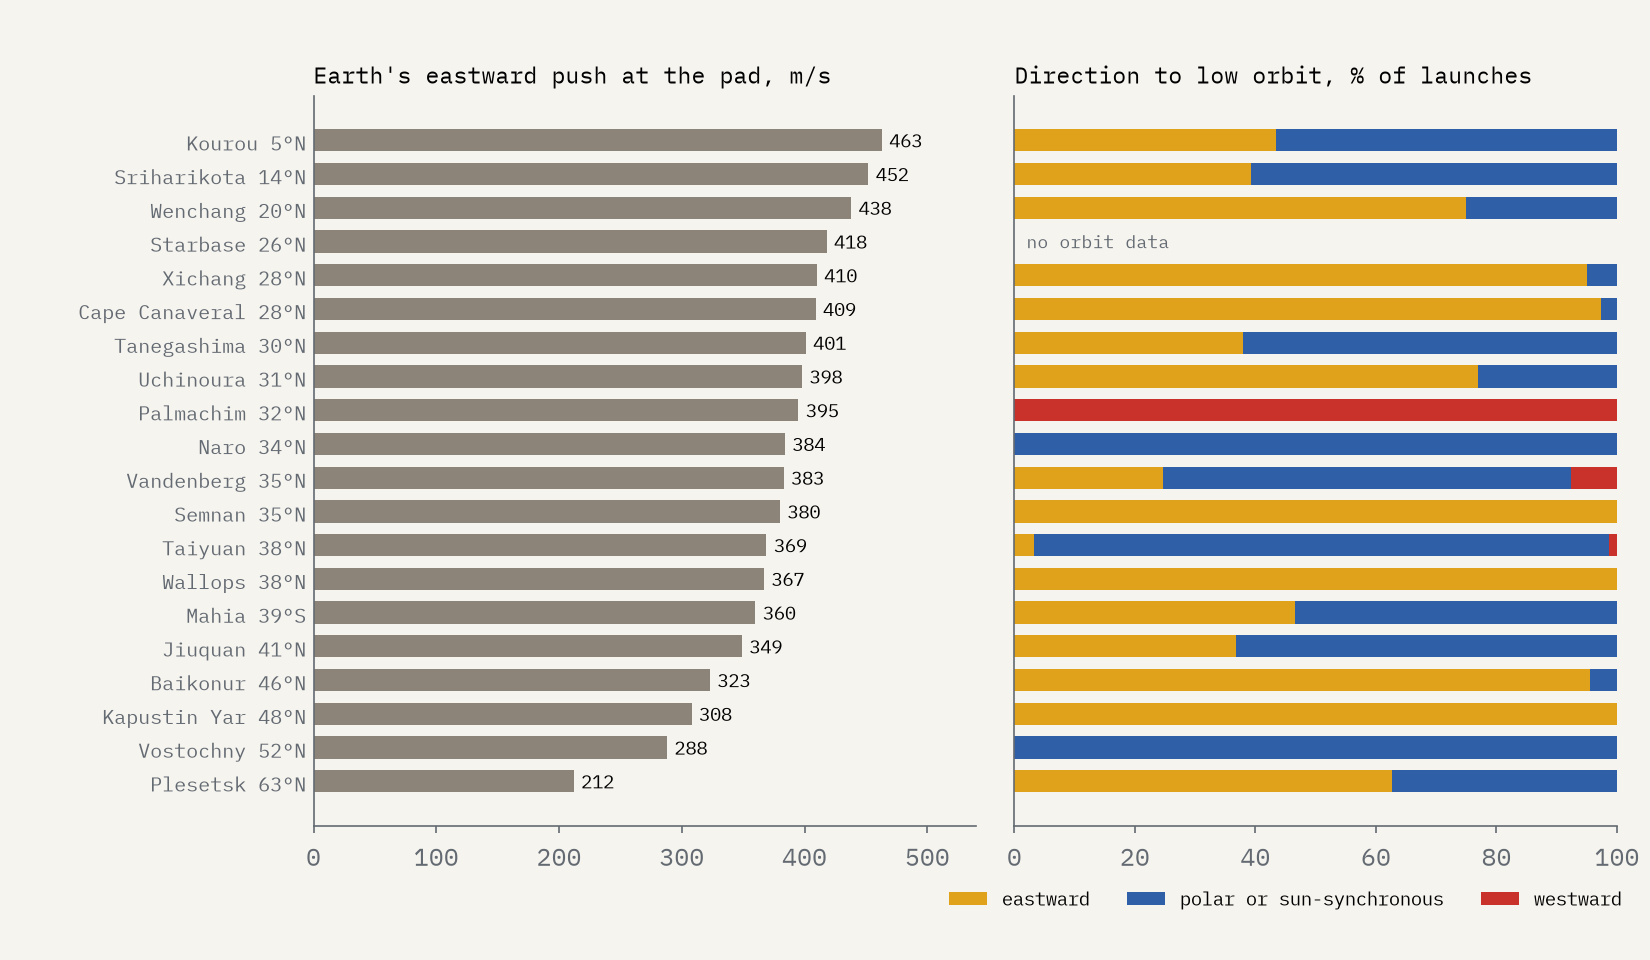
Where a spaceport sits matters. The Earth spins eastwards, so a rocket on the pad already has a free push: 463 m/s at Kourou, close to the equator, but only 323 m/s at Baikonur and 212 m/s at Plesetsk. Latitude matters even more for satellites heading to the geostationary ring over the equator, which is why Europe launches from French Guiana: 70% of Kourou’s launches went towards geostationary orbit, against 18% from Baikonur. Geography sets the direction too. Florida launches east over the Atlantic; Vandenberg south over the Pacific into polar orbits; and Israel launches westward over the Mediterranean, against the Earth’s spin, so that spent stages fall into the sea.
Failures
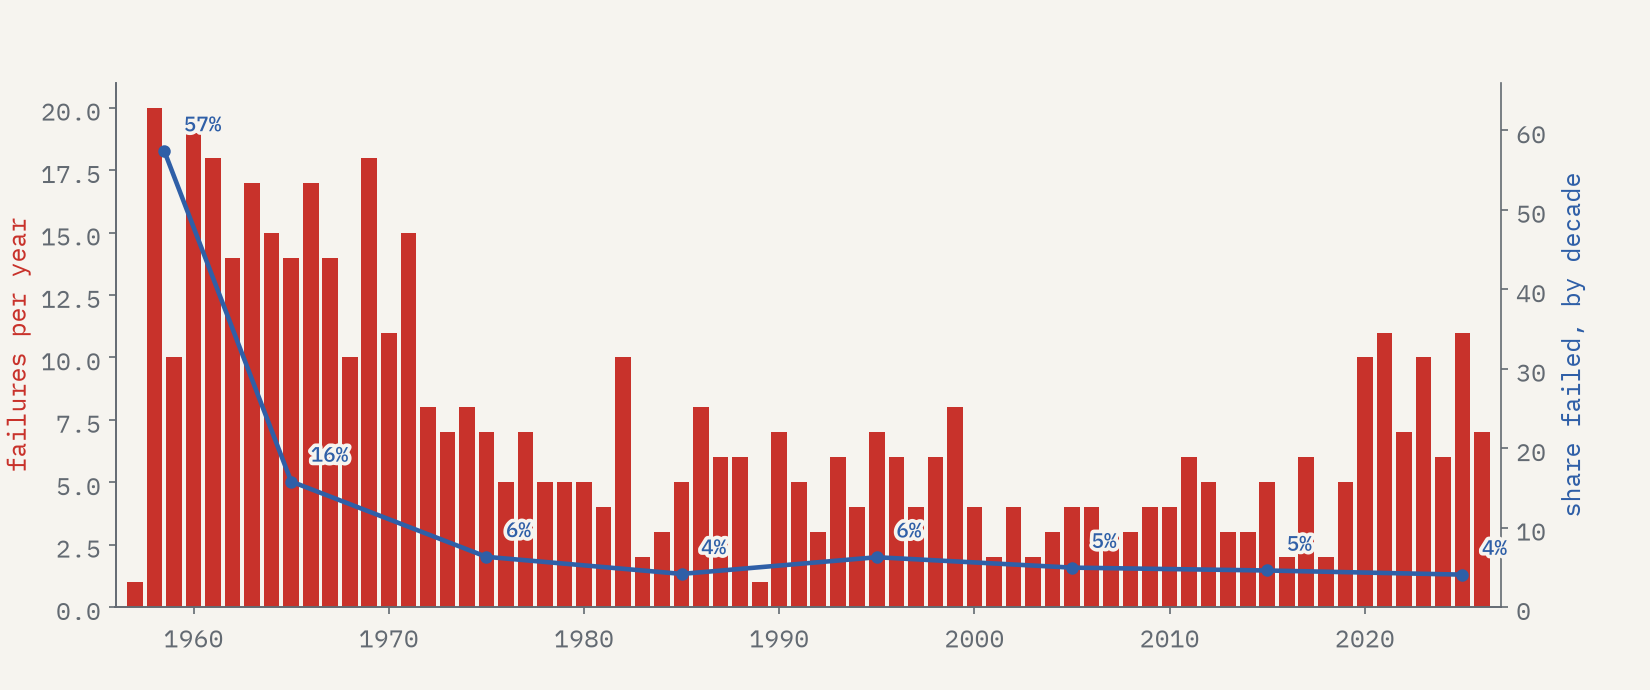
Rockets used to fail a lot. In the first ten years 22% of attempts never reached orbit, and in 1958 20 of 28 failed. By the 1980s the rate was down to about 4%, and it has stayed near there since: 4.1% in the 2020s. But because there are so many more launches, 11 failed in 2025, more than in any year since the early 1970s. In all, 507 rockets, 6.8%, have failed to make it.
What goes up
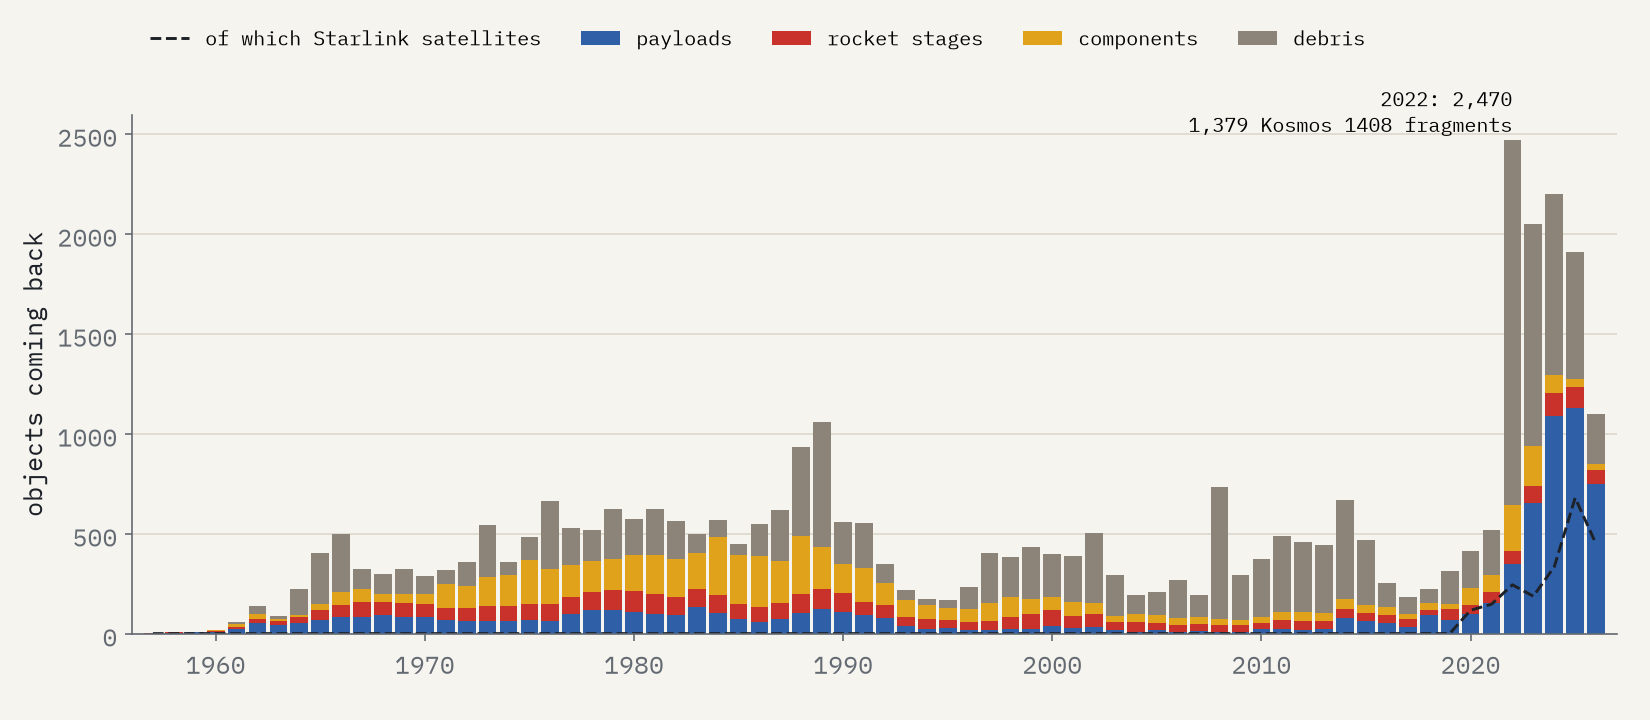
GCAT’s main catalogue lists 69,999 objects that reached orbit or beyond: satellites, rocket stages, nose fairings, adapters and tracked fragments of debris. 34,974 of them, 50%, have already come back down. Almost all simply re-entered as their orbits decayed and burned up; 1,076 landed or were recovered; just 183 were deliberately steered down. The busiest year was 2022, when 1,379 of the 2,470 objects that fell were fragments of Kosmos 1408, an old Soviet satellite that Russia blew apart with a missile in November 2021. In 2025, 36% of everything that came down was a retired Starlink satellite.
Point Nemo
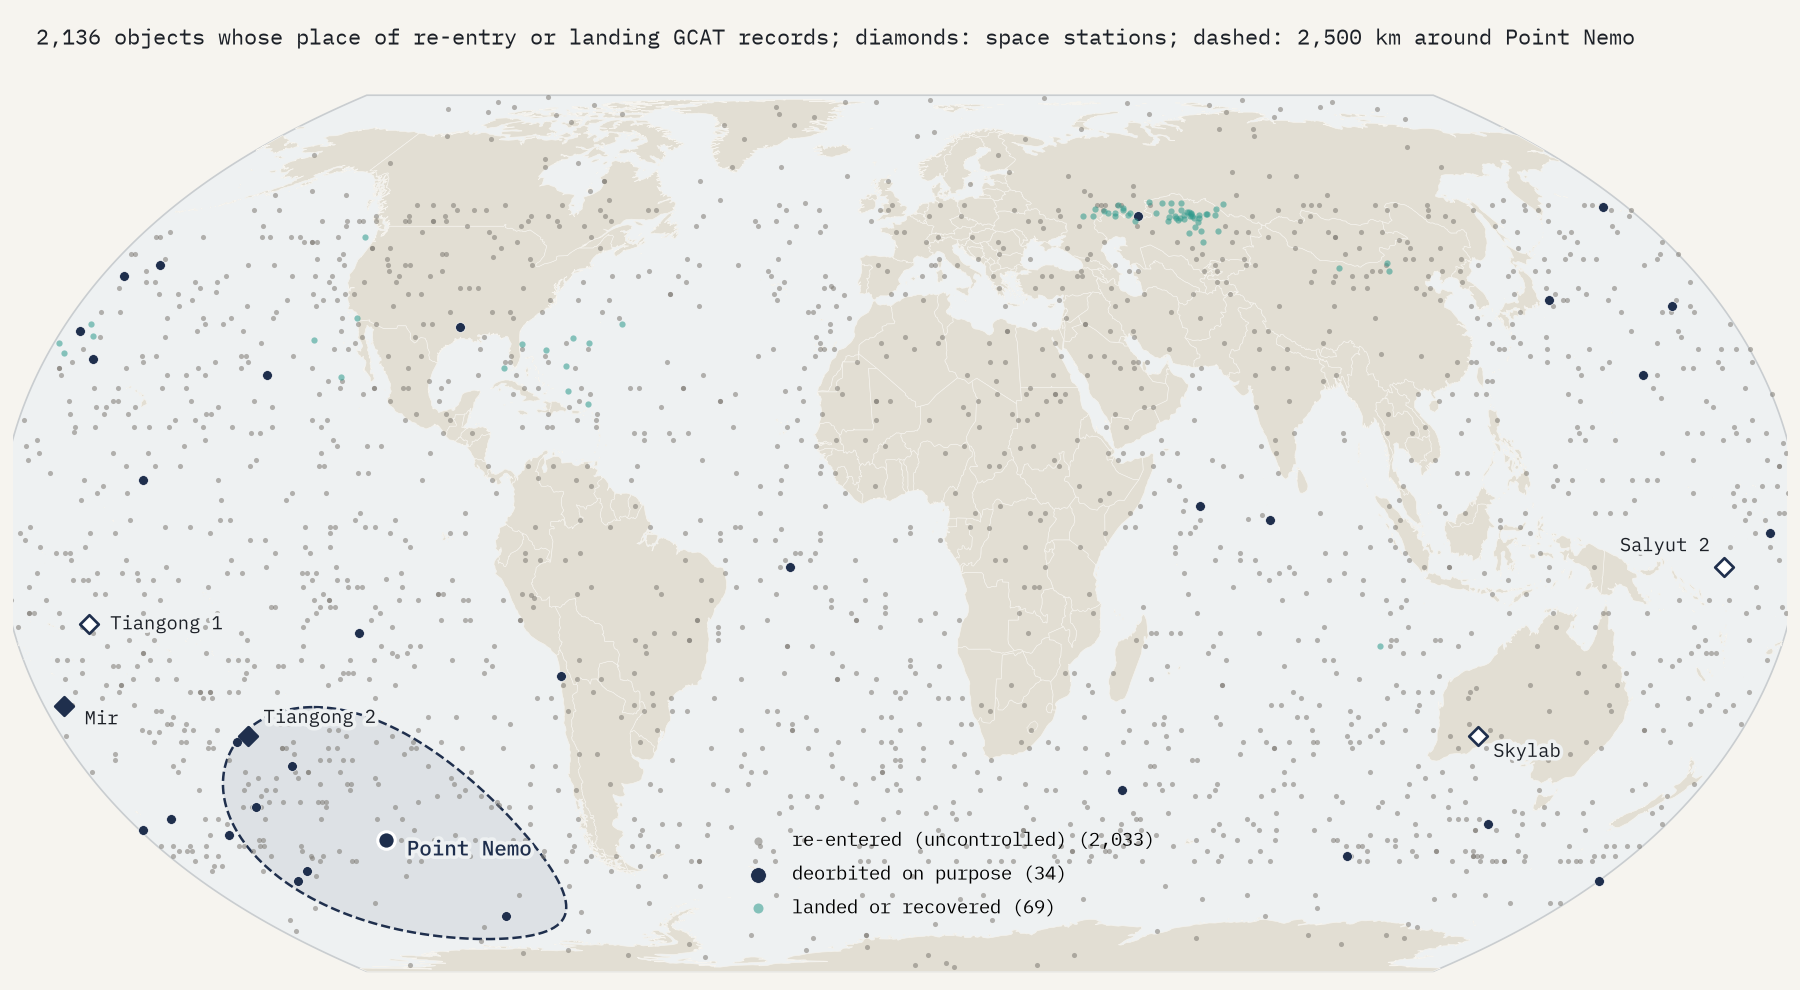
Point Nemo, at 48.88°S 123.39°W, is the place in the ocean farthest from land, about 2,688 km from the nearest island. Because nobody lives there and few ships pass, space agencies aim their largest returning spacecraft at the sea around it. Wikipedia’s article on this spacecraft cemetery counts more than 260 craft disposed of there between 1971 to 2016, including Mir and Russian, Japanese and European cargo ships, and the International Space Station is due to follow in 2031. GCAT shows Salyut 1, 3, 4, 5 and 6 deorbited into the Pacific, Mir in March 2001 and China’s Tiangong 2 in 2019; Skylab, Salyut 7 and Tiangong 1 fell on their own, over Australia, Argentina and the central Pacific.
For 2,136 objects GCAT also records a rough place of re-entry. They tell a less tidy story. The uncontrolled ones fall everywhere their orbits reach: 76% over the sea, close to the ocean’s share of the planet, and only 5.1% within 2,500 km of Point Nemo. The cemetery is real, but it is for the few big things we can steer. Most space junk falls wherever it falls.
How I did this
Everything comes from GCAT release 1.8.8: the launch list, sites, organisations and the main object catalogue. I counted every launch GCAT codes as orbital or deep space, left out pad explosions and aborts before lift-off, and treated anything it codes as a failure, including partial failures, as a failure. Who launched comes from the country of the first agency GCAT lists, so Rocket Lab’s flights count for New Zealand and Starsem’s Soyuz flights from Baikonur for Europe. I merged launch sites that were renamed or sit side by side, such as Cape Canaveral and the Kennedy Space Center. GCAT has no launch azimuths, so direction comes from the orbit’s inclination. The re-entry places are GCAT’s own rough coordinates; I did not estimate any. The 2,500 km circle around Point Nemo is mine, for drawing and counting, not an official boundary. The paper sets out every step and caveat.
Notes and sources
- Jonathan C. McDowell, General Catalog of Artificial Space Objects (GCAT), release 1.8.8, CC BY 4.0. Data from GCAT (J. McDowell, planet4589.org/space/gcat).
- Wikipedia, Pole of inaccessibility (Point Nemo) and Spacecraft cemetery, CC BY-SA 4.0, for the facts about Point Nemo.
- Natural Earth country outlines and land (public domain).
- I wrote the text, with drafting and editing assistance from Claude (Anthropic), which also helped prepare the analysis code. I reviewed and checked all text and results.

